Employee Kpi Dashboard
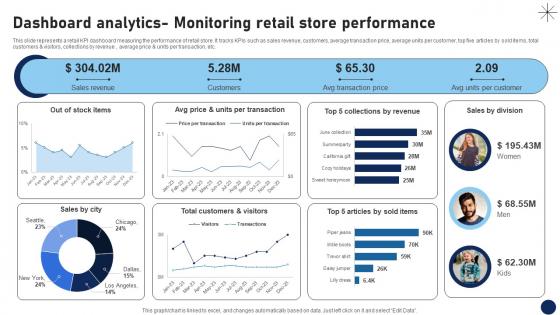
Dashboard Analytics Monitoring Retail Store Performance DT SS V
This slide represents a retail KPI dashboard measuring the performance of retail store. It tracks KPIs such as sales revenue, customers, average transaction price, average units per customer, top five articles by sold items, total customers and visitors, collections by revenue , average price and units per transaction, etc.Are you in need of a template that can accommodate all of your creative concepts This one is crafted professionally and can be altered to fit any style. Use it with Google Slides or PowerPoint. Include striking photographs, symbols, depictions, and other visuals. Fill, move around, or remove text boxes as desired. Test out color palettes and font mixtures. Edit and save your work, or work with colleagues. Download Dashboard Analytics Monitoring Retail Store Performance DT SS V and observe how to make your presentation outstanding. Give an impeccable presentation to your group and make your presentation unforgettable.
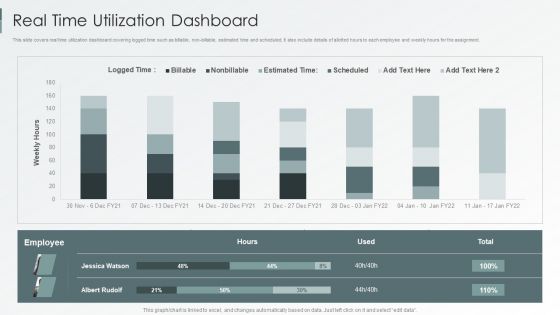
Enterprise Sustainability Performance Metrics Real Time Utilization Dashboard Portrait PDF
This slide covers real time utilization dashboard covering logged time such as billable, non-billable, estimated time and scheduled. It also include details of allotted hours to each employee and weekly hours for the assignment.Deliver and pitch your topic in the best possible manner with this Enterprise Sustainability Performance Metrics Real Time Utilization Dashboard Portrait PDF. Use them to share invaluable insights on Real Time, Utilization Dashboard and impress your audience. This template can be altered and modified as per your expectations. So, grab it now.
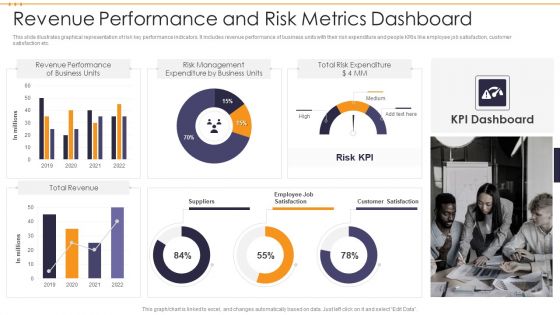
Revenue Performance And Risk Metrics Dashboard Demonstration PDF
This slide illustrates graphical representation of risk key performance indicators. It includes revenue performance of business units with their risk expenditure and people KRIs like employee job satisfaction, customer satisfaction etc. Showcasing this set of slides titled Revenue Performance And Risk Metrics Dashboard Demonstration PDF. The topics addressed in these templates are Total Risk Expenditure, Risk Management, Revenue Performance . All the content presented in this PPT design is completely editable. Download it and make adjustments in color, background, font etc. as per your unique business setting.
Dashboard For Tracking Aftersales Customer Services Team Performance Pictures PDF
This slide covers the KPI dashboard for ticket tracking. It includes metrics such as tickets by month, service level, and details of customer service department agents. Here you can discover an assortment of the finest PowerPoint and Google Slides templates. With these templates, you can create presentations for a variety of purposes while simultaneously providing your audience with an eye catching visual experience. Download Dashboard For Tracking Aftersales Customer Services Team Performance Pictures PDF to deliver an impeccable presentation. These templates will make your job of preparing presentations much quicker, yet still, maintain a high level of quality. Slidegeeks has experienced researchers who prepare these templates and write high quality content for you. Later on, you can personalize the content by editing the Dashboard For Tracking Aftersales Customer Services Team Performance Pictures PDF.
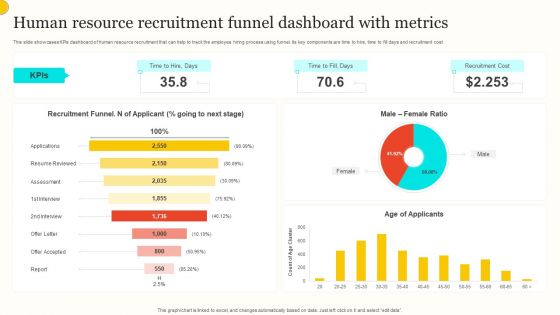
Human Resource Recruitment Funnel Dashboard With Metrics Summary PDF
This slide showcases KPIs dashboard of human resource recruitment that can help to track the employee hiring process using funnel. Its key components are time to hire, time to fill days and recruitment cost. Showcasing this set of slides titled Human Resource Recruitment Funnel Dashboard With Metrics Summary PDF. The topics addressed in these templates are Recruitment Funnel, Male Female Ratio, Age Applicants. All the content presented in this PPT design is completely editable. Download it and make adjustments in color, background, font etc. as per your unique business setting.

Customer Service Metrics Dashboard With Average Response Time Formats PDF
This slide showcases KPI dashboard for customer service that can help to evaluate the performance of call center agents and identify issues arising from different channels. Its key components are number of issues in last 1 day, average time to closes, first call resolution, daily average response time, average time to close by channel and top performing call agents. Pitch your topic with ease and precision using this Customer Service Metrics Dashboard With Average Response Time Formats PDF. This layout presents information on Customer Service, Metrics Dashboard, Average Response Time. It is also available for immediate download and adjustment. So, changes can be made in the color, design, graphics or any other component to create a unique layout.
Dashboard For Tracking Aftersales Customer Services Team Performance Portrait PDF
This slide covers the KPI dashboard for ticket tracking. It includes metrics such as tickets by month, service level, and details of customer service department agents. Retrieve professionally designed Dashboard For Tracking Aftersales Customer Services Team Performance Portrait PDF to effectively convey your message and captivate your listeners. Save time by selecting pre-made slideshows that are appropriate for various topics, from business to educational purposes. These themes come in many different styles, from creative to corporate, and all of them are easily adjustable and can be edited quickly. Access them as PowerPoint templates or as Google Slides themes. You do not have to go on a hunt for the perfect presentation because Slidegeeks got you covered from everywhere.
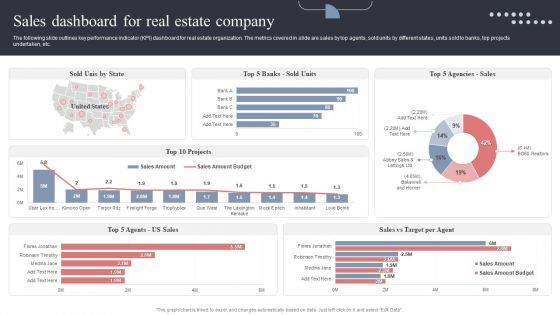
Sales Dashboard For Real Estate Company Topics PDF
The following slide outlines key performance indicator KPI dashboard for real estate organization. The metrics covered in slide are sales by top agents, sold units by different states, units sold to banks, top projects undertaken, etc. This Sales Dashboard For Real Estate Company Topics PDF is perfect for any presentation, be it in front of clients or colleagues. It is a versatile and stylish solution for organizing your meetings. The Sales Dashboard For Real Estate Company Topics PDF features a modern design for your presentation meetings. The adjustable and customizable slides provide unlimited possibilities for acing up your presentation. Slidegeeks has done all the homework before launching the product for you. So, do not wait, grab the presentation templates today
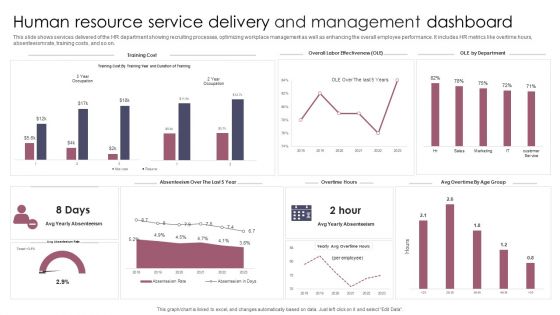
Human Resource Service Delivery And Management Dashboard Information PDF
This slide shows services delivered of the HR department showing recruiting processes, optimizing workplace management as well as enhancing the overall employee performance. It includes HR metrics like overtime hours, absenteeism rate, training costs, and so on. Pitch your topic with ease and precision using this Human Resource Service Delivery And Management Dashboard Information PDF. This layout presents information on Human Resource Service Delivery, Management Dashboard. It is also available for immediate download and adjustment. So, changes can be made in the color, design, graphics or any other component to create a unique layout.
Tiktok Marketing Campaign Performance Tracking Dashboard Background PDF
This slide represents the KPI dashboard to effective track and monitor TikTok marketing campaign conducted by the organization. It includes KPIs such as total cost, impressions, reach, clicks etc. Coming up with a presentation necessitates that the majority of the effort goes into the content and the message you intend to convey. The visuals of a PowerPoint presentation can only be effective if it supplements and supports the story that is being told. Keeping this in mind our experts created Tiktok Marketing Campaign Performance Tracking Dashboard Background PDF to reduce the time that goes into designing the presentation. This way, you can concentrate on the message while our designers take care of providing you with the right template for the situation.
Facebook Ad Campaign Performance Tracking Dashboard Ppt Show Picture PDF
This slide represents the KPI dashboard to effectively measure and monitor performance of Facebook marketing campaign conducted by the organization to enhance customer engagement. It includes details related to KPIs such as ad impressions, ad reach etc. Are you in need of a template that can accommodate all of your creative concepts This one is crafted professionally and can be altered to fit any style. Use it with Google Slides or PowerPoint. Include striking photographs, symbols, depictions, and other visuals. Fill, move around, or remove text boxes as desired. Test out color palettes and font mixtures. Edit and save your work, or work with colleagues. Download Facebook Ad Campaign Performance Tracking Dashboard Ppt Show Picture PDF and observe how to make your presentation outstanding. Give an impeccable presentation to your group and make your presentation unforgettable.
Facebook Ad Campaign Performance Tracking Dashboard Ppt Ideas Objects PDF
This slide represents the KPI dashboard to effectively measure and monitor performance of Facebook marketing campaign conducted by the organization to enhance customer engagement. It includes details related to KPIs such as ad impressions, ad reach etc. Are you in need of a template that can accommodate all of your creative concepts This one is crafted professionally and can be altered to fit any style. Use it with Google Slides or PowerPoint. Include striking photographs, symbols, depictions, and other visuals. Fill, move around, or remove text boxes as desired. Test out color palettes and font mixtures. Edit and save your work, or work with colleagues. Download Facebook Ad Campaign Performance Tracking Dashboard Ppt Ideas Objects PDF and observe how to make your presentation outstanding. Give an impeccable presentation to your group and make your presentation unforgettable.

Work From Home Performance Management Dashboard Optimizing Staff Retention Rate Topics Pdf
The following slide outlines a comprehensive key performance indicator KPI dashboard that can be used to showcase employees performance during work-from-home WFH. Information covered in this slide is related to average result area scores etc. This Work From Home Performance Management Dashboard Optimizing Staff Retention Rate Topics Pdf is perfect for any presentation, be it in front of clients or colleagues. It is a versatile and stylish solution for organizing your meetings. The Work From Home Performance Management Dashboard Optimizing Staff Retention Rate Topics Pdf features a modern design for your presentation meetings. The adjustable and customizable slides provide unlimited possibilities for acing up your presentation. Slidegeeks has done all the homework before launching the product for you. So, do not wait, grab the presentation templates today

Adopting Flexible Work Policy Work From Home Performance Management Dashboard Demonstration PDF
The following slide outlines a comprehensive key performance indicator KPI dashboard that can be used to showcase employees performance during work-from-home WFH. Information covered in this slide is related to average result area scores etc. Slidegeeks is one of the best resources for PowerPoint templates. You can download easily and regulate Adopting Flexible Work Policy Work From Home Performance Management Dashboard Demonstration PDF for your personal presentations from our wonderful collection. A few clicks is all it takes to discover and get the most relevant and appropriate templates. Use our Templates to add a unique zing and appeal to your presentation and meetings. All the slides are easy to edit and you can use them even for advertisement purposes.
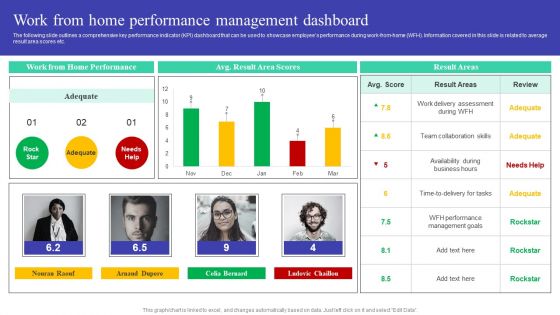
Implementing Adaptive Work Arrangements Work From Home Performance Management Dashboard Elements PDF
The following slide outlines a comprehensive key performance indicator KPI dashboard that can be used to showcase employees performance during work-from-home WFH. Information covered in this slide is related to average result area scores etc. Slidegeeks has constructed Implementing Adaptive Work Arrangements Work From Home Performance Management Dashboard Elements PDF after conducting extensive research and examination. These presentation templates are constantly being generated and modified based on user preferences and critiques from editors. Here, you will find the most attractive templates for a range of purposes while taking into account ratings and remarks from users regarding the content. This is an excellent jumping off point to explore our content and will give new users an insight into our top notch PowerPoint Templates.

Tactics For Establishing Sustainable Hybrid Work Environment Work From Home Performance Management Dashboard Information PDF
The following slide outlines a comprehensive key performance indicator KPI dashboard that can be used to showcase employees performance during work-from-home WFH. Information covered in this slide is related to average result area scores etc. Want to ace your presentation in front of a live audience Our Tactics For Establishing Sustainable Hybrid Work Environment Work From Home Performance Management Dashboard Information PDF can help you do that by engaging all the users towards you. Slidegeeks experts have put their efforts and expertise into creating these impeccable powerpoint presentations so that you can communicate your ideas clearly. Moreover, all the templates are customizable, and easy to edit and downloadable. Use these for both personal and commercial use.

Project Metrics Dashboard With Task Status Rules PDF
This slide shows the project management dashboard which shows the number of team members of managing project activities, estimated and actual time to complete the project task, hours taken by employees with achieved and open milestones and progress status. Pitch your topic with ease and precision using this Project Metrics Dashboard With Task Status Rules PDF. This layout presents information on Team Members, Employee. It is also available for immediate download and adjustment. So, changes can be made in the color, design, graphics or any other component to create a unique layout.

Project Metrics Dashboard Showing Organizational Progress Demonstration PDF
This slide covers the project management dashboard that shows the two year timeline of project tasks and activities such as hiring survey consultants, writing curriculum, creating employees training programs with initiative, its description, budget, end date, milestones, etc. Pitch your topic with ease and precision using this Project Metrics Dashboard Showing Organizational Progress Demonstration PDF. This layout presents information on Budget, Survey, Employees. It is also available for immediate download and adjustment. So, changes can be made in the color, design, graphics or any other component to create a unique layout.

Learning And Development Metrics Overview Analysis Dashboard Graphics PDF
This slide shows dashboard of employees trained in different locations for learning and development activity. It includes elements such as total invited, total trained, unique trained, total active employees, total programs etc. Pitch your topic with ease and precision using this Learning And Development Metrics Overview Analysis Dashboard Graphics PDF. This layout presents information on Unique Trained YTD, Training Man Days, Total Programs. It is also available for immediate download and adjustment. So, changes can be made in the color, design, graphics or any other component to create a unique layout.

Project Metrics Dashboard With Workload Percentage Ideas PDF
This slide shows the project management dashboard which focuses on overall progress, projected launch date, name of tasks assigned to the employees responsible for managing project such as interactive dashboard features, setup test environment, finalize the testing plan. Showcasing this set of slides titled Project Metrics Dashboard With Workload Percentage Ideas PDF. The topics addressed in these templates are Environment, Plan, Dashboard. All the content presented in this PPT design is completely editable. Download it and make adjustments in color, background, font etc. as per your unique business setting.

Organization Cyber Security Dashboard Ppt Show Outfit PDF
This slide covers the cyber security key performance indicators for the organization including application health, device license consumption, data encryption status and many more. Deliver an awe inspiring pitch with this creative organization cyber security dashboard ppt show outfit pdf bundle. Topics like operating systems, license consumption, makes and models, other employees can be discussed with this completely editable template. It is available for immediate download depending on the needs and requirements of the user.
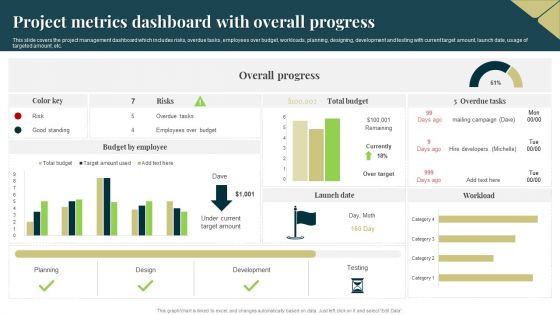
Project Metrics Dashboard With Overall Progress Brochure PDF
This slide covers the project management dashboard which includes risks, overdue tasks, employees over budget, workloads, planning, designing, development and testing with current target amount, launch date, usage of targeted amount, etc. Pitch your topic with ease and precision using this Project Metrics Dashboard With Overall Progress Brochure PDF. This layout presents information on Design, Planning, Development. It is also available for immediate download and adjustment. So, changes can be made in the color, design, graphics or any other component to create a unique layout.
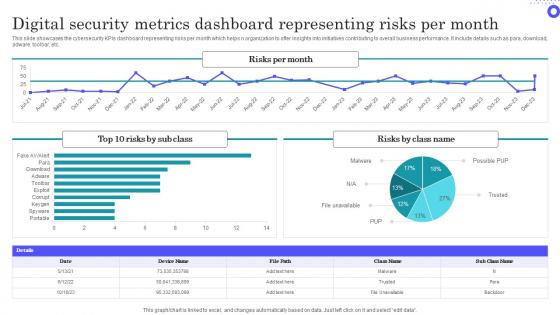
Digital Security Metrics Dashboard Representing Risks Per Month Themes Pdf
Showcasing this set of slides titled Digital Security Metrics Dashboard Representing Risks Per Month Themes Pdf The topics addressed in these templates are Digital Security, Metrics Dashboard, Representing Risks All the content presented in this PPT design is completely editable. Download it and make adjustments in color, background, font etc. as per your unique business setting.
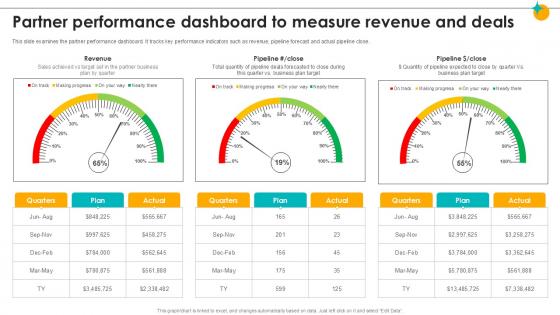
Partner Performance Dashboard To Measure Revenue Partner Relationship Ppt Template
This slide examines the partner performance dashboard. It tracks key performance indicators such as revenue, pipeline forecast and actual pipeline close. Are you in need of a template that can accommodate all of your creative concepts This one is crafted professionally and can be altered to fit any style. Use it with Google Slides or PowerPoint. Include striking photographs, symbols, depictions, and other visuals. Fill, move around, or remove text boxes as desired. Test out color palettes and font mixtures. Edit and save your work, or work with colleagues. Download Partner Performance Dashboard To Measure Revenue Partner Relationship Ppt Template and observe how to make your presentation outstanding. Give an impeccable presentation to your group and make your presentation unforgettable.
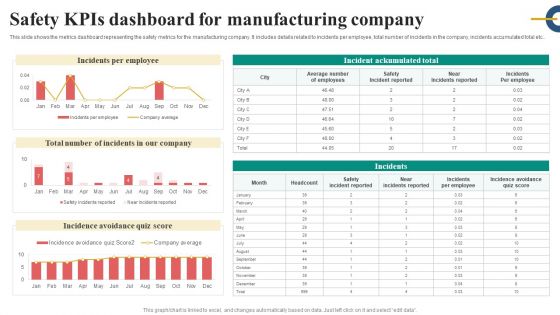
Safety Kpis Dashboard For Manufacturing Company Slides PDF
This slide shows the metrics dashboard representing the safety metrics for the manufacturing company. It includes details related to incidents per employee, total number of incidents in the company, incidents accumulated total etc.. Pitch your topic with ease and precision using this Safety Kpis Dashboard For Manufacturing Company Slides PDF. This layout presents information on Incidents Per Employee, Safety Incident Reported, Incidence Avoidance Quiz Score. It is also available for immediate download and adjustment. So, changes can be made in the color, design, graphics or any other component to create a unique layout.
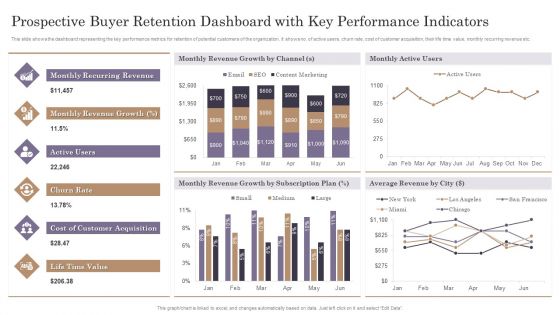
Prospective Buyer Retention Dashboard With Key Performance Indicators Themes PDF
This slide shows the dashboard representing the key performance metrics for retention of potential customers of the organization. It shows no. of active users, churn rate, cost of customer acquisition, their life time value, monthly recurring revenue etc.Pitch your topic with ease and precision using this Prospective Buyer Retention Dashboard With Key Performance Indicators Themes PDF. This layout presents information on Recurring Revenue, Revenue Growth, Customer Acquisition. It is also available for immediate download and adjustment. So, changes can be made in the color, design, graphics or any other component to create a unique layout.
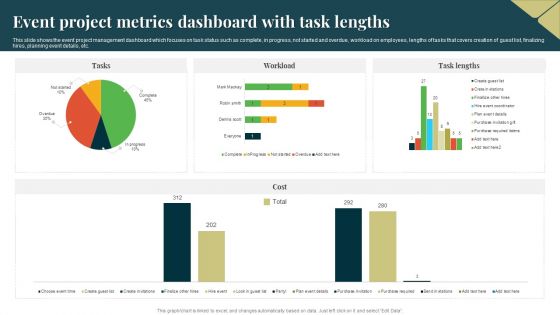
Event Project Metrics Dashboard With Task Lengths Template PDF
This slide shows the event project management dashboard which focuses on task status such as complete, in progress, not started and overdue, workload on employees, lengths of tasks that covers creation of guest list, finalizing hires, planning event details, etc. Showcasing this set of slides titled Event Project Metrics Dashboard With Task Lengths Template PDF. The topics addressed in these templates are Event Project Metrics Dashboard, Cost. All the content presented in this PPT design is completely editable. Download it and make adjustments in color, background, font etc. as per your unique business setting.

Project Metrics Dashboard With Launch Date Formats PDF
This slide covers the project management dashboard which includes status of project phases such as planning, designing, development and testing that also focuses on launch date of project, overdue tasks with date, deadline, etc. and workload on employees. Showcasing this set of slides titled Project Metrics Dashboard With Launch Date Formats PDF. The topics addressed in these templates are Budget, Project Launch Data, Development. All the content presented in this PPT design is completely editable. Download it and make adjustments in color, background, font etc. as per your unique business setting.
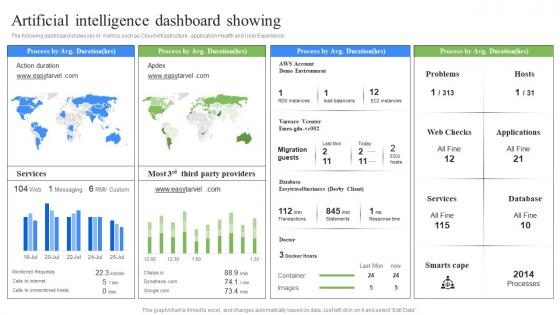
Artificial Intelligence Dashboard Showing RPA Influence On Industries Slides Pdf
The following dashboard shows key AI metrics such as Cloud infrastructure , application Health and User Experience. Create an editable Artificial Intelligence Dashboard Showing RPA Influence On Industries Slides Pdf that communicates your idea and engages your audience. Whether you are presenting a business or an educational presentation, pre-designed presentation templates help save time. Artificial Intelligence Dashboard Showing RPA Influence On Industries Slides Pdf is highly customizable and very easy to edit, covering many different styles from creative to business presentations. Slidegeeks has creative team members who have crafted amazing templates. So, go and get them without any delay.
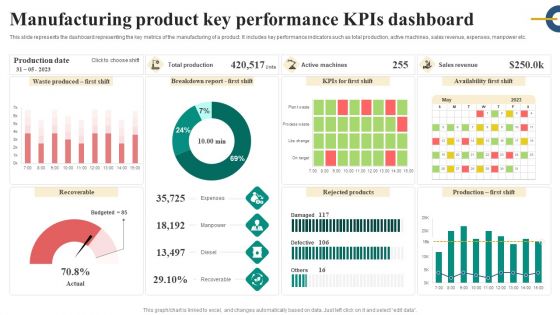
Manufacturing Product Key Performance Kpis Dashboard Inspiration PDF
This slide represents the dashboard representing the key metrics of the manufacturing of a product. It includes key performance indicators such as total production, active machines, sales revenue, expenses, manpower etc. Showcasing this set of slides titled Manufacturing Product Key Performance Kpis Dashboard Inspiration PDF. The topics addressed in these templates are Expenses, Manpower, Diesel, Recoverable. All the content presented in this PPT design is completely editable. Download it and make adjustments in color, background, font etc. as per your unique business setting.

Safety Risk Management Dashboard For Manufacturing Company Introduction PDF
This slide displays security metrics for company which includes number of critical incidents, cost, type, days since last accident to keep a track of Improvement needed in security performance. Showcasing this set of slides titled Safety Risk Management Dashboard For Manufacturing Company Introduction PDF. The topics addressed in these templates are Incident Per Employee, Total Incident Our Company, Incidence Avoidance Quiz Store. All the content presented in this PPT design is completely editable. Download it and make adjustments in color, background, font etc. as per your unique business setting.

Startup Business Financial Dashboard With Key Metrics Sample PDF
This slide represents the financial dashboard for startup company with key performance indicators. It includes details related to current working capital, cash conversion cycle in days and vendor payment error rate. Pitch your topic with ease and precision using this Startup Business Financial Dashboard With Key Metrics Sample PDF. This layout presents information on Cash Conversion Cycle, Current Working Capital, Current Liabilities Debt. It is also available for immediate download and adjustment. So, changes can be made in the color, design, graphics or any other component to create a unique layout.
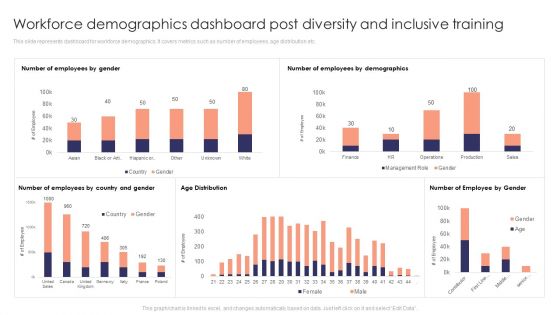
Workforce Demographics Dashboard Post Diversity And Inclusive Training Background PDF
This slide represents dashboard for workforce demographics. It covers metrics such as number of employees, age distribution etc. Make sure to capture your audiences attention in your business displays with our gratis customizable Workforce Demographics Dashboard Post Diversity And Inclusive Training Background PDF. These are great for business strategies, office conferences, capital raising or task suggestions. If you desire to acquire more customers for your tech business and ensure they stay satisfied, create your own sales presentation with these plain slides.
Education Dashboard Icon With Student Performance Analysis Metrics Information PDF
Presenting Education Dashboard Icon With Student Performance Analysis Metrics Information PDF to dispense important information. This template comprises four stages. It also presents valuable insights into the topics including Education Dashboard Icon, Student Performance, Analysis Metrics. This is a completely customizable PowerPoint theme that can be put to use immediately. So, download it and address the topic impactfully.
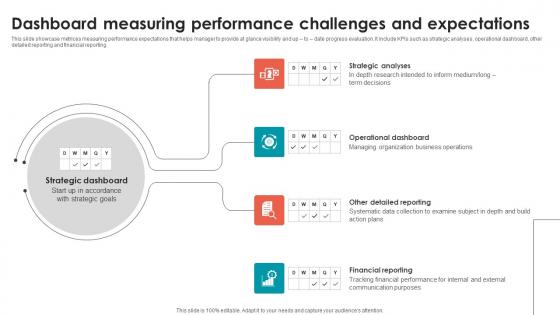
Dashboard Measuring Performance Challenges And Expectations Portrait Pdf
This slide showcase metrices measuring performance expectations that helps manager to provide at glance visibility and up to date progress evaluation. It include KPIs such as strategic analyses, operational dashboard, other detailed reporting and financial reporting. Showcasing this set of slides titled Dashboard Measuring Performance Challenges And Expectations Portrait Pdf. The topics addressed in these templates are Operational Dashboard, Strategic Analyses, Financial Reporting. All the content presented in this PPT design is completely editable. Download it and make adjustments in color, background, font etc. as per your unique business setting.

Partner Relationship Management Performance Metrics Dashboard Pictures PDF
This slide represents the dashboard prepared with the help of a PRM software. It includes details related to partner opportunity pipeline, MDF budget, leads, demo units, co brand requests, certified partners, partners logins etc. Showcasing this set of slides titled Partner Relationship Management Performance Metrics Dashboard Pictures PDF. The topics addressed in these templates are Partner Opportunity Pipeline, MDF Budget, Performance Metrics Dashboard. All the content presented in this PPT design is completely editable. Download it and make adjustments in color, background, font etc. as per your unique business setting.
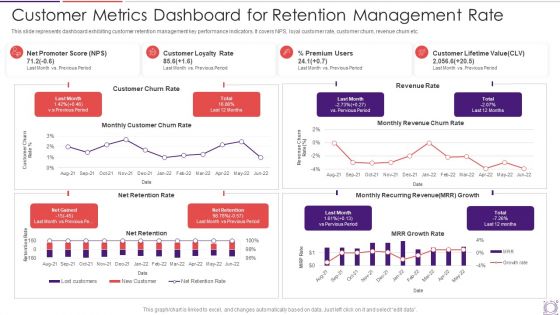
Customer Metrics Dashboard For Retention Management Rate Information PDF
This slide represents dashboard exhibiting customer retention management key performance indicators. It covers NPS, loyal customer rate, customer churn, revenue churn etc. Showcasing this set of slides titled customer metrics dashboard for retention management rate information pdf. The topics addressed in these templates are customer, premium users. All the content presented in this PPT design is completely editable. Download it and make adjustments in color, background, font etc. as per your unique business setting.

Call Center Process Key Performance Indicator Dashboard Mockup PDF
This slide showcases call center process measurements and key performance indicators so managers and teams can keep track of and improve performance . It includes received calls, calculating speed of answering calls , ended calls before starting conversations , average calls per minute etc. Showcasing this set of slides titled Call Center Process Key Performance Indicator Dashboard Mockup PDF. The topics addressed in these templates are Received Calls, Conversation, Abandon Rate. All the content presented in this PPT design is completely editable. Download it and make adjustments in color, background, font etc. as per your unique business setting.

Revenue From Sales Forecasting Dashboard For Startup Businesses Graphics Pdf
This slide presents revenue forecasting dashboard from startup business sales, helpful in highlighting traffic in various pipelines and final revenue generated from closed deals. It includes metrics such as revenue goal attained by representatives, revenue for current month, etc. Showcasing this set of slides titled Revenue From Sales Forecasting Dashboard For Startup Businesses Graphics Pdf. The topics addressed in these templates are Owner, Current Month, Businesses. All the content presented in this PPT design is completely editable. Download it and make adjustments in color, background, font etc. as per your unique business setting.
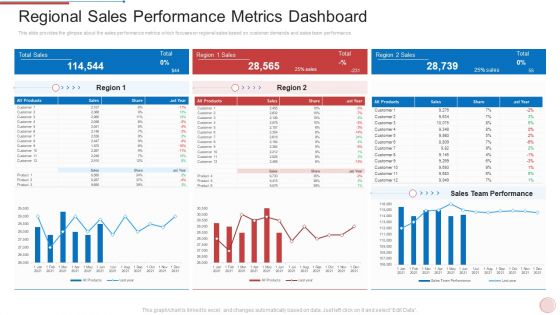
Regional Marketing Strategies Regional Sales Performance Metrics Dashboard Infographics PDF
This slide provides the glimpse about the sales performance metrics which focuses on regional sales based on customer demands and sales team performance. Deliver and pitch your topic in the best possible manner with this regional marketing strategies regional sales performance metrics dashboard infographics pdf. Use them to share invaluable insights on regional sales performance metrics dashboard and impress your audience. This template can be altered and modified as per your expectations. So, grab it now.

Project Metrics Dashboard With Team Requests Background PDF
This slide focuses on the project management dashboard which shows the creation of monthly number of requests, requests made by departmental teams, average completion time in days with the number of requests created on week days, etc. Pitch your topic with ease and precision using this Project Metrics Dashboard With Team Requests Background PDF. This layout presents information on Project Metrics Dashboard, Team Requests. It is also available for immediate download and adjustment. So, changes can be made in the color, design, graphics or any other component to create a unique layout.
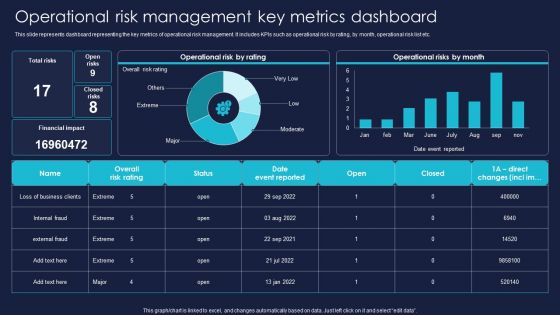
Operational Risk Management Key Metrics Dashboard Professional PDF
This slide represents dashboard representing the key metrics of operational risk management. It includes KPIs such as operational risk by rating, by month, operational risk list etc. Get a simple yet stunning designed Operational Risk Management Key Metrics Dashboard Professional PDF. It is the best one to establish the tone in your meetings. It is an excellent way to make your presentations highly effective. So, download this PPT today from Slidegeeks and see the positive impacts. Our easy to edit Operational Risk Management Key Metrics Dashboard Professional PDF can be your go-to option for all upcoming conferences and meetings. So, what are you waiting for Grab this template today.
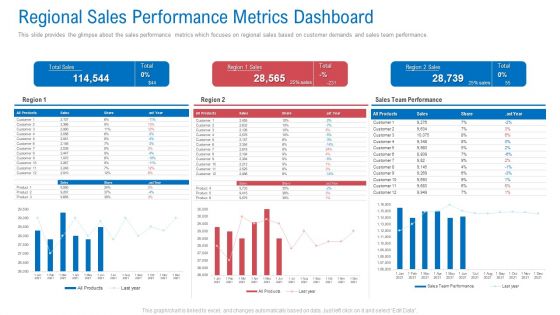
Regional Marketing Planning Regional Sales Performance Metrics Dashboard Information PDF
This slide provides the glimpse about the sales performance metrics which focuses on regional sales based on customer demands and sales team performance. Deliver an awe inspiring pitch with this creative regional marketing planning regional sales performance metrics dashboard information pdf bundle. Topics like regional sales performance metrics dashboard can be discussed with this completely editable template. It is available for immediate download depending on the needs and requirements of the user.

Market Area Analysis Regional Sales Performance Metrics Dashboard Designs PDF
This slide provides the glimpse about the sales performance metrics which focuses on regional sales based on customer demands and sales team performance. Deliver and pitch your topic in the best possible manner with this market area analysis regional sales performance metrics dashboard designs pdf. Use them to share invaluable insights on regional sales performance metrics dashboard and impress your audience. This template can be altered and modified as per your expectations. So, grab it now.
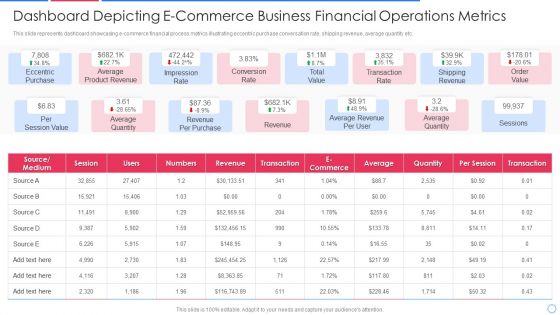
Dashboard Depicting E-Commerce Business Financial Operations Metrics Topics PDF
This slide represents dashboard showcasing e-commerce financial process metrics illustrating eccentric purchase conversation rate, shipping revenue, average quantity etc.Showcasing this set of slides titled dashboard depicting e-commerce business financial operations metrics topics pdf The topics addressed in these templates are eccentric purchase, average product revenue, impression rate All the content presented in this PPT design is completely editable. Download it and make adjustments in color, background, font etc. as per your unique business setting.
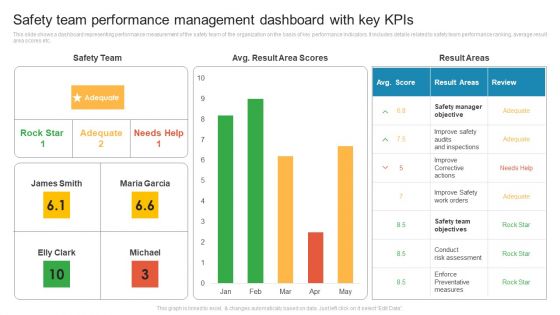
Safety Team Performance Management Dashboard With Key Kpis Rules PDF
This slide shows a dashboard representing performance measurement of the safety team of the organization on the basis of key performance indicators. It includes details related to safety team performance ranking, average result area scores etc. Pitch your topic with ease and precision using this Safety Team Performance Management Dashboard With Key Kpis Rules PDF. This layout presents information on Improve Corrective Actions, Safety Manager Objective, Conduct Risk Assessment. It is also available for immediate download and adjustment. So, changes can be made in the color, design, graphics or any other component to create a unique layout.
Market Penetration Dashboard With Sales Metrics Ppt Icon Examples PDF
This slide shows market penetration dashboard for sales team. It provides information about regions, emerging markets, planned sales, actual sales, revenue, gender wise sales, etc. Pitch your topic with ease and precision using this Market Penetration Dashboard With Sales Metrics Ppt Icon Examples PDF. This layout presents information on Emerging Markets, Sales Gender, Actual Sales. It is also available for immediate download and adjustment. So, changes can be made in the color, design, graphics or any other component to create a unique layout.
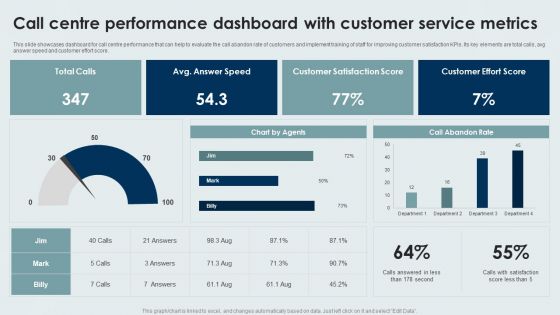
Call Centre Performance Dashboard With Customer Service Metrics Background PDF
This slide showcases dashboard for call centre performance that can help to evaluate the call abandon rate of customers and implement training of staff for improving customer satisfaction KPIs. Its key elements are total calls, avg answer speed and customer effort score. Showcasing this set of slides titled Call Centre Performance Dashboard With Customer Service Metrics Background PDF. The topics addressed in these templates are Call Centre Performance Dashboard, Customer Service Metrics. All the content presented in this PPT design is completely editable. Download it and make adjustments in color, background, font etc. as per your unique business setting.
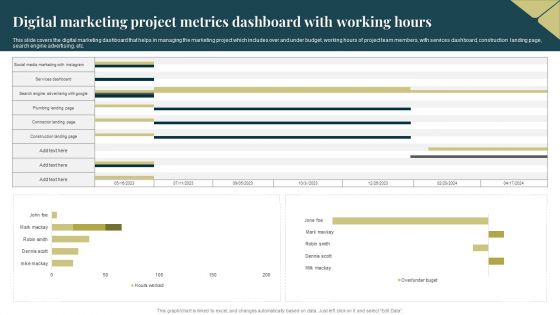
Digital Marketing Project Metrics Dashboard With Working Hours Download PDF
This slide covers the digital marketing dashboard that helps in managing the marketing project which includes over and under budget, working hours of project team members, with services dashboard, construction landing page, search engine advertising, etc. Showcasing this set of slides titled Digital Marketing Project Metrics Dashboard With Working Hours Download PDF. The topics addressed in these templates are Advertising, Social Media Marketing. All the content presented in this PPT design is completely editable. Download it and make adjustments in color, background, font etc. as per your unique business setting.
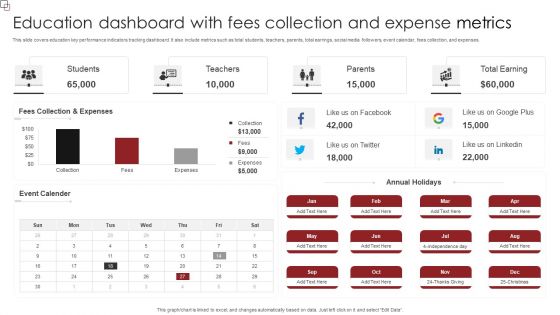
Education Dashboard With Fees Collection And Expense Metrics Demonstration PDF
This slide covers education key performance indicators tracking dashboard. It also include metrics such as total students, teachers, parents, total earrings, social media followers, event calendar, fees collection, and expenses. Showcasing this set of slides titled Education Dashboard With Fees Collection And Expense Metrics Demonstration PDF. The topics addressed in these templates are Event Calender, Annual Holidays, Fees Collection, Expenses. All the content presented in this PPT design is completely editable. Download it and make adjustments in color, background, font etc. as per your unique business setting.

Metrics To Measure Business Performance Profit Margin Dashboard Designs PDF
Following slide illustrates profit margin dashboard with a 12 months format. It also includes gross profit margin, operating profit margin and net profit margin. Deliver and pitch your topic in the best possible manner with this Metrics To Measure Business Performance Profit Margin Dashboard Designs PDF. Use them to share invaluable insights on Gross Profit Margin, Operating Profit Margin, Net Profit Margin and impress your audience. This template can be altered and modified as per your expectations. So, grab it now.

Debt Recovery Dashboard With Cash Flow Metrics Summary PDF
This slide showcase debt collection dashboard with cash flow metrics which contains 12 month collection totals by client, non payers, client with most debtors, paid vs. owed debtor and income by agent. It can assist businesses in reviewing the money collected and lent to various clients.Pitch your topic with ease and precision using this Debt Recovery Dashboard With Cash Flow Metrics Summary PDF This layout presents information on Debt Recovery, Dashboard Cash, Flow Metrics It is also available for immediate download and adjustment. So, changes can be made in the color, design, graphics or any other component to create a unique layout.
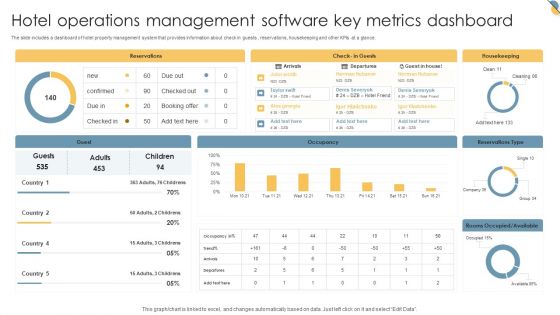
Hotel Operations Management Software Key Metrics Dashboard Inspiration PDF
The slide includes a dashboard of hotel property management system that provides information about check in guests , reservations, housekeeping and other KPIs at a glance. Pitch your topic with ease and precision using this Hotel Operations Management Software Key Metrics Dashboard Inspiration PDF. This layout presents information on Reservations, Housekeeping, Occupancy. It is also available for immediate download and adjustment. So, changes can be made in the color, design, graphics or any other component to create a unique layout.
Project Metrics Dashboard Depicting Tracking System Inspiration PDF
This slide focuses on project management dashboard which covers the four spirit teams, iteration defects by priority with quarterly roadmap with legends such as high attention, low, none, normal and resolved immediately with time in iteration, etc. Pitch your topic with ease and precision using this Project Metrics Dashboard Depicting Tracking System Inspiration PDF. This layout presents information on Project Metrics, Dashboard Depicting, Tracking System. It is also available for immediate download and adjustment. So, changes can be made in the color, design, graphics or any other component to create a unique layout.
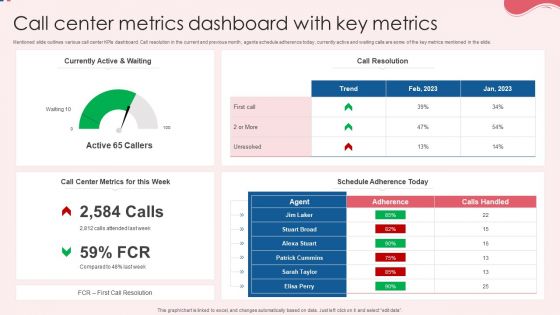
Call Center Metrics Dashboard With Key Metrics Information PDF
Mentioned slide outlines various call center KPIs dashboard. Call resolution in the current and previous month, agents schedule adherence today, currently active and waiting calls are some of the key metrics mentioned in the slide. Showcasing this set of slides titled Call Center Metrics Dashboard With Key Metrics Information PDF. The topics addressed in these templates are Currently Active, Call Resolution, Key Metrics. All the content presented in this PPT design is completely editable. Download it and make adjustments in color, background, font etc. as per your unique business setting.

Vehicle Management System Profit And Loss Dashboard Brochure PDF
This slide represents the dashboard showing the key performance indicators related to the profit and loss incurred in fleet management. Showcasing this set of slides titled Vehicle Management System Profit And Loss Dashboard Brochure PDF. The topics addressed in these templates are Vehicle Management System, Profit And Loss Dashboard. All the content presented in this PPT design is completely editable. Download it and make adjustments in color, background, font etc. as per your unique business setting.
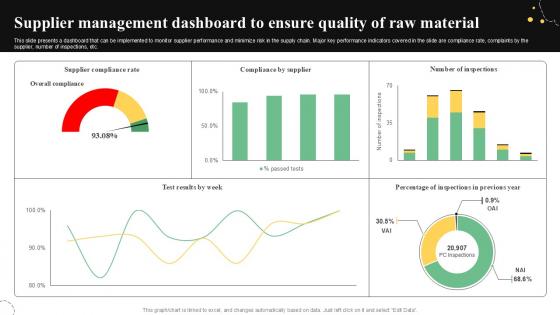
Supplier Management Dashboard Quality Control Guide For Food PPT Sample
This slide presents a dashboard that can be implemented to monitor supplier performance and minimize risk in the supply chain. Major key performance indicators covered in the slide are compliance rate, complaints by the supplier, number of inspections, etc. Present like a pro with Supplier Management Dashboard Quality Control Guide For Food PPT Sample. Create beautiful presentations together with your team, using our easy-to-use presentation slides. Share your ideas in real-time and make changes on the fly by downloading our templates. So whether you are in the office, on the go, or in a remote location, you can stay in sync with your team and present your ideas with confidence. With Slidegeeks presentation got a whole lot easier. Grab these presentations today.
Metric Dashboard For Tracking Product Development And Management Clipart PDF
This slide represents dashboard for product management and development. It includes product ideas raised, project funding, challenges against ideas etc. If your project calls for a presentation, then Slidegeeks is your go-to partner because we have professionally designed, easy-to-edit templates that are perfect for any presentation. After downloading, you can easily edit Metric Dashboard For Tracking Product Development And Management Clipart PDF and make the changes accordingly. You can rearrange slides or fill them with different images. Check out all the handy templates
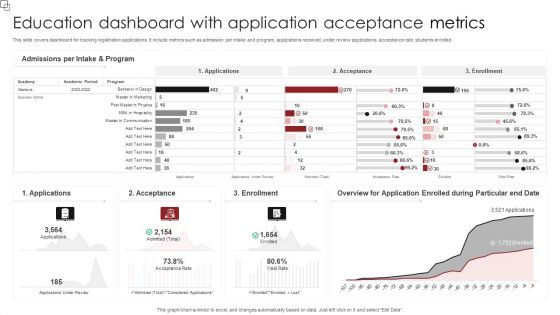
Education Dashboard With Application Acceptance Metrics Clipart PDF
This slide covers dashboard for tracking registration applications. It include metrics such as admission per intake and program, applications received, under review applications, acceptance rate, students enrolled. Showcasing this set of slides titled Education Dashboard With Application Acceptance Metrics Clipart PDF. The topics addressed in these templates are Admissions Per, Intake And Program, Enrollment. All the content presented in this PPT design is completely editable. Download it and make adjustments in color, background, font etc. as per your unique business setting.
Education Dashboard For Tracking Gender Based Retention Metrics Template PDF
This slide illustrates student retention analysis dashboard. It include metrics based on gender, campus, ethnicity, and age group. Pitch your topic with ease and precision using this Education Dashboard For Tracking Gender Based Retention Metrics Template PDF. This layout presents information on Gender Based, Retention Rates, Age Group, Campus Wise. It is also available for immediate download and adjustment. So, changes can be made in the color, design, graphics or any other component to create a unique layout.

 Home
Home