Employee Dashboard
SMS Marketing Automated Campaigns Performance Tracking Dashboard Formats PDF
This slide represents the key metrics dashboard to track, monitor and analyze the performance of SMS marketing automated campaign. It includes details related to KPIs such as new subscribers, responses received, total earned and top live automations etc. Are you searching for a SMS Marketing Automated Campaigns Performance Tracking Dashboard Formats PDF that is uncluttered, straightforward, and original. Its easy to edit, and you can change the colors to suit your personal or business branding. For a presentation that expresses how much effort youve put in, this template is ideal. With all of its features, including tables, diagrams, statistics, and lists, its perfect for a business plan presentation. Make your ideas more appealing with these professional slides. Download SMS Marketing Automated Campaigns Performance Tracking Dashboard Formats PDF from Slidegeeks today.
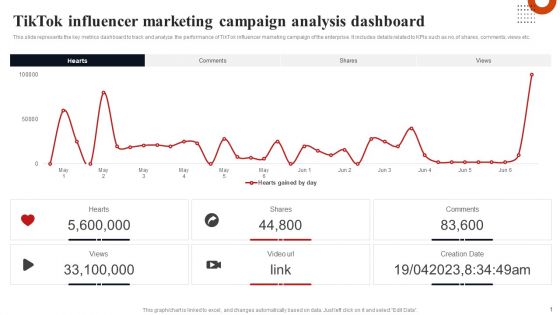
Tiktok Influencer Marketing Campaign Analysis Dashboard Formats PDF
This slide represents the key metrics dashboard to track and analyze the performance of TikTok influencer marketing campaign of the enterprise. It includes details related to KPIs such as no.of shares, comments, views etc. Formulating a presentation can take up a lot of effort and time, so the content and message should always be the primary focus. The visuals of the PowerPoint can enhance the presenters message, so our Tiktok Influencer Marketing Campaign Analysis Dashboard Formats PDF was created to help save time. Instead of worrying about the design, the presenter can concentrate on the message while our designers work on creating the ideal templates for whatever situation is needed. Slidegeeks has experts for everything from amazing designs to valuable content, we have put everything into Tiktok Influencer Marketing Campaign Analysis Dashboard Formats PDF.
SMS Marketing Automated Campaigns Performance Tracking Dashboard Professional PDF
This slide represents the key metrics dashboard to track, monitor and analyze the performance of SMS marketing automated campaign. It includes details related to KPIs such as new subscribers, responses received, total earned and top live automations etc. Get a simple yet stunning designed SMS Marketing Automated Campaigns Performance Tracking Dashboard Professional PDF. It is the best one to establish the tone in your meetings. It is an excellent way to make your presentations highly effective. So, download this PPT today from Slidegeeks and see the positive impacts. Our easy to edit SMS Marketing Automated Campaigns Performance Tracking Dashboard Professional PDF can be your go to option for all upcoming conferences and meetings. So, what are you waiting for Grab this template today.
Instagram Influencer Marketing Campaign Dashboard Ppt Icon Slide PDF
This slide represents key metrics dashboard to track and measure progress of Instagram influencer marketing campaign. It includes details related to KPIs such as impressions, likes, engagement rates etc. Explore a selection of the finest Instagram Influencer Marketing Campaign Dashboard Ppt Icon Slide PDF here. With a plethora of professionally designed and pre made slide templates, you can quickly and easily find the right one for your upcoming presentation. You can use our Instagram Influencer Marketing Campaign Dashboard Ppt Icon Slide PDF to effectively convey your message to a wider audience. Slidegeeks has done a lot of research before preparing these presentation templates. The content can be personalized and the slides are highly editable. Grab templates today from Slidegeeks.

Instagram Influencer Marketing Campaign Dashboard Ppt Infographic Template Topics PDF
This slide represents key metrics dashboard to track and measure progress of Instagram influencer marketing campaign. It includes details related to KPIs such as impressions, likes, engagement rates etc. Explore a selection of the finest Instagram Influencer Marketing Campaign Dashboard Ppt Infographic Template Topics PDF here. With a plethora of professionally designed and pre made slide templates, you can quickly and easily find the right one for your upcoming presentation. You can use our Instagram Influencer Marketing Campaign Dashboard Ppt Infographic Template Topics PDF to effectively convey your message to a wider audience. Slidegeeks has done a lot of research before preparing these presentation templates. The content can be personalized and the slides are highly editable. Grab templates today from Slidegeeks.
Agile Project Management Activities Tracking Dashboard Information PDF
This slide provides information regarding the dashboard which will help team in managing different activities associated to agile projects and keep track on the time, task summary, etc. Find a pre designed and impeccable Agile Project Management Activities Tracking Dashboard Information PDF. The templates can ace your presentation without additional effort. You can download these easy to edit presentation templates to make your presentation stand out from others. So, what are you waiting for Download the template from Slidegeeks today and give a unique touch to your presentation.
Integrated Digital Marketing Strategy Dashboard For Lead Conversion Icons PDF
Following slide illustrates integrated marketing campaign dashboard utilized by organizations to improve business agility and increase operational efficiency. This slide provides data regarding lead conversion by campaign and channel, amount spent per campaign, monthly lead generations, etc. Showcasing this set of slides titled Integrated Digital Marketing Strategy Dashboard For Lead Conversion Icons PDF. The topics addressed in these templates are Total Page Views, Average Session Duration, Conversion. All the content presented in this PPT design is completely editable. Download it and make adjustments in color, background, font etc. as per your unique business setting.
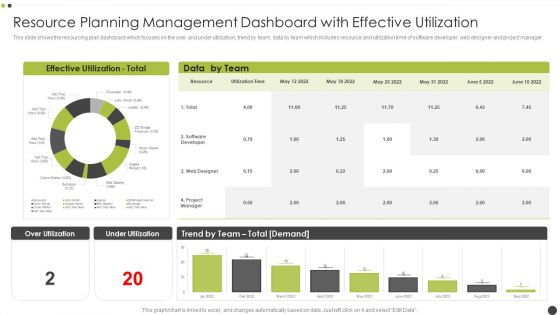
Resource Planning Management Dashboard With Effective Utilization Mockup PDF
This slide shows the resourcing plan dashboard which focuses on the over and under utilization, trend by team, data by team which includes resource and utilization time of software developer, web designer and project manager. Pitch your topic with ease and precision using this Resource Planning Management Dashboard With Effective Utilization Mockup PDF. This layout presents information on Web Designer, Software Developer, Team. It is also available for immediate download and adjustment. So, changes can be made in the color, design, graphics or any other component to create a unique layout.

Manufacturing Kpis Dashboard Showing Process Cycle Time Microsoft PDF
This slide represents the dashboard showing the production manufacturing metrics. It includes key performance indicators such as process cycle time by date, table build, process completion by date, first pass yield, defective components and causes etc. Pitch your topic with ease and precision using this Manufacturing Kpis Dashboard Showing Process Cycle Time Microsoft PDF. This layout presents information on Defective Components Defect Causes, Process Cycle, Time By Date, Process Completions By Date. It is also available for immediate download and adjustment. So, changes can be made in the color, design, graphics or any other component to create a unique layout.

Software Development Life Cycle Planning Software Development Dashboard Microsoft PDF
This slide covers software evaluation dashboard including spring details, team details to evaluate the project while proceeding to closure. The best PPT templates are a great way to save time, energy, and resources. Slidegeeks have 100 percent editable powerpoint slides making them incredibly versatile. With these quality presentation templates, you can create a captivating and memorable presentation by combining visually appealing slides and effectively communicating your message. Download Software Development Life Cycle Planning Software Development Dashboard Microsoft PDF from Slidegeeks and deliver a wonderful presentation.
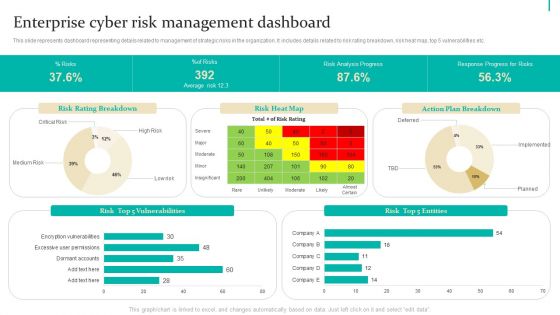
Enterprise Risk Management Enterprise Cyber Risk Management Dashboard Infographics PDF
This slide represents dashboard representing details related to management of strategic risks in the organization. It includes details related to risk rating breakdown, risk heat map, top 5 vulnerabilities etc. Do you have an important presentation coming up Are you looking for something that will make your presentation stand out from the rest Look no further than Enterprise Risk Management Enterprise Cyber Risk Management Dashboard Infographics PDF. With our professional designs, you can trust that your presentation will pop and make delivering it a smooth process. And with Slidegeeks, you can trust that your presentation will be unique and memorable. So why wait Grab Enterprise Risk Management Enterprise Cyber Risk Management Dashboard Infographics PDF today and make your presentation stand out from the rest.
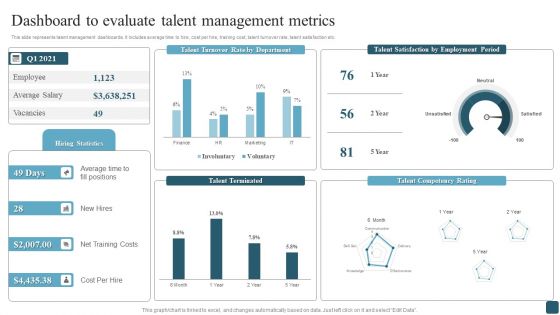
Dashboard To Evaluate Talent Management Metrics Professional PDF
This slide represents talent management dashboards. It includes average time to hire, cost per hire, training cost, talent turnover rate, talent satisfaction etc. Whether you have daily or monthly meetings, a brilliant presentation is necessary. Dashboard To Evaluate Talent Management Metrics Professional PDF can be your best option for delivering a presentation. Represent everything in detail using Dashboard To Evaluate Talent Management Metrics Professional PDF and make yourself stand out in meetings. The template is versatile and follows a structure that will cater to your requirements. All the templates prepared by Slidegeeks are easy to download and edit. Our research experts have taken care of the corporate themes as well. So, give it a try and see the results.
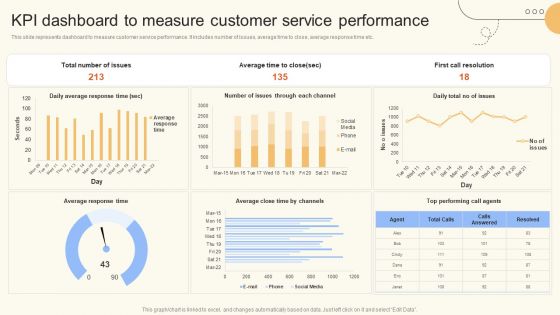
KPI Dashboard To Measure Customer Service Performance Pictures PDF
This slide represents dashboard to measure customer service performance. It includes number of issues, average time to close, average response time etc. Whether you have daily or monthly meetings, a brilliant presentation is necessary. KPI Dashboard To Measure Customer Service Performance Pictures PDF can be your best option for delivering a presentation. Represent everything in detail using KPI Dashboard To Measure Customer Service Performance Pictures PDF and make yourself stand out in meetings. The template is versatile and follows a structure that will cater to your requirements. All the templates prepared by Slidegeeks are easy to download and edit. Our research experts have taken care of the corporate themes as well. So, give it a try and see the results.
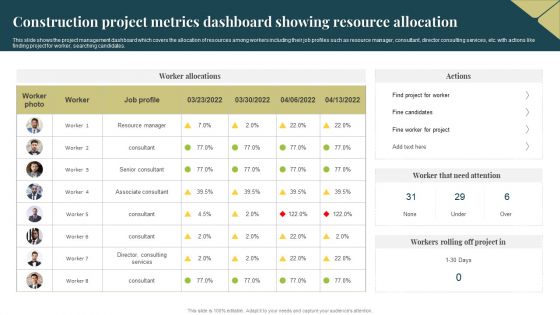
Construction Project Metrics Dashboard Showing Resource Allocation Professional PDF
This slide shows the project management dashboard which covers the allocation of resources among workers including their job profiles such as resource manager, consultant, director consulting services, etc. with actions like finding project for worker, searching candidates. Showcasing this set of slides titled Construction Project Metrics Dashboard Showing Resource Allocation Professional PDF. The topics addressed in these templates are Resource Manager, Services, Project. All the content presented in this PPT design is completely editable. Download it and make adjustments in color, background, font etc. as per your unique business setting.

System Deployment Project Sales Software Performance Measurement Dashboard Summary PDF
This slide represents the dashboard to track and measure the performance of sales dashboard. It includes details related to KPIs such as sales activity, product details, purchase order etc. Welcome to our selection of the System Deployment Project Sales Software Performance Measurement Dashboard Summary PDF. These are designed to help you showcase your creativity and bring your sphere to life. Planning and Innovation are essential for any business that is just starting out. This collection contains the designs that you need for your everyday presentations. All of our PowerPoints are 100 percent editable, so you can customize them to suit your needs. This multi-purpose template can be used in various situations. Grab these presentation templates today.
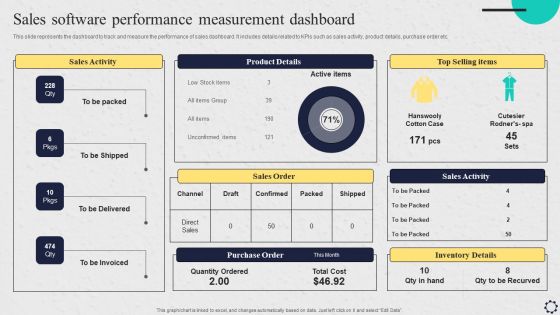
Software Implementation Strategy Sales Software Performance Measurement Dashboard Template PDF
This slide represents the dashboard to track and measure the performance of sales dashboard. It includes details related to KPIs such as sales activity, product details, purchase order etc. Coming up with a presentation necessitates that the majority of the effort goes into the content and the message you intend to convey. The visuals of a PowerPoint presentation can only be effective if it supplements and supports the story that is being told. Keeping this in mind our experts created Software Implementation Strategy Sales Software Performance Measurement Dashboard Template PDF to reduce the time that goes into designing the presentation. This way, you can concentrate on the message while our designers take care of providing you with the right template for the situation.
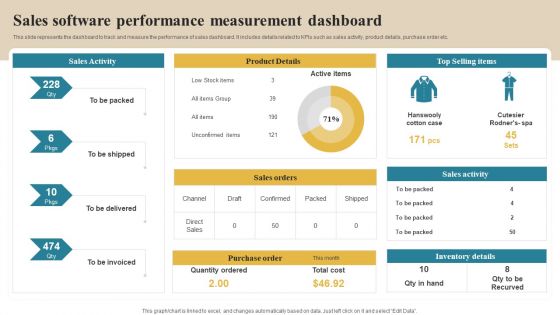
Software Implementation Technique Sales Software Performance Measurement Dashboard Slides PDF
This slide represents the dashboard to track and measure the performance of sales dashboard. It includes details related to KPIs such as sales activity, product details, purchase order etc. This modern and well arranged Software Implementation Technique Sales Software Performance Measurement Dashboard Slides PDF provides lots of creative possibilities. It is very simple to customize and edit with the Powerpoint Software. Just drag and drop your pictures into the shapes. All facets of this template can be edited with Powerpoint no extra software is necessary. Add your own material, put your images in the places assigned for them, adjust the colors, and then you can show your slides to the world, with an animated slide included.

Warehouse Efficiency Dashboard For Inventory Management Infographics PDF
This slide represents the dashboard representing warehouse performance for the management of inventory by production department. It includes data related to out of stock material, return rate and back order rate. Showcasing this set of slides titled Warehouse Efficiency Dashboard For Inventory Management Infographics PDF. The topics addressed in these templates are Inventory Carrying Rate, Inventory Turnover Rate, Inventory Carrying Cost. All the content presented in this PPT design is completely editable. Download it and make adjustments in color, background, font etc. as per your unique business setting.
Optimize Brand Valuation Corporate Branding Performance Tracking Dashboard Structure PDF
This slide provides information regarding corporate branding performance tracking dashboard in terms of leads, conversion metrics, web traffic, etc. Whether you have daily or monthly meetings, a brilliant presentation is necessary. Optimize Brand Valuation Corporate Branding Performance Tracking Dashboard Structure PDF can be your best option for delivering a presentation. Represent everything in detail using Optimize Brand Valuation Corporate Branding Performance Tracking Dashboard Structure PDF and make yourself stand out in meetings. The template is versatile and follows a structure that will cater to your requirements. All the templates prepared by Slidegeeks are easy to download and edit. Our research experts have taken care of the corporate themes as well. So, give it a try and see the results.
Website Performance Tracking And Monitoring Dashboard Ppt Slides Files PDF
The following slide showcases a dashboard to track and measure website performance. It includes key elements such as visits, average session duration, bounce rate, page views, goal conversion, visits by week, traffic sources, top channels by conversions, etc. Whether you have daily or monthly meetings, a brilliant presentation is necessary. Website Performance Tracking And Monitoring Dashboard Ppt Slides Files PDF can be your best option for delivering a presentation. Represent everything in detail using Website Performance Tracking And Monitoring Dashboard Ppt Slides Files PDF and make yourself stand out in meetings. The template is versatile and follows a structure that will cater to your requirements. All the templates prepared by Slidegeeks are easy to download and edit. Our research experts have taken care of the corporate themes as well. So, give it a try and see the results.
Web Access Control Solution Secure Web Gateway Performance Tracking Dashboard
This slide represents a dashboard to maintain the record of various functions of Secure Web Gateway. The main components are top blocked web malware, web usage trend, top web application categories, risky web isolations, etc. Get a simple yet stunning designed Web Access Control Solution Secure Web Gateway Performance Tracking Dashboard. It is the best one to establish the tone in your meetings. It is an excellent way to make your presentations highly effective. So, download this PPT today from Slidegeeks and see the positive impacts. Our easy-to-edit Web Access Control Solution Secure Web Gateway Performance Tracking Dashboard can be your go-to option for all upcoming conferences and meetings. So, what are you waiting for Grab this template today.
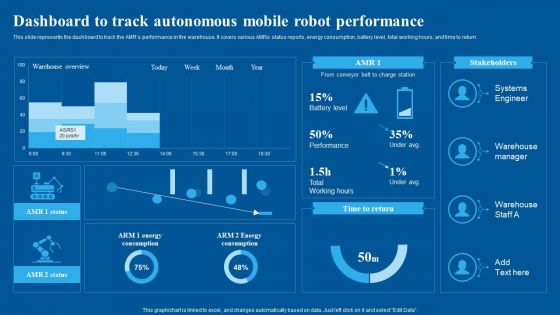
Dashboard To Track Autonomous Mobile Robot Performance Infographics PDF
This slide represents the dashboard to track the AMRs performance in the warehouse. It covers various AMRs status reports, energy consumption, battery level, total working hours, and time to return. Take your projects to the next level with our ultimate collection of Dashboard To Track Autonomous Mobile Robot Performance Infographics PDF. Slidegeeks has designed a range of layouts that are perfect for representing task or activity duration, keeping track of all your deadlines at a glance. Tailor these designs to your exact needs and give them a truly corporate look with your own brand colors they will make your projects stand out from the rest.

Fundamental Trend Analysis Of Stock Market Dashboard Professional PDF
This slide shows the dashboard representing the stock markets fundamental analysis. It includes information related to debt-to-capital, quick ratio, interest coverage, total debt-to-FCF, cash and equivalents, earnings, margins, cash flow, growth, profitability and market analysis.Showcasing this set of slides titled Fundamental Trend Analysis Of Stock Market Dashboard Professional PDF. The topics addressed in these templates are Earnings Analysis, Cash Flow Analysis, Margins Analysis. All the content presented in this PPT design is completely editable. Download it and make adjustments in color, background, font etc. as per your unique business setting.
Financial Procedure Dashboard Indicating Yearly Revenue Analysis Icons PDF
This slide illustrates finance process dashboard indicating yearly revenue analysis which contains gross profit margin, operating profit ratio, net profit, revenue and cost of goods sold cogs operating expenses, etc. It can be referred by company owners who can compare it with previous years performance and make related decisions for future. Showcasing this set of slides titled Financial Procedure Dashboard Indicating Yearly Revenue Analysis Icons PDF. The topics addressed in these templates are Operating Profit Percentage, Net Profit Percentage, Operating Profit Ratio. All the content presented in this PPT design is completely editable. Download it and make adjustments in color, background, font etc. as per your unique business setting.

Managing Business Cash Kpi Dashboard With Trade Receivables Slides PDF
Following slide depicts a key performing indicator dashboard for tracking cash flow management with special emphasis on trade receivables and payables. Key metrics include profit before, cash from operating activities, Cash flow from financing activities etc. Showcasing this set of slides titled Managing Business Cash Kpi Dashboard With Trade Receivables Slides PDF. The topics addressed in these templates are Inventory Outstanding, Payable Outstanding, Receivables Outstanding. All the content presented in this PPT design is completely editable. Download it and make adjustments in color, background, font etc. as per your unique business setting.

Critical Violations Security Dashboard With KPI Metrics Graphics PDF
This slide shows dashboard of security to mitigate violation by prioritizing KPIs. It includes application control, operating systems, restrict admin privileges, multi factor authentication and backup of important data. Showcasing this set of slides titled Critical Violations Security Dashboard With KPI Metrics Graphics PDF. The topics addressed in these templates are Risk Model, Application Components, Technologies Overview. All the content presented in this PPT design is completely editable. Download it and make adjustments in color, background, font etc. as per your unique business setting.
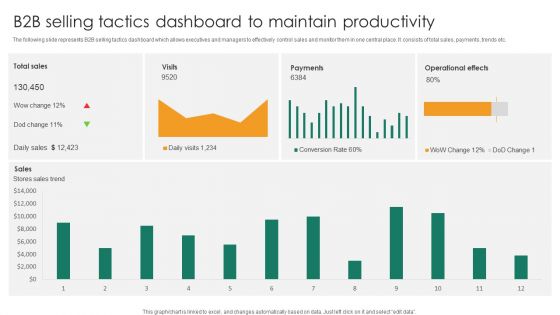
B2b Selling Tactics Dashboard To Maintain Productivity Introduction PDF
The following slide represents B2B selling tactics dashboard which allows executives and managers to effectively control sales and monitor them in one central place. It consists of total sales, payments, trends etc.Pitch your topic with ease and precision using this B2b Selling Tactics Dashboard To Maintain Productivity Introduction PDF. This layout presents information on Operational Effects, Stores Sales Trend, Conversion Rate. It is also available for immediate download and adjustment. So, changes can be made in the color, design, graphics or any other component to create a unique layout.

Manufacturing Company Production Dashboard With Active Machines Template PDF
This slide highlights the manufacturing company production dashboard which showcases production rate, lost units with causes, productivity by machine, operations available and overall productivity. Take your projects to the next level with our ultimate collection of Manufacturing Company Production Dashboard With Active Machines Template PDF. Slidegeeks has designed a range of layouts that are perfect for representing task or activity duration, keeping track of all your deadlines at a glance. Tailor these designs to your exact needs and give them a truly corporate look with your own brand colors they will make your projects stand out from the rest.
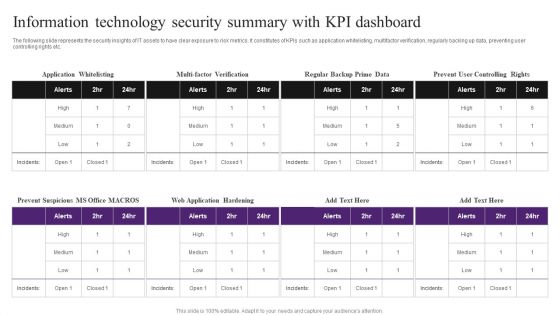
Information Technology Security Summary With KPI Dashboard Inspiration PDF
The following slide represents the security insights of IT assets to have clear exposure to risk metrics. It constitutes of KPIs such as application whitelisting, multifactor verification, regularly backing up data, preventing user controlling rights etc. Pitch your topic with ease and precision using this Information Technology Security Summary With KPI Dashboard Inspiration PDF. This layout presents information on Information Technology Security, Summary With KPI Dashboard. It is also available for immediate download and adjustment. So, changes can be made in the color, design, graphics or any other component to create a unique layout.

Viral Campaigns Kpi Dashboard With Engagement Metrics Template PDF
This slide showcases KPI dashboard which can help marketers in assessing engagement metrics. It provides details about user metrics, direct signups, seed contacts, community members, social KPIs, engagement rate, etc. Want to ace your presentation in front of a live audience Our Viral Campaigns Kpi Dashboard With Engagement Metrics Template PDF can help you do that by engaging all the users towards you. Slidegeeks experts have put their efforts and expertise into creating these impeccable powerpoint presentations so that you can communicate your ideas clearly. Moreover, all the templates are customizable, and easy to edit and downloadable. Use these for both personal and commercial use.
Different Brands Performance Tracking Dashboard Ppt Gallery Infographics PDF
This slide provides information regarding different brands performance tracking dashboard in terms of brand metric, brand commitment, advertising metrics, and purchase metrics. Take your projects to the next level with our ultimate collection of Different Brands Performance Tracking Dashboard Ppt Gallery Infographics PDF. Slidegeeks has designed a range of layouts that are perfect for representing task or activity duration, keeping track of all your deadlines at a glance. Tailor these designs to your exact needs and give them a truly corporate look with your own brand colors they will make your projects stand out from the rest.
Storage Facility Productivity Tracking KPI Dashboard Graphics PDF
This slide showcases a dashboard for tracking and managing warehouse productivity to optimize logistics operations. It includes key components such as warehouse operating costs, perfect order rate, total shipments by country and on time shipments. Showcasing this set of slides titled Storage Facility Productivity Tracking KPI Dashboard Graphics PDF. The topics addressed in these templates are Warehouse Operating Costs, Perfect Order Rate, Total Shipment Country. All the content presented in this PPT design is completely editable. Download it and make adjustments in color, background, font etc. as per your unique business setting.

Manufacturing Company Production Dashboard With Active Machines Microsoft PDF
This slide highlights the manufacturing company production dashboard which showcases production rate, lost units with causes, productivity by machine, operations available and overall productivity. The Manufacturing Company Production Dashboard With Active Machines Microsoft PDF is a compilation of the most recent design trends as a series of slides. It is suitable for any subject or industry presentation, containing attractive visuals and photo spots for businesses to clearly express their messages. This template contains a variety of slides for the user to input data, such as structures to contrast two elements, bullet points, and slides for written information. Slidegeeks is prepared to create an impression.
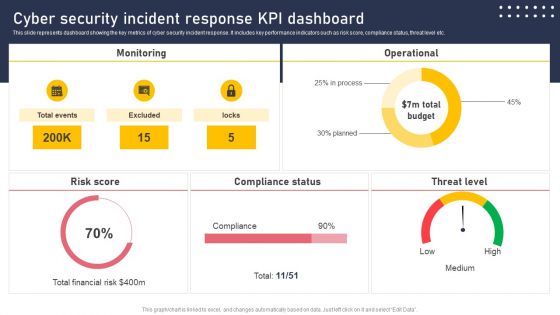
Cyber Security Incident Response KPI Dashboard Microsoft PDF
This slide represents dashboard showing the key metrics of cyber security incident response. It includes key performance indicators such as risk score, compliance status, threat level etc. Slidegeeks has constructed Cyber Security Incident Response KPI Dashboard Microsoft PDF after conducting extensive research and examination. These presentation templates are constantly being generated and modified based on user preferences and critiques from editors. Here, you will find the most attractive templates for a range of purposes while taking into account ratings and remarks from users regarding the content. This is an excellent jumping off point to explore our content and will give new users an insight into our top notch PowerPoint Templates.
Dashboard For Tracking Logistics Management Strategy Results Ideas PDF
This slide covers a dashboard for tracking the logistics operations KPIs. It includes metrics such as warehousing operating cost, perfect order rate, total shipments by areas, on time shipments, etc. Pitch your topic with ease and precision using this dashboard for tracking logistics management strategy results ideas pdf. This layout presents information on cost, warehouse, rate. It is also available for immediate download and adjustment. So, changes can be made in the color, design, graphics or any other component to create a unique layout.
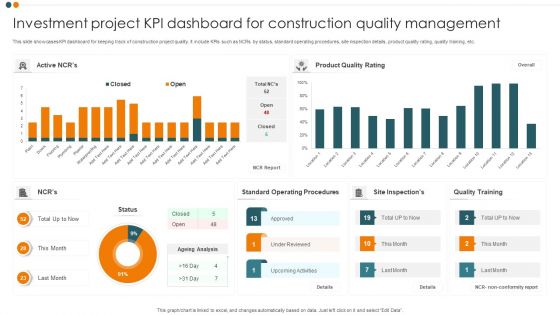
Investment Project KPI Dashboard For Construction Quality Management Pictures PDF
This slide showcases KPI dashboard for keeping track of construction project quality. It include KPIs such as NCRs by status, standard operating procedures, site inspection details, product quality rating, quality training, etc. Showcasing this set of slides titled Investment Project KPI Dashboard For Construction Quality Management Pictures PDF. The topics addressed in these templates are Product Quality Rating, Standard Operating Procedures, Quality Training. All the content presented in this PPT design is completely editable. Download it and make adjustments in color, background, font etc. as per your unique business setting.

Cost Management And Cut Dashboard With Warehouse Statistics Sample PDF
The following slide showcases dashboard for containment of warehouse cost of the company by tracking and reporting major expense KPIs. It further includes elements such as variance, operations and storage expenditure, etc. Showcasing this set of slides titled Cost Management And Cut Dashboard With Warehouse Statistics Sample PDF. The topics addressed in these templates are Monthly Operations Cost, Monthly Storage Cost, Warehouse Stats. All the content presented in this PPT design is completely editable. Download it and make adjustments in color, background, font etc. as per your unique business setting.
Human Resource Metrics Dashboard Ppt PowerPoint Presentation Layouts Icons PDF
Presenting this set of slides with name human resource metrics dashboard ppt powerpoint presentation layouts icons pdf. The topics discussed in these slide is total applicants, shortlisted candidates, hired candidates, rejected candidates, time to hire, cost to hire. This is a completely editable PowerPoint presentation and is available for immediate download. Download now and impress your audience.
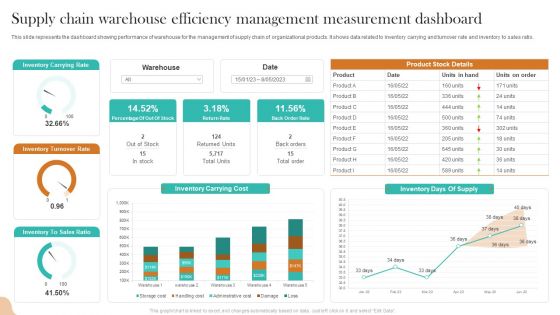
Supply Chain Warehouse Efficiency Management Measurement Dashboard Inspiration PDF
This slide represents the dashboard showing performance of warehouse for the management of supply chain of organizational products. It shows data related to inventory carrying and turnover rate and inventory to sales ratio. Pitch your topic with ease and precision using this Supply Chain Warehouse Efficiency Management Measurement Dashboard Inspiration PDF. This layout presents information on Inventory Carrying Rate, Inventory Turnover Rate, Inventory Carrying Cost. It is also available for immediate download and adjustment. So, changes can be made in the color, design, graphics or any other component to create a unique layout.

Logistics Service Delivery And Management Dashboard Introduction PDF
This slide shows the monitoring and reporting of important logistics KPIs concerning warehouse operations, transportation processes, and overall supply chain management. The key measuring metrics include fleet efficiency, delivery status, deliveries by destination, loading time and loading weight. Showcasing this set of slides titled Logistics Service Delivery And Management Dashboard Introduction PDF. The topics addressed in these templates are Logistics Service Delivery, Management Dashboard. All the content presented in this PPT design is completely editable. Download it and make adjustments in color, background, font etc. as per your unique business setting.

Sales Work Action Plan Analysis Dashboard Brochure PDF
This slide covers the dashboard for analyzing the sales plan implemented in an organization. The purpose of this template is to assess strategical and operational aspects of the company. It includes key performance indicators such as number of sales, revenue, profit, cost, etc. Showcasing this set of slides titled Sales Work Action Plan Analysis Dashboard Brochure PDF. The topics addressed in these templates are Sales Revenue, Cost Breakdown, Accumulated Revenue. All the content presented in this PPT design is completely editable. Download it and make adjustments in color, background, font etc. as per your unique business setting.
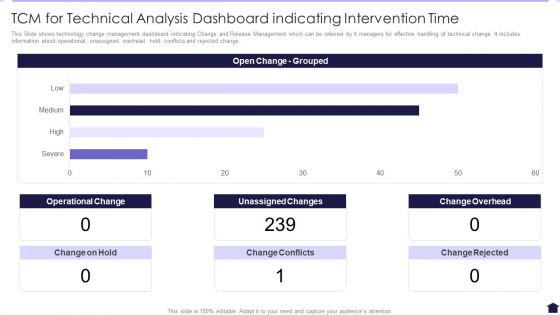
TCM For Technical Analysis Dashboard Indicating Intervention Time Background PDF
This Slide shows technology change management dashboard indicating Change and Release Management which can be referred by It managers for effective handling of technical change. It includes information about operational, unassigned, overhead, hold, conflicts and rejected change. Showcasing this set of slides titled TCM For Technical Analysis Dashboard Indicating Intervention Time Background PDF. The topics addressed in these templates are Operational Change, Unassigned Changes, Change Overhead. All the content presented in this PPT design is completely editable. Download it and make adjustments in color, background, font etc. as per your unique business setting.
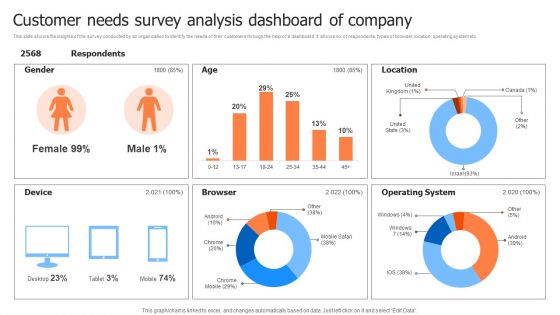
Customer Needs Survey Analysis Dashboard Of Company Inspiration PDF
This slide shows the insights of the survey conducted by an organization to identify the needs of their customers through the help of a dashboard. It shows no. of respondents, types of browser, location, operating system etc. Showcasing this set of slides titled Customer Needs Survey Analysis Dashboard Of Company Inspiration PDF. The topics addressed in these templates are Operating System, Location, Device. All the content presented in this PPT design is completely editable. Download it and make adjustments in color, background, font etc. as per your unique business setting.
Logistics Management Time Tracking Dashboard With Warehousing Costs Template PDF
This slide showcases shipping dashboard that can help company to deliver the products in stipulated time and keep warehousing operating expenses within pre decided budget. Its also displays perfect order rate and total shipments by country. Pitch your topic with ease and precision using this Logistics Management Time Tracking Dashboard With Warehousing Costs Template PDF. This layout presents information on Warehouse Operating Costs, Perfect Order Rate, On Time Shipments. It is also available for immediate download and adjustment. So, changes can be made in the color, design, graphics or any other component to create a unique layout.
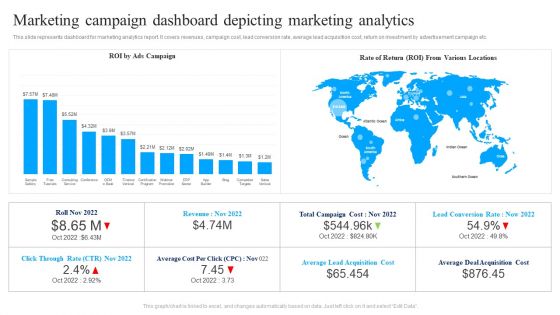
Marketing Campaign Dashboard Depicting Marketing Analytics Ppt Summary Infographics PDF
This slide represents dashboard for marketing analytics report. It covers revenues, campaign cost, lead conversion rate, average lead acquisition cost, return on investment by advertisement campaign etc. Pitch your topic with ease and precision using this Marketing Campaign Dashboard Depicting Marketing Analytics Ppt Summary Infographics PDF. This layout presents information on ROI Ads Campaign, Rate Of Return, Various Locations. It is also available for immediate download and adjustment. So, changes can be made in the color, design, graphics or any other component to create a unique layout.
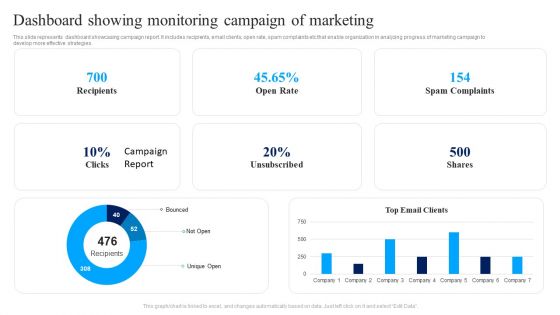
Dashboard Showing Monitoring Campaign Of Marketing Ppt Infographics PDF
This slide represents dashboard showcasing campaign report. It includes recipients, email clients, open rate, spam complaints etc that enable organization in analyzing progress of marketing campaign to develop more effective strategies. Showcasing this set of slides titled Dashboard Showing Monitoring Campaign Of Marketing Ppt Infographics PDF. The topics addressed in these templates are Recipients, Open Rate, Spam Complaints, Shares. All the content presented in this PPT design is completely editable. Download it and make adjustments in color, background, font etc. as per your unique business setting.

Dashboard Depicting Digital Advertising Marketing Campaign Ppt Summary Elements PDF
This slide represents dashboard for advertising campaign report .It includes social media costs , clicks , cost per action , conversions to help businesses in increasing sales of products and services. Showcasing this set of slides titled Dashboard Depicting Digital Advertising Marketing Campaign Ppt Summary Elements PDF. The topics addressed in these templates are Social Media Cost, Social Media Clicks, Adwords Clicks, Adwords Cost . All the content presented in this PPT design is completely editable. Download it and make adjustments in color, background, font etc. as per your unique business setting.
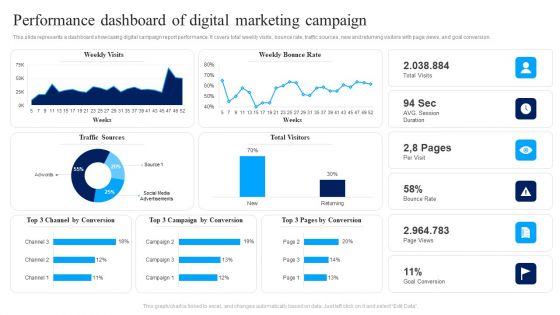
Performance Dashboard Of Digital Marketing Campaign Ppt Show Slide PDF
This slide represents a dashboard showcasing digital campaign report performance. It covers total weekly visits, bounce rate, traffic sources, new and returning visitors with page views, and goal conversion. Pitch your topic with ease and precision using this Performance Dashboard Of Digital Marketing Campaign Ppt Show Slide PDF. This layout presents information on Weekly Visits, Weekly Bounce Rate, Bounce Rate. It is also available for immediate download and adjustment. So, changes can be made in the color, design, graphics or any other component to create a unique layout.

Business Intelligence Dashboard Showcasing Fleet Management Metrics Elements PDF
This slide showcases BI dashboard to ensure smooth working of shipping and logistics operations. It includes KPIs such as vehicle cost trend, price per unit, fuel consumption, distance, accident, etc. Showcasing this set of slides titled Business Intelligence Dashboard Showcasing Fleet Management Metrics Elements PDF. The topics addressed in these templates are Cost Trend, Price Per Unit Trend, Vehicle Cost Trend. All the content presented in this PPT design is completely editable. Download it and make adjustments in color, background, font etc. as per your unique business setting.

KPI Dashboard Of Real Estate Customer Relationship Management Pictures PDF
This slide represents the dashboard generated through CRM software used in a real estate company. It shows details related to key performance metrics such as leads by source, closed and pending transactions, projected monthly sales volume etc. Showcasing this set of slides titled KPI Dashboard Of Real Estate Customer Relationship Management Pictures PDF. The topics addressed in these templates are Projected Monthly Sales Volume, Leads By Source, Annual Commissions. All the content presented in this PPT design is completely editable. Download it and make adjustments in color, background, font etc. as per your unique business setting.
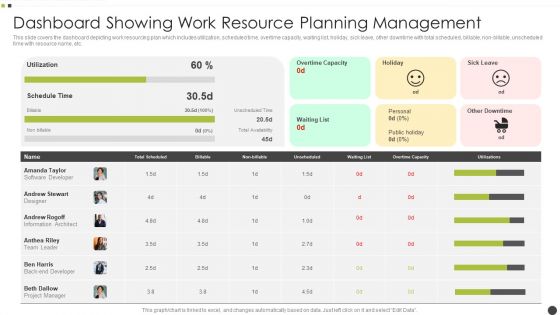
Dashboard Showing Work Resource Planning Management Microsoft PDF
This slide covers the dashboard depicting work resourcing plan which includes utilization, scheduled time, overtime capacity, waiting list, holiday, sick leave, other downtime with total scheduled, billable, non billable, unscheduled time with resource name, etc. Pitch your topic with ease and precision using this Dashboard Showing Work Resource Planning Management Microsoft PDF. This layout presents information on Software Developer, Team Leader, Information Architect. It is also available for immediate download and adjustment. So, changes can be made in the color, design, graphics or any other component to create a unique layout.
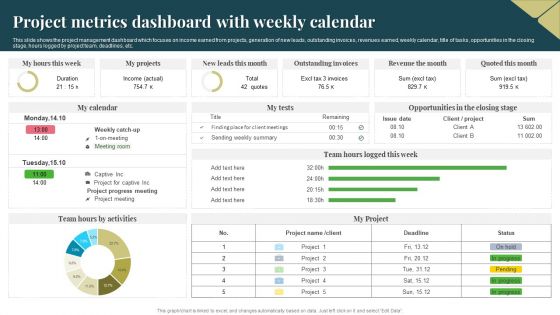
Project Metrics Dashboard With Weekly Calendar Download PDF
This slide shows the project management dashboard which focuses on income earned from projects, generation of new leads, outstanding invoices, revenues earned, weekly calendar, title of tasks, opportunities in the closing stage, hours logged by project team, deadlines, etc. Pitch your topic with ease and precision using this Project Metrics Dashboard With Weekly Calendar Download PDF. This layout presents information on Income, Revenue, Project. It is also available for immediate download and adjustment. So, changes can be made in the color, design, graphics or any other component to create a unique layout.

Competitive Procurement Pricing Benchmarks Analysis Dashboard Graphics PDF
This slide shows the dashboard representing the procurement price benchmarking comparative analysis report. It shows information related to quality KPIs, return cost analysis, supplier quality range and project analysis. Showcasing this set of slides titled Competitive Procurement Pricing Benchmarks Analysis Dashboard Graphics PDF. The topics addressed in these templates are Return Cost Analysis, Project Analysis, Supplier Quality Rating. All the content presented in this PPT design is completely editable. Download it and make adjustments in color, background, font etc. as per your unique business setting.
Facebook Ad Campaign Performance Tracking Dashboard Microsoft PDF
This slide represents the KPI dashboard to effectively measure and monitor performance of Facebook marketing campaign conducted by the organization to enhance customer engagement. It includes details related to KPIs such as ad impressions, ad reach etc. From laying roadmaps to briefing everything in detail, our templates are perfect for you. You can set the stage with your presentation slides. All you have to do is download these easy-to-edit and customizable templates. Facebook Ad Campaign Performance Tracking Dashboard Microsoft PDF will help you deliver an outstanding performance that everyone would remember and praise you for. Do download this presentation today.
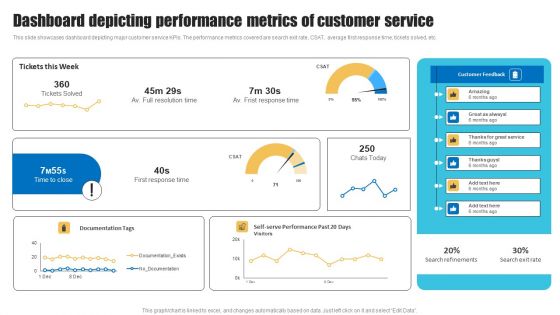
Dashboard Depicting Performance Metrics Of Customer Service Template PDF
This slide showcases dashboard depicting major customer service KPIs. The performance metrics covered are search exit rate, CSAT, average first response time, tickets solved, etc. Take your projects to the next level with our ultimate collection of Dashboard Depicting Performance Metrics Of Customer Service Template PDF. Slidegeeks has designed a range of layouts that are perfect for representing task or activity duration, keeping track of all your deadlines at a glance. Tailor these designs to your exact needs and give them a truly corporate look with your own brand colors they will make your projects stand out from the rest.
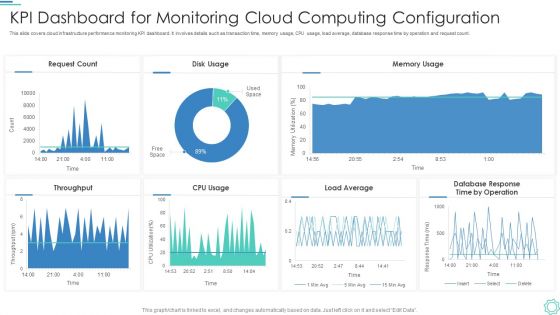
Kpi Dashboard For Monitoring Cloud Computing Configuration Portrait PDF
This slide covers cloud infrastructure performance monitoring KPI dashboard. It involves details such as transaction time, memory usage, CPU usage, load average, database response time by operation and request count.Showcasing this set of slides titled Kpi Dashboard For Monitoring Cloud Computing Configuration Portrait PDF. The topics addressed in these templates are Request Count, Disk Usage, Memory Usage. All the content presented in this PPT design is completely editable. Download it and make adjustments in color, background, font etc. as per your unique business setting.
Gross Profit Margin Dashboard With Revenue Vs Expenses Icons PDF
This slide showcases dashboard that can help organization to evaluate the revenue generated and expenses incurred in conducting operations. It also showcases gross profit and margin of last financial year. Pitch your topic with ease and precision using this Gross Profit Margin Dashboard With Revenue Vs Expenses Icons PDF. This layout presents information on Gross Profit Margin, EBITDA Margin, Net Profit Margin. It is also available for immediate download and adjustment. So, changes can be made in the color, design, graphics or any other component to create a unique layout.

Business Process Management Dashboard Showing Pending Processes Graphics PDF
This slide shows the dashboard of business management by calculating the number of processes that are running as well as the ones that are completed. It also shows the unsettled or remaining process with average process duration. Showcasing this set of slides titled Business Process Management Dashboard Showing Pending Processes Graphics PDF. The topics addressed in these templates are Average Process, Time Span, Number Operations. All the content presented in this PPT design is completely editable. Download it and make adjustments in color, background, font etc. as per your unique business setting.

Supply Chain Management Service Delivery And Management Dashboard Guidelines PDF
This slide shows an overview of the supply chain management delivery service to track the operationality of the overall process. It includes metrics such as on time deliveries, the average time to sell, and the out of stock rate. Pitch your topic with ease and precision using this Supply Chain Management Service Delivery And Management Dashboard Guidelines PDF. This layout presents information on Supply Chain Management, Service Delivery, Management Dashboard. It is also available for immediate download and adjustment. So, changes can be made in the color, design, graphics or any other component to create a unique layout.
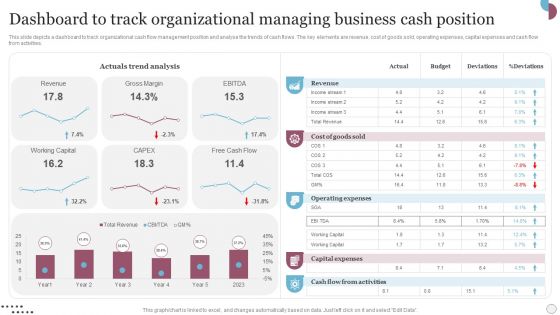
Dashboard To Track Organizational Managing Business Cash Position Mockup PDF
This slide depicts a dashboard to track organizational cash flow management position and analyse the trends of cash flows. The key elements are revenue, cost of goods sold, operating expenses, capital expenses and cash flow from activities. Showcasing this set of slides titled Dashboard To Track Organizational Managing Business Cash Position Mockup PDF. The topics addressed in these templates are Revenue, Working Capital, Free Cash Flow. All the content presented in this PPT design is completely editable. Download it and make adjustments in color, background, font etc. as per your unique business setting.

 Home
Home