Data Points
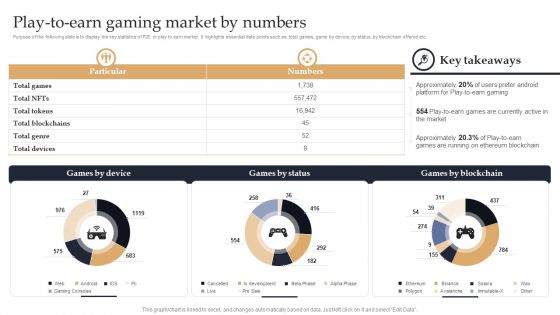
Web 3 0 Blockchain Based P2E Mobile Game Sector Report Promotional Plan Play To Earn Gaming Market By Numbers Summary PDF
Purpose of the following slide is to display the key statistics of P2E or play to earn market. It highlights essential data points such as total games, game by device, by status, by blockchain offered etc. Coming up with a presentation necessitates that the majority of the effort goes into the content and the message you intend to convey. The visuals of a PowerPoint presentation can only be effective if it supplements and supports the story that is being told. Keeping this in mind our experts created Web 3 0 Blockchain Based P2E Mobile Game Sector Report Promotional Plan Play To Earn Gaming Market By Numbers Summary PDF to reduce the time that goes into designing the presentation. This way, you can concentrate on the message while our designers take care of providing you with the right template for the situation.

Business Strategy And Promotional Approach For Multiplayer Oriented Mobile Game Play To Earn Gaming Market By Numbers Designs PDF
Purpose of the following slide is to display the key statistics of P2E or play to earn market. It highlights essential data points such as total games, game by device, by status, by blockchain offered etc. Want to ace your presentation in front of a live audience Our Business Strategy And Promotional Approach For Multiplayer Oriented Mobile Game Play To Earn Gaming Market By Numbers Designs PDF can help you do that by engaging all the users towards you. Slidegeeks experts have put their efforts and expertise into creating these impeccable powerpoint presentations so that you can communicate your ideas clearly. Moreover, all the templates are customizable, and easy to edit and downloadable. Use these for both personal and commercial use.
Grow Capital Through Equity Debt Key Financials Historical And Forecasted Icons PDF
The slide provides the historical current and previous year and projected for next five years financials of the company. Key Data points include revenue, operating income, net income, cash flow, cash in hand, total assets etc.Present like a pro with Grow Capital Through Equity Debt Key Financials Historical And Forecasted Icons PDF Create beautiful presentations together with your team, using our easy-to-use presentation slides. Share your ideas in real-time and make changes on the fly by downloading our templates. So whether you are in the office, on the go, or in a remote location, you can stay in sync with your team and present your ideas with confidence. With Slidegeeks presentation got a whole lot easier. Grab these presentations today.

Equity Funding And Debt Financing Pitchbook Key Financials Historical And Forecasted Slides PDF
The slide provides the historical current and previous year and projected for next five years financials of the company. Key Data points include revenue, operating income, net income, cash flow, cash in hand, total assets etc. Are you in need of a template that can accommodate all of your creative concepts This one is crafted professionally and can be altered to fit any style. Use it with Google Slides or PowerPoint. Include striking photographs, symbols, depictions, and other visuals. Fill, move around, or remove text boxes as desired. Test out color palettes and font mixtures. Edit and save your work, or work with colleagues. Download Equity Funding And Debt Financing Pitchbook Key Financials Historical And Forecasted Slides PDF and observe how to make your presentation outstanding. Give an impeccable presentation to your group and make your presentation unforgettable.
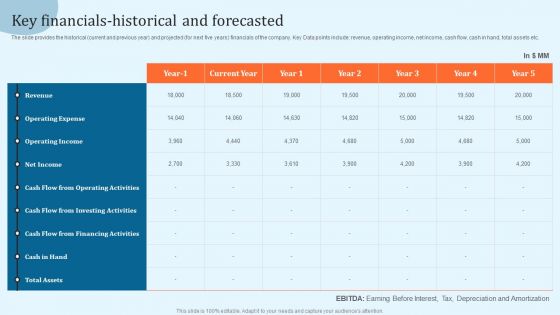
Equity Debt And Convertible Bond Investment Banking Pitch Book Key Financials Historical And Forecasted Graphics PDF
The slide provides the historical current and previous year and projected for next five years financials of the company. Key Data points include revenue, operating income, net income, cash flow, cash in hand, total assets etc. This modern and well arranged Equity Debt And Convertible Bond Investment Banking Pitch Book Key Financials Historical And Forecasted Graphics PDF provides lots of creative possibilities. It is very simple to customize and edit with the Powerpoint Software. Just drag and drop your pictures into the shapes. All facets of this template can be edited with Powerpoint no extra software is necessary. Add your own material, put your images in the places assigned for them, adjust the colors, and then you can show your slides to the world, with an animated slide included.
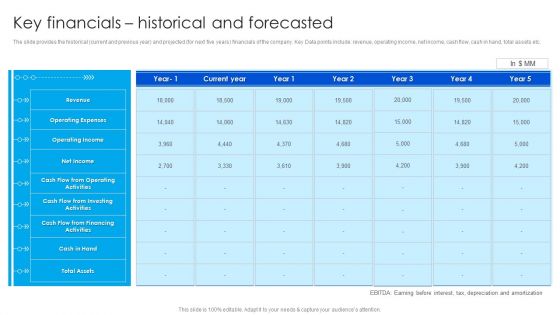
Strategy To Raise Funds Key Financials Historical And Forecasted Introduction PDF
The slide provides the historical current and previous year and projected for next five years financials of the company. Key Data points include revenue, operating income, net income, cash flow, cash in hand, total assets etc. Crafting an eye-catching presentation has never been more straightforward. Let your presentation shine with this tasteful yet straightforward Strategy To Raise Funds Key Financials Historical And Forecasted Introduction PDF template. It offers a minimalistic and classy look that is great for making a statement. The colors have been employed intelligently to add a bit of playfulness while still remaining professional. Construct the ideal Strategy To Raise Funds Key Financials Historical And Forecasted Introduction PDF that effortlessly grabs the attention of your audience Begin now and be certain to wow your customers.
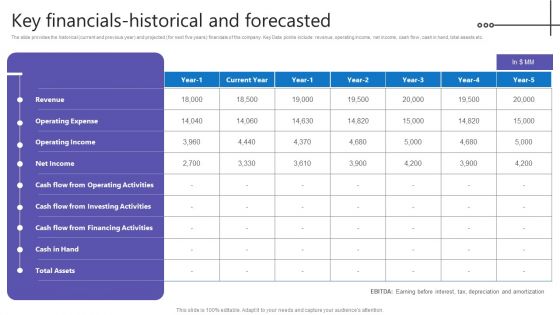
Credit Resources For New Business Key Financials Historical And Forecasted Demonstration PDF
The slide provides the historical current and previous year and projected for next five years financials of the company. Key Data points include revenue, operating income, net income, cash flow, cash in hand, total assets etc. Get a simple yet stunning designed Credit Resources For New Business Key Financials Historical And Forecasted Demonstration PDF. It is the best one to establish the tone in your meetings. It is an excellent way to make your presentations highly effective. So, download this PPT today from Slidegeeks and see the positive impacts. Our easy-to-edit Credit Resources For New Business Key Financials Historical And Forecasted Demonstration PDF can be your go-to option for all upcoming conferences and meetings. So, what are you waiting for Grab this template today.

Workers Administration Process Powerpoint Layout
This is a workers administration process powerpoint layout. This is a five stage process. The stages in this process are data transfer, activity, decision point, flow of controls, flow of information.
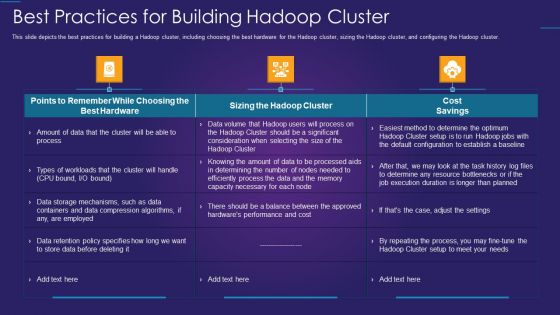
Apache Hadoop IT Best Practices For Building Hadoop Cluster Themes PDF
This slide depicts the best practices for building a Hadoop cluster, including choosing the best hardware for the Hadoop cluster, sizing the Hadoop cluster, and configuring the Hadoop cluster.Deliver an awe inspiring pitch with this creative apache hadoop it best practices for building hadoop cluster themes pdf bundle. Topics like cost savings, data retention policy, points to remember can be discussed with this completely editable template. It is available for immediate download depending on the needs and requirements of the user.
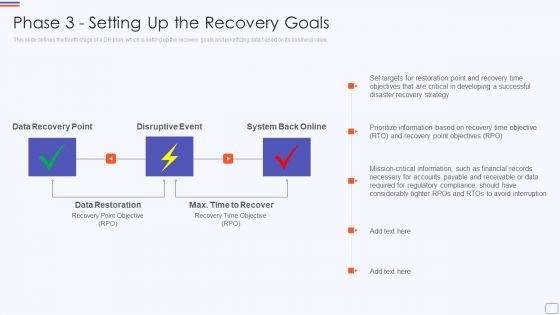
Phase 3 Setting Up The Recovery Goals Catastrophe Recovery Application Plan Graphics PDF
This slide defines the fourth stage of a DR plan, which is setting up the recovery goals and prioritizing data based on its business value. This is a phase 3 setting up the recovery goals catastrophe recovery application plan graphics pdf template with various stages. Focus and dispense information on three stages using this creative set, that comes with editable features. It contains large content boxes to add your information on topics like data recovery point, disruptive event, system back online, data restoration. You can also showcase facts, figures, and other relevant content using this PPT layout. Grab it now.
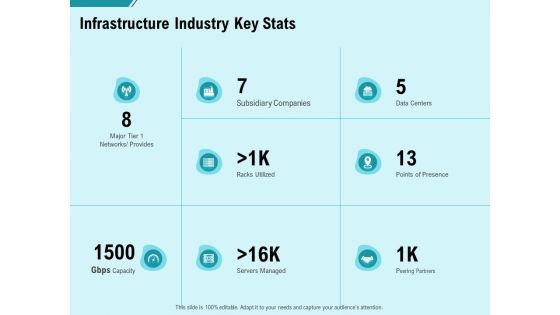
Facility Operations Contol Infrastructure Industry Key Stats Graphics PDF
Presenting this set of slides with name facility operations contol infrastructure industry key stats graphics pdf. The topics discussed in these slides are subsidiary companies, racks utilized, servers managed, points of presence, data centers, peering partners. This is a completely editable PowerPoint presentation and is available for immediate download. Download now and impress your audience.
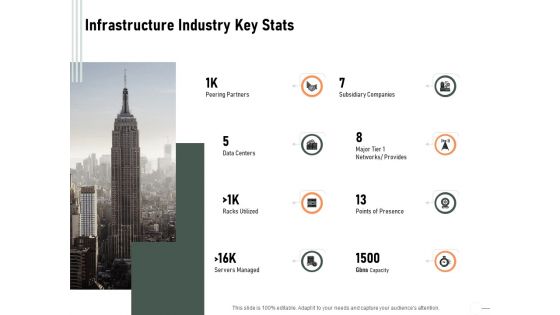
Construction Production Facilities Infrastructure Industry Key Stats Formats PDF
Presenting this set of slides with name construction production facilities infrastructure industry key stats formats pdf. This is a eight stage process. The stages in this process are subsidiary companies, racks utilized, servers managed, points of presence, data centers, peering partners. This is a completely editable PowerPoint presentation and is available for immediate download. Download now and impress your audience.

Key Cloud Network Security Challenges Sample PDF
The slide includes security challenges faced by users and providers in cloud computing. The elements are Ddos and denial of service attacks , data breaches , data loss , insecure access control points, metastructure and applistructure failures Persuade your audience using this Key Cloud Network Security Challenges Sample PDF. This PPT design covers five stages, thus making it a great tool to use. It also caters to a variety of topics including Insecure Access Control Points, Data Breaches, Data Loss. Download this PPT design now to present a convincing pitch that not only emphasizes the topic but also showcases your presentation skills.
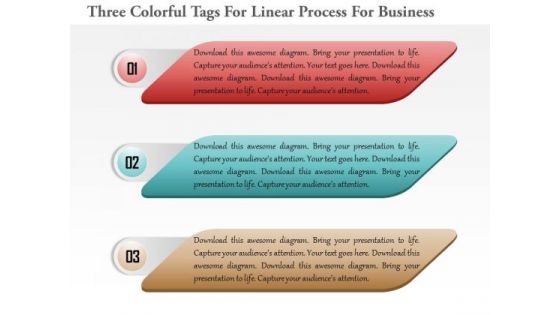
Three Colorful Tags For Linear Process For Business Presentation Template
Three colorful tags are used to design this power point template. This PPT contains the concept of business data display. Use this template for your business presentations.
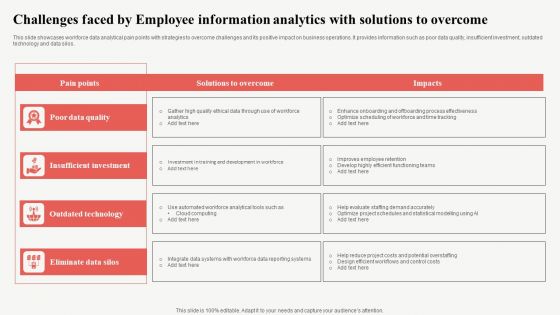
Challenges Faced By Employee Information Analytics With Solutions To Overcome Download PDF
This slide showcases workforce data analytical pain points with strategies to overcome challenges and its positive impact on business operations. It provides information such as poor data quality, insufficient investment, outdated technology and data silos. Persuade your audience using this Challenges Faced By Employee Information Analytics With Solutions To Overcome Download PDF. This PPT design covers four stages, thus making it a great tool to use. It also caters to a variety of topics including Data Quality, Insufficient Investment, Outdated Technology. Download this PPT design now to present a convincing pitch that not only emphasizes the topic but also showcases your presentation skills.
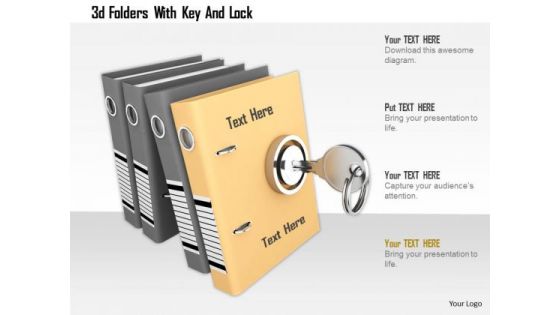
Stock Photo 3d Folders With Key And Lock PowerPoint Slide
Concept of data security has been displayed in this power point image template with suitable graphics. This image contains the graphics of 3d folders and key with lock. Use this PPT image for your data related presentations.

Best Practices For Implementing Expenditure Assessment Infographics PDF
This slide showcase best practices to follow while implementing spend analysis to get positive results for business. It includes points data evaluation, review consistency, consolidation, forecasting, analyze and automation. Presenting Best Practices For Implementing Expenditure Assessment Infographics PDF to dispense important information. This template comprises Four stages. It also presents valuable insights into the topics including Evaluation And Consistency, Data Consolidation, Forecast And Analyze. This is a completely customizable PowerPoint theme that can be put to use immediately. So, download it and address the topic impactfully.

Impact Of Cloud Services In Banking Sector Background PDF
This slide exhibits benefits of adopting cloud computing in banking institutions that increase operational efficiency. It includes points data security, infrastructure cost, operational efficiency, business continuity and Green IT.Presenting Impact Of Cloud Services In Banking Sector Background PDF to dispense important information. This template comprises five stages. It also presents valuable insights into the topics including Data Security, Infrastructure Cost, Operational Efficiency. This is a completely customizable PowerPoint theme that can be put to use immediately. So, download it and address the topic impactfully.
Business Strategy And Promotional Approach For Multiplayer Oriented Mobile Game Casual Gaming User Demographics Icons PDF
The following slide helps in understanding the user demographics of mobile casual gamers, it displays essential data points such as average daily spend by gender, gender breakdown by causal game, age breakdown and average daily time spent by age. Presenting this PowerPoint presentation, titled Business Strategy And Promotional Approach For Multiplayer Oriented Mobile Game Casual Gaming User Demographics Icons PDF, with topics curated by our researchers after extensive research. This editable presentation is available for immediate download and provides attractive features when used. Download now and captivate your audience. Presenting this Business Strategy And Promotional Approach For Multiplayer Oriented Mobile Game Casual Gaming User Demographics Icons PDF. Our researchers have carefully researched and created these slides with all aspects taken into consideration. This is a completely customizable Business Strategy And Promotional Approach For Multiplayer Oriented Mobile Game Casual Gaming User Demographics Icons PDF that is available for immediate downloading. Download now and make an impact on your audience. Highlight the attractive features available with our PPTs.
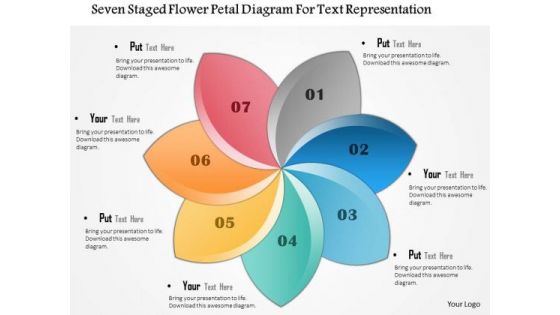
Business Diagram Seven Staged Flower Petal Diagram For Text Representation Presentation Template
This business diagram displays seven staged flower petal diagram. This Power Point slide can be used for data representation. Use this PPT slide to show flow of activities in circular manner. Get professional with this exclusive business slide.
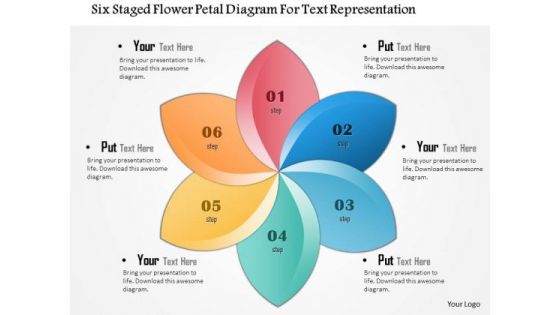
Business Diagram Six Staged Flower Petal Diagram For Text Representation Presentation Template
This business diagram displays six staged flower petal diagram. This Power Point slide can be used for data representation. Use this PPT slide to show flow of activities in circular manner. Get professional with this exclusive business slide.
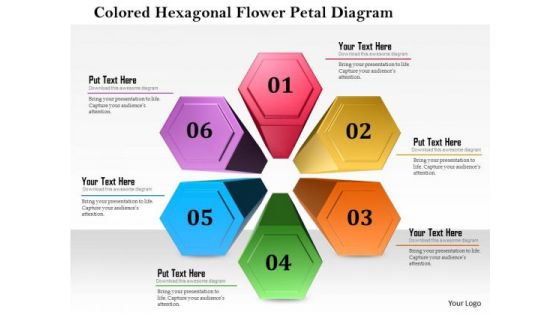
Business Diagram Colored Hexagon Flower Petal Diagram Presentation Template
This business diagram displays colored hexagon flower petal design. This Power Point slide can be used for data representation. Use this PPT slide to show flow of activities in circular manner. Get professional with this exclusive business slide.

Business Diagram Three Staged Colorful Ribbon Design Presentation Template
This business diagram displays three staged circular ribbon. This Power Point slide can be used for data representation. Use this PPT slide to show flow of activities in circular manner. Get professional with this exclusive business slide.
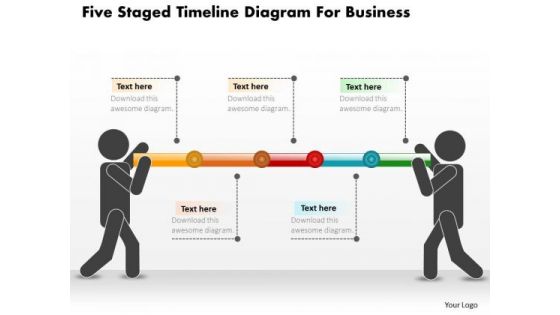
Business Diagram Five Staged Timeline Diagram For Business PowerPoint Slide
This PowerPoint template displays five points timeline diagram. This business diagram has been designed with graphic of timeline with five points, text space and start, end points. Use this diagram, in your presentations to display process steps, stages, timelines and business management. Make wonderful presentations using this business slide.
Business Diagram Five Staged Multiple Icons Text Boxes Presentation Template
Five staged multiple icons style text boxes has been used to design this power point template. This PPT contains the concept of data representation. Display all data flow related topics in your business presentation with this PPT.

Business Diagram Five Staged Vertical Ribbon Text Boxes Presentation Template
Five staged vertical ribbon text boxes has been used to craft this power point template. This PPT contains the concept of data representation. Use this PPT for your data related topics in any business and marketing presentation.

Business Diagram Text Boxes Displaying Four Options Presentation Template
Four staged envelop style text boxes has been used to craft this power point template. This PPT contains the concept of data representation. This PPT can be used for your data related topics in any business and marketing presentation.
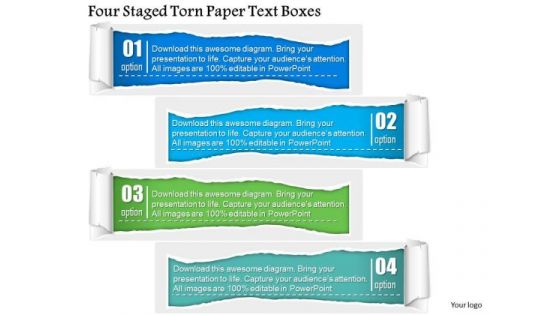
Business Diagram Four Staged Torn Paper Text Boxes PowerPoint Template
Four staged torn paper style text boxes are used to craft this power point template. This PPT contains the concept of data representation for business process. Use this PPT and build an innovative presentation for data based topics.
Business Diagram Three Staged Sequential Infographics With Icons PowerPoint Template
Three staged sequential info graphic with icons has been used to design this power point template. This PPT contains the concept of data flow. Use this PPT diagram to show marketing and business data in any presentation.
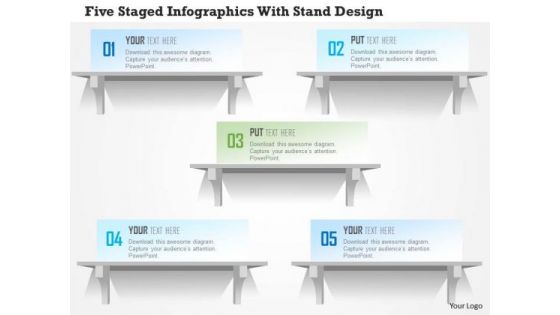
Business Diagram Five Staged Infographics With Stand Design PowerPoint Template
Five staged info graphics with stand has been used to craft this power point template. This PPT contains the concept of data flow. Use this PPT slide for your sales and business data related presentations.
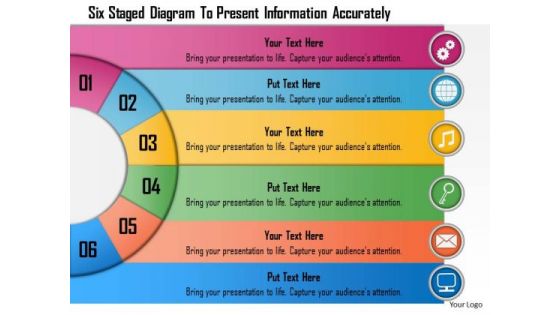
Business Diagram Six Staged Diagram To Present Information Accurately Presentation Template
Six staged semicircular text boxes are used to craft this power point template. This PPT contains the concept of data representation. Use this PPT for your business and sales related data representation in any presentation.

Business Diagram Six Staged Diagram To Present Relevant Information Presentation Template
Six staged colorful ribbon text boxes has been used to craft this power point template. This PPT contains the concept of data representation. This PPT is suitable for your data related topics in any business and marketing presentation.
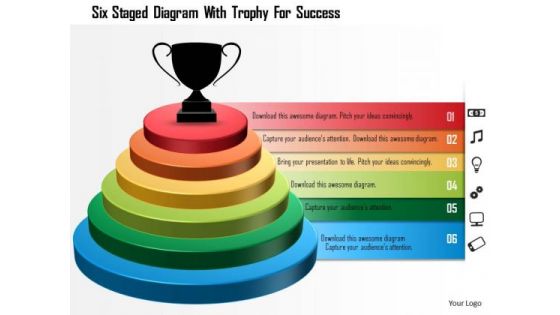
Business Diagram Six Staged Diagram With Trophy For Success Presentation Template
Six staged colorful ribbon text boxes has been used to craft this power point template. This PPT contains the concept of data representation. This PPT is suitable for your data related topics in any business and marketing presentation.
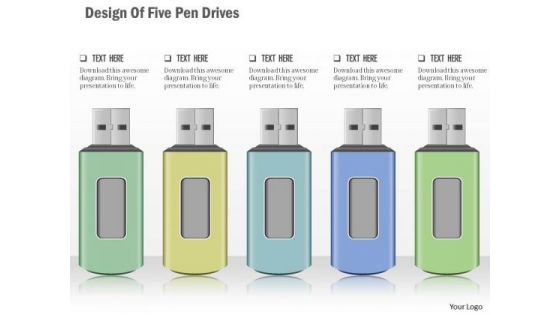
Business Diagram Design Of Five Pen Drives Presentation Template
Graphic of five colored pen drives has been used to craft this power point template. This PPT contains the concept of data storage. Use this PPT for data technology related presentations.

Stock Photo Blue Colored Pen Drive With Combination Lock PowerPoint Slide
Graphic of blue colored pen drive and combination lock has been used to design this power point template. This PPT contains the concept of data security and data technology. Use this PPT for your business and marketing related presentations.
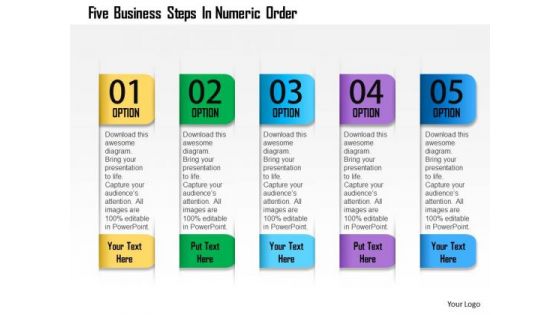
Business Diagram Five Business Steps In Numeric Order Presentation Template
Five colored linear text boxes are used to design this power point template. This PPT contains the concept of data flow updation. Display any data in your business presentation with this unique PPT.

Business Diagram Five Steps In Concentric Circle Presentation Template
Five staged colorful circular text boxes in linear flow has been used to design this power point template. This PPT contains the concept of data representation. Use this PPT for your data related topics in any business or sales presentation.
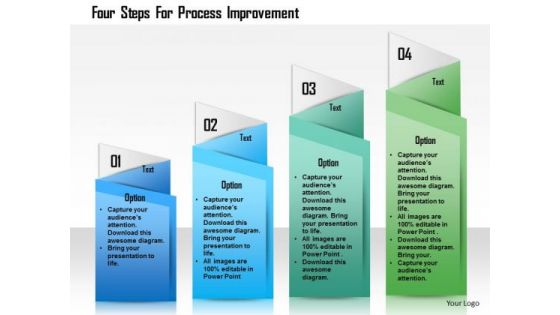
Business Diagram Four Steps For Process Improvement Presentation Template
Graphic of four sequential text boxes are used to design this power point template. This PPT contains the concept of data flow in any process. Use this PPT for your data and process flow related topics in any presentation.
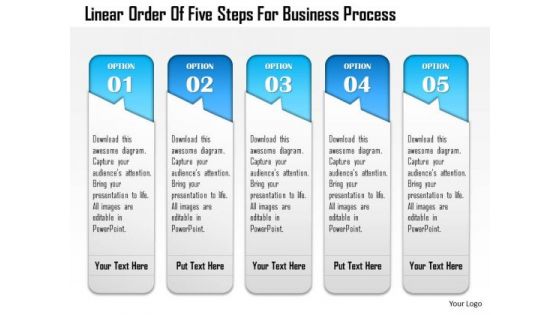
Business Diagram Linear Order Of Five Steps For Business Process Presentation Template
Five linear text boxes are used to design this power point template. This PPT contains the concept of data representation. Use this PPT for your data related topics in any presentation.
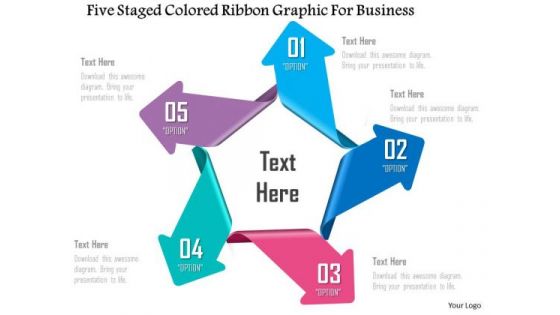
Business Diagram Five Staged Colored Ribbon Graphic For Business PowerPoint Template
Five staged colored ribbon text boxes are used to design this power point template. This PPT contains the concept of data representation. Use this PPT slide for your marketing and business data related presentations.
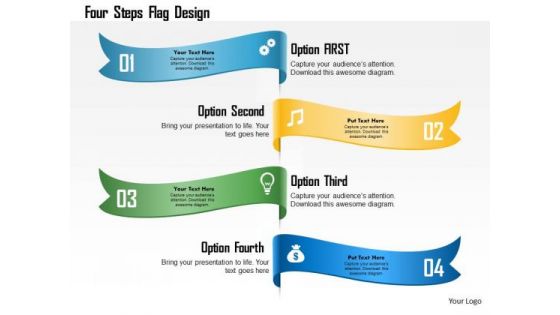
Business Diagram Four Steps Flag Design Presentation Template
Graphic of four vertical colorful flags are used to design this power point template. This PPT contains the concept of data representation. Use this PPT for your data related topics in any presentation.

Business Diagram Timeline Diagram With Six Options Presentation Template
Graphic of designer circles has been used to design this power point template. This PPT contains the concept of data representation. Use this PPT for your business and data related presentation.

Business Activities Assessment Examples Infrastructure Industry Key Stats Diagrams PDF
Deliver an awe inspiring pitch with this creative business activities assessment examples infrastructure industry key stats diagrams pdf bundle. Topics like subsidiary companies, points of presence, racks utilized, data centers can be discussed with this completely editable template. It is available for immediate download depending on the needs and requirements of the user.
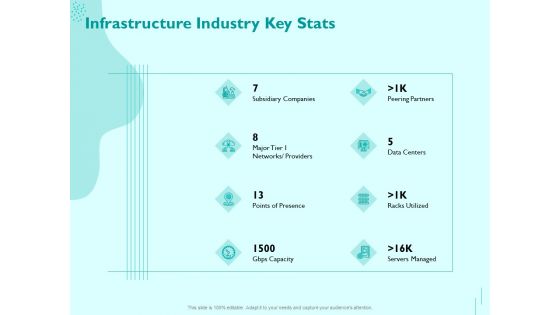
Managing IT Operating System Infrastructure Industry Key Stats Ppt Slides PDF
Presenting this set of slides with name managing it operating system infrastructure industry key stats ppt slides pdf. This is a eight stage process. The stages in this process are subsidiary companies, points of presence, servers managed, data centers, peering partners. This is a completely editable PowerPoint presentation and is available for immediate download. Download now and impress your audience.

Utilizing Infrastructure Management Using Latest Methods Infrastructure Industry Key Stats Portrait PDF
Deliver and pitch your topic in the best possible manner with this utilizing infrastructure management using latest methods infrastructure industry key stats portrait pdf. Use them to share invaluable insights on subsidiary companies, peering partners, points of presence, racks utilized, data center and impress your audience. This template can be altered and modified as per your expectations. So, grab it now.
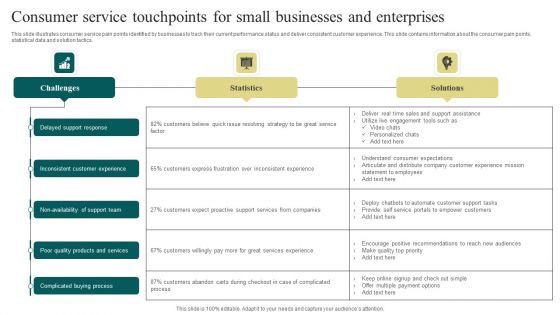
Consumer Service Touchpoints For Small Businesses And Enterprises Information PDF
This slide illustrates consumer service pain points identified by businesses to track their current performance status and deliver consistent customer experience. This slide contains information about the consumer pain points, statistical data and solution tactics. Showcasing this set of slides titled Consumer Service Touchpoints For Small Businesses And Enterprises Information PDF. The topics addressed in these templates are Delayed Support Response, Inconsistent Customer Experience, Complicated Buying Process. All the content presented in this PPT design is completely editable. Download it and make adjustments in color, background, font etc. as per your unique business setting.
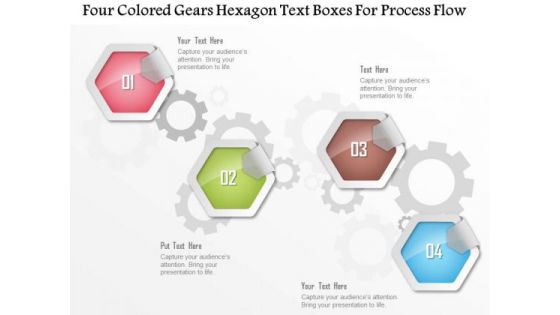
Business Diagram Four Colored Gears Hexagon Text Boxes For Process Flow Presentation Template
Four colored gears hexagon text boxes are used to design this power point template. This diagram contains hexagons for data representation. Use this diagram to display business process workflows in any presentation.
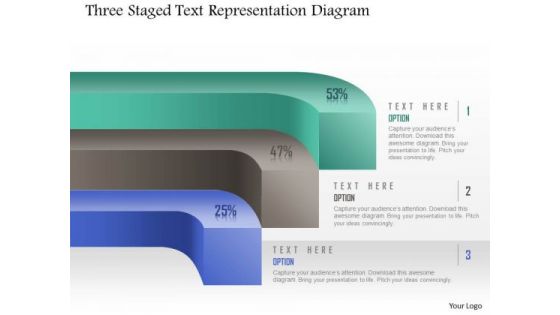
Business Diagram Three Staged Text Representation Diagram Presentation Template
Display the concept of data flow in any presentation with this unique power point template. This PPT contains the graphic of three staged text boxes. Use this PPT for your business and management related presentations.

Stock Photo Blue Cloud With Metal Shield Pwerpoint Slide
Concept of data protection has been displayed in this business power point image. To show this concept we have used graphic of blue cloud and metal shield. Use this image in technology or cloud computing related presentation.

Quality Improvement Checklist In Nursing Organization Inspiration Pdf
This slide shows quality operations checklist for nursing organization to continuously improve delivery and standard of services. It include checklist points related to data analysis, budget allocation, etc. Pitch your topic with ease and precision using this Quality Improvement Checklist In Nursing Organization Inspiration Pdf. This layout presents information on Assessment Checklist, Yes, No. It is also available for immediate download and adjustment. So, changes can be made in the color, design, graphics or any other component to create a unique layout.
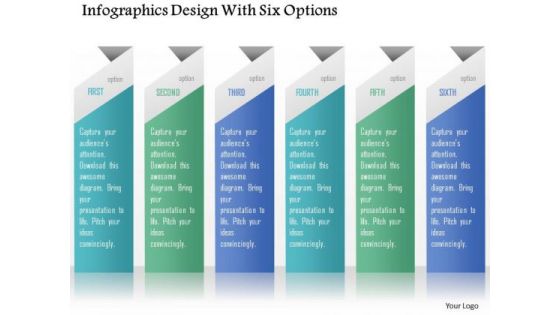
Business Diagram Infographics Design With Six Options Presentation Template
Graphic of six staged info graphics has been used to design this power point template. This PPT diagram contains the concept of data flow and representation. Use this PPT for data technology related presentations.

Business Diagram Infographics Design With Four Options Presentation Template
Four staged info graphics has been used to design this power point template. This PPT diagram contains the concept of data flow. Use this PPT for business and marketing data related topics in any presentation.

Stock Photo Laptops Connected With Cloud Technology PowerPoint Slide
Graphic of multiple laptops and cloud are used to decorate this power point template. This image template contains the concept of data storage and transfer. Use this PPT for all your data technology and cloud computing related presentations.
Business Diagram Five Icons With Circle Diagram Presentation Template
Five staged process flow diagram has been used to craft this power point template. This PPT diagram contains the concept of data and process flow .Use this PPT for business and data related presentations.
Business Diagram Four Icons With Circle Diagram Presentation Template
Four staged process flows has been used to design this power point template. This PPT diagram contains the concept of data flow. Use this PPT for business and marketing data related topics in any presentation.

Business Diagram Building Diagram With Three Steps Presentation Template
Three staged house graphic has been used to craft this power point template. This PPT diagram contains the concept of data representation. Use this PPT for your data and business related presentations.

Business Diagram Eight Arrows Steps With Globe Presentation Template
Graphic of five staged film roll diagram has been used to craft this power point template diagram. This PPT contains the concept of data representation. Use this PPT for business and marketing data related presentations.
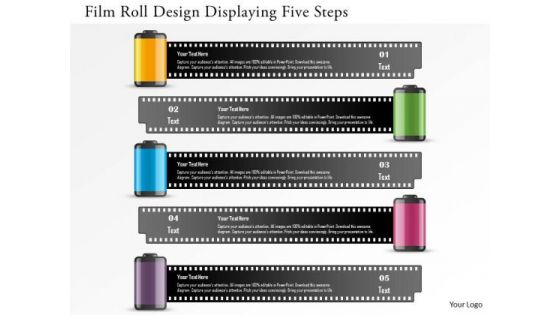
Business Diagram Film Roll Design Displaying Five Steps Presentation Template
Graphic of five staged film roll diagram has been used to craft this power point template diagram. This PPT contains the concept of data representation. Use this PPT for business and marketing data related presentations.

Business Diagram Three Staged Step Diagram For Process Flow Presentation Template
Three staged step diagram has been used to craft this power point template diagram. This PPT contains the concept of data and process flow representation. Use this PPT for business and marketing data related presentations.
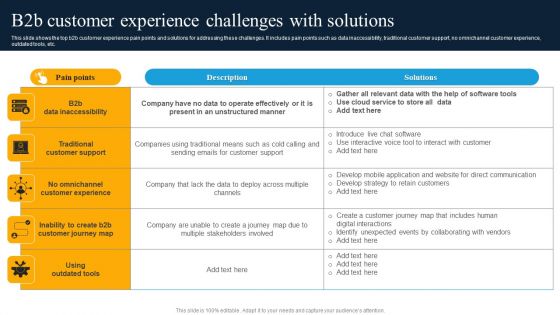
B2b Customer Experience Challenges With Solutions Infographics PDF
This slide shows the top b2b customer experience pain points and solutions for addressing these challenges. It includes pain points such as data inaccessibility, traditional customer support, no omnichannel customer experience, outdated tools, etc. Showcasing this set of slides titled B2b Customer Experience Challenges With Solutions Infographics PDF. The topics addressed in these templates are B2b Data Inaccessibility, Traditional Customer Support, Using Outdated Tools . All the content presented in this PPT design is completely editable. Download it and make adjustments in color, background, font etc. as per your unique business setting.

 Home
Home