Data Architecture Diagram

Key Stages Of Cloud Data Transfer Process Ppt PowerPoint Presentation File Good PDF
Presenting key stages of cloud data transfer process ppt powerpoint presentation file good pdf to dispense important information. This template comprises three stages. It also presents valuable insights into the topics including planning, design, stabilization. This is a completely customizable PowerPoint theme that can be put to use immediately. So, download it and address the topic impactfully.
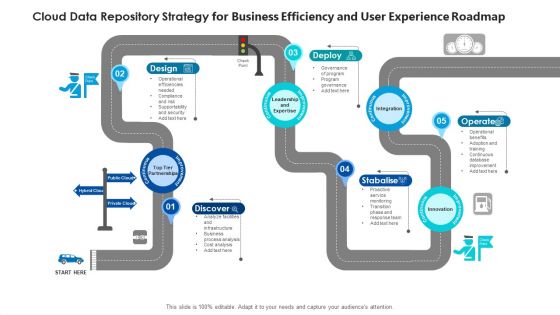
Cloud Data Repository Strategy For Business Efficiency And User Experience Roadmap Professional PDF
Presenting cloud data repository strategy for business efficiency and user experience roadmap professional pdf to dispense important information. This template comprises five stages. It also presents valuable insights into the topics including design, discover, stabalise, operate, deploy. This is a completely customizable PowerPoint theme that can be put to use immediately. So, download it and address the topic impactfully.
Data Center Relocation Implementation Three Months Roadmap Ppt Icon Graphics Template PDF
Presenting our jaw-dropping data center relocation implementation three months roadmap ppt icon graphics template pdf. You can alternate the color, font size, font type, and shapes of this PPT layout according to your strategic process. This PPT presentation is compatible with Google Slides and is available in both standard screen and widescreen aspect ratios. You can also download this well-researched PowerPoint template design in different formats like PDF, JPG, and PNG. So utilize this visually-appealing design by clicking the download button given below.
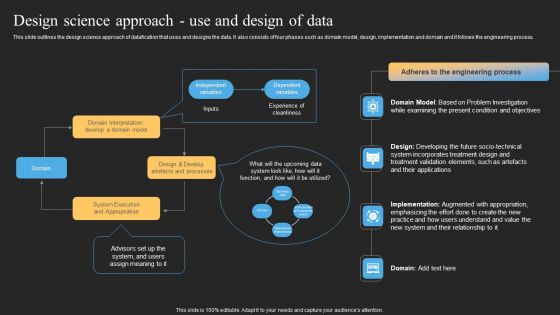
Datafy Design Science Approach Use And Design Of Data Microsoft PDF
This slide outlines the design science approach of datafication that uses and designs the data. It also consists of four phases such as domain model, design, implementation and domain and it follows the engineering process. Present like a pro with Datafy Design Science Approach Use And Design Of Data Microsoft PDF Create beautiful presentations together with your team, using our easy-to-use presentation slides. Share your ideas in real-time and make changes on the fly by downloading our templates. So whether youre in the office, on the go, or in a remote location, you can stay in sync with your team and present your ideas with confidence. With Slidegeeks presentation got a whole lot easier. Grab these presentations today.
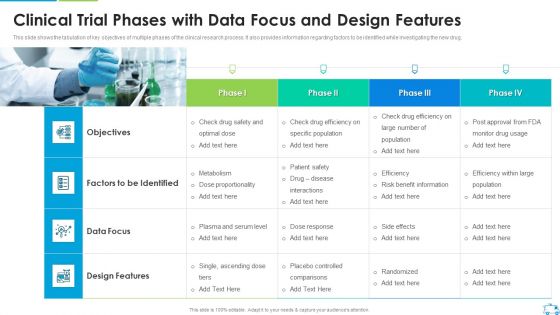
Clinical Trial Phases With Data Focus And Design Features Introduction PDF
This slide shows the tabulation of key objectives of multiple phases of the clinical research process. It also provides information regarding factors to be identified while investigating the new drug.Deliver and pitch your topic in the best possible manner with this Clinical Trial Phases With Data Focus And Design Features Introduction PDF Use them to share invaluable insights on Specific Population, Factors To Be Identified, Design Features and impress your audience. This template can be altered and modified as per your expectations. So, grab it now.
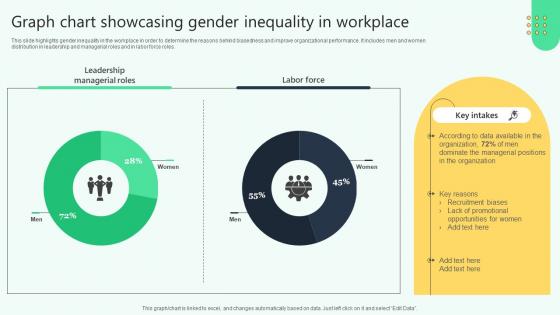
Graph Chart Showcasing Gender Inequality In Workplace Analysing Hr Data For Effective Decision Making
This slide highlights gender inequality in the workplace in order to determine the reasons behind biasedness and improve organizational performance. It includes men and women distribution in leadership and managerial roles and in labor force roles. This Graph Chart Showcasing Gender Inequality In Workplace Analysing Hr Data For Effective Decision Making is perfect for any presentation, be it in front of clients or colleagues. It is a versatile and stylish solution for organizing your meetings. The Graph Chart Showcasing Gender Inequality In Workplace Analysing Hr Data For Effective Decision Making features a modern design for your presentation meetings. The adjustable and customizable slides provide unlimited possibilities for acing up your presentation. Slidegeeks has done all the homework before launching the product for you. So, do not wait, grab the presentation templates today

Data Role In Risk Management With Better Decision Making Ppt PowerPoint Presentation Professional Images PDF
Persuade your audience using this data role in risk management with better decision making ppt powerpoint presentation professional images pdf. This PPT design covers four stages, thus making it a great tool to use. It also caters to a variety of topics including increased efficiency, better decision making, increased accountability, financial health. Download this PPT design now to present a convincing pitch that not only emphasizes the topic but also showcases your presentation skills.
Data Science And BI Quarterly Roadmap For Scientific Capability Improvement Icons
Introducing our data science and bi quarterly roadmap for scientific capability improvement icons. This PPT presentation is Google Slides compatible, therefore, you can share it easily with the collaborators for measuring the progress. Also, the presentation is available in both standard screen and widescreen aspect ratios. So edit the template design by modifying the font size, font type, color, and shapes as per your requirements. As this PPT design is fully editable it can be presented in PDF, JPG and PNG formats.
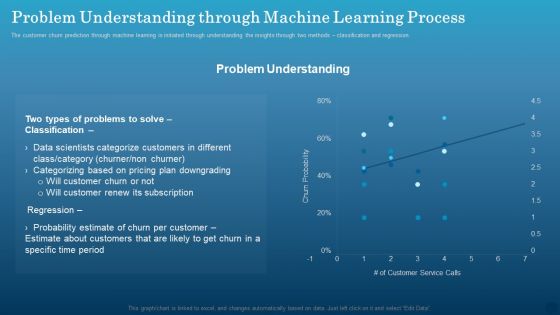
Data Monetization Approach To Drive Business Growth Problem Understanding Through Machine Learning Process Infographics PDF
The customer churn prediction through machine learning is initiated through understanding the insights through two methods classification and regression. Crafting an eye catching presentation has never been more straightforward. Let your presentation shine with this tasteful yet straightforward Data Monetization Approach To Drive Business Growth Problem Understanding Through Machine Learning Process Infographics PDF template. It offers a minimalistic and classy look that is great for making a statement. The colors have been employed intelligently to add a bit of playfulness while still remaining professional. Construct the ideal Data Monetization Approach To Drive Business Growth Problem Understanding Through Machine Learning Process Infographics PDF that effortlessly grabs the attention of your audience. Begin now and be certain to wow your customers.

Data Processing Services Delivery Our Approach To IT Culture Ppt Infographic Template Professional PDF
This slide define how our organization will approach to build an IT culture and this will include factors such as determine target state, translation of culture themes, cascade into key components for success and matrices establishment. Presenting Data Processing Services Delivery Our Approach To IT Culture Ppt Infographic Template Professional PDF to provide visual cues and insights. Share and navigate important information on four stages that need your due attention. This template can be used to pitch topics like Define Target State, Translate Culture Themes, Cascade Key Components. In addtion, this PPT design contains high resolution images, graphics, etc, that are easily editable and available for immediate download.
Data Center Relocation Quarterly Roadmap For Reducing Wasteful Processes Icons PDF
Presenting our innovatively-structured data center relocation quarterly roadmap for reducing wasteful processes icons pdf Template. Showcase your roadmap process in different formats like PDF, PNG, and JPG by clicking the download button below. This PPT design is available in both Standard Screen and Widescreen aspect ratios. It can also be easily personalized and presented with modified font size, font type, color, and shapes to measure your progress in a clear way.
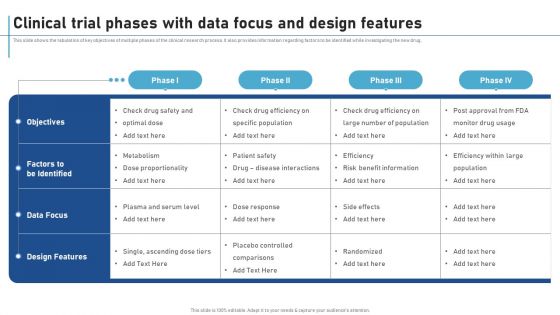
Clinical Trial Phases With Data Focus And Design Features New Clinical Drug Trial Process Inspiration PDF
This slide shows the tabulation of key objectives of multiple phases of the clinical research process. It also provides information regarding factors to be identified while investigating the new drug. Take your projects to the next level with our ultimate collection of Clinical Trial Phases With Data Focus And Design Features New Clinical Drug Trial Process Inspiration PDF. Slidegeeks has designed a range of layouts that are perfect for representing task or activity duration, keeping track of all your deadlines at a glance. Tailor these designs to your exact needs and give them a truly corporate look with your own brand colors they well make your projects stand out from the rest.
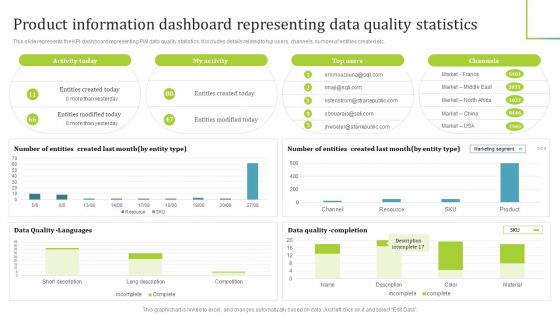
PIM Software Deployment To Enhance Conversion Rates Product Information Dashboard Representing Data Quality Statistics Download PDF
This slide represents the KPI dashboard representing PIM data quality statistics. It includes details related to top users, channels, number of entities created etc. Coming up with a presentation necessitates that the majority of the effort goes into the content and the message you intend to convey. The visuals of a PowerPoint presentation can only be effective if it supplements and supports the story that is being told. Keeping this in mind our experts created PIM Software Deployment To Enhance Conversion Rates Product Information Dashboard Representing Data Quality Statistics Download PDF to reduce the time that goes into designing the presentation. This way, you can concentrate on the message while our designers take care of providing you with the right template for the situation.
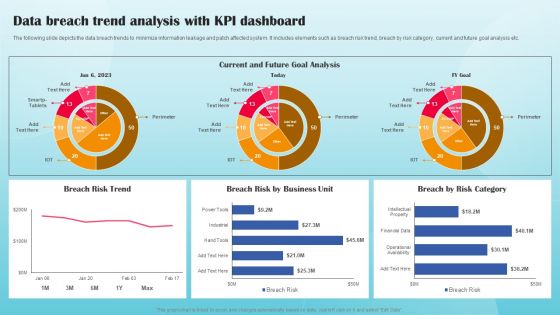
Data Breach Trend Analysis With KPI Dashboard Ppt PowerPoint Presentation File Portfolio PDF
The following slide depicts the data breach trends to minimize information leakage and patch affected system. It includes elements such as breach risk trend, breach by risk category, current and future goal analysis etc. This modern and well arranged Data Breach Trend Analysis With KPI Dashboard Ppt PowerPoint Presentation File Portfolio PDF provides lots of creative possibilities. It is very simple to customize and edit with the Powerpoint Software. Just drag and drop your pictures into the shapes. All facets of this template can be edited with Powerpoint no extra software is necessary. Add your own material, put your images in the places assigned for them, adjust the colors, and then you can show your slides to the world, with an animated slide included.
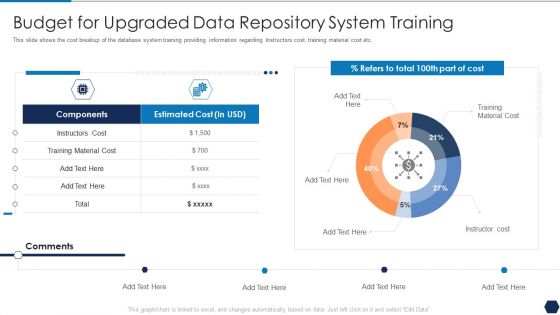
Tactical Plan For Upgrading DBMS Budget For Upgraded Data Repository System Training Designs PDF
This slide shows the cost breakup of the database system training providing information regarding Instructors cost, training material cost etc. Deliver an awe inspiring pitch with this creative tactical plan for upgrading dbms budget for upgraded data repository system training designs pdf bundle. Topics like instructors cost, training material cost can be discussed with this completely editable template. It is available for immediate download depending on the needs and requirements of the user.
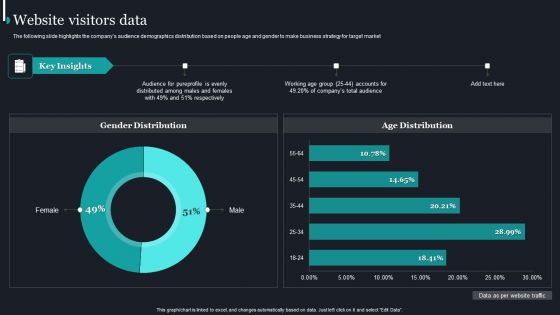
Pureprofile Business Overview Website Visitors Data Ppt Show Design Templates PDF
The following slide highlights the companys audience demographics distribution based on people age and gender to make business strategy for target market. Deliver an awe inspiring pitch with this creative Pureprofile Business Overview Website Visitors Data Ppt Show Design Templates PDF bundle. Topics like Gender Distribution, Age Distribution, Key Insights can be discussed with this completely editable template. It is available for immediate download depending on the needs and requirements of the user.
Java Programming Data Types With Numeric And Non Numeric Ppt PowerPoint Presentation Icon Outline PDF
Persuade your audience using this java programming data types with numeric and non numeric ppt powerpoint presentation icon outline pdf. This PPT design covers five stages, thus making it a great tool to use. It also caters to a variety of topics including primitive, numeric, non primitive. Download this PPT design now to present a convincing pitch that not only emphasizes the topic but also showcases your presentation skills.

Data Organization Five Years Roadmap With Statistics And Machine Learning Guidelines
Introducing our data organization five years roadmap with statistics and machine learning guidelines. This PPT presentation is Google Slides compatible, therefore, you can share it easily with the collaborators for measuring the progress. Also, the presentation is available in both standard screen and widescreen aspect ratios. So edit the template design by modifying the font size, font type, color, and shapes as per your requirements. As this PPT design is fully editable it can be presented in PDF, JPG and PNG formats.

Concentric Data Flow Process 9 Stages Ppt Easy Business Plan Template PowerPoint Slides
We present our concentric data flow process 9 stages ppt easy business plan template PowerPoint Slides.Use our Process and Flows PowerPoint Templates because Our PowerPoint Templates and Slides will effectively help you save your valuable time. They are readymade to fit into any presentation structure. Download our Flow Charts PowerPoint Templates because You can Zap them with our PowerPoint Templates and Slides. See them reel under the impact. Download and present our Business PowerPoint Templates because You aspire to touch the sky with glory. Let our PowerPoint Templates and Slides provide the fuel for your ascent. Present our Shapes PowerPoint Templates because Our PowerPoint Templates and Slides are topically designed to provide an attractive backdrop to any subject. Download and present our Success PowerPoint Templates because Our PowerPoint Templates and Slides offer you the widest possible range of options.Use these PowerPoint slides for presentations relating to Flow, network, platform, diagram, connection, connect, business, flowchart, function, organization, coordinates, molecular, square, plan, interrelations, scheme, graphic, technology, graph, molecule, arrangement, comparison, scientific, variable, project, relationships, lines,attached, segments, interconnected, solution, organize, device, analyze, draft, pattern, construction, structure, nine, steps. The prominent colors used in the PowerPoint template are Blue light, White, Gray.
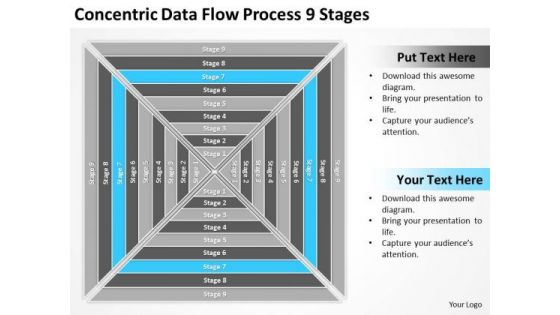
Concentric Data Flow Process 9 Stages Ppt Template For Business Plan PowerPoint Slides
We present our concentric data flow process 9 stages ppt template for business plan PowerPoint Slides.Download our Process and Flows PowerPoint Templates because Our PowerPoint Templates and Slides are designed to help you succeed. They have all the ingredients you need. Download and present our Flow Charts PowerPoint Templates because Our PowerPoint Templates and Slides will weave a web of your great ideas. They are gauranteed to attract even the most critical of your colleagues. Use our Business PowerPoint Templates because Our PowerPoint Templates and Slides will provide you a launch platform. Give a lift off to your ideas and send them into orbit. Download and present our Shapes PowerPoint Templates because You will get more than you ever bargained for. Use our Success PowerPoint Templates because you should Experience excellence with our PowerPoint Templates and Slides. They will take your breath away.Use these PowerPoint slides for presentations relating to Flow, network, platform, diagram, connection, connect, business, flowchart, function, organization, coordinates, molecular, square, plan, interrelations, scheme, graphic, technology, graph, molecule, arrangement, comparison, scientific, variable, project, relationships, lines,attached, segments, interconnected, solution, organize, device, analyze, draft, pattern, construction, structure, nine, steps. The prominent colors used in the PowerPoint template are Blue light, White, Gray.
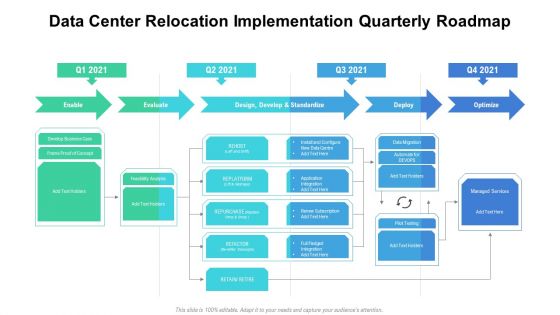
Data Center Relocation Implementation Quarterly Roadmap Ppt Infographic Template Portfolio PDF
Introducing our data center relocation implementation quarterly roadmap ppt infographic template portfolio pdf. This PPT presentation is Google Slides compatible, therefore, you can share it easily with the collaborators for measuring the progress. Also, the presentation is available in both standard screen and widescreen aspect ratios. So edit the template design by modifying the font size, font type, color, and shapes as per your requirements. As this PPT design is fully editable it can be presented in PDF, JPG and PNG formats.
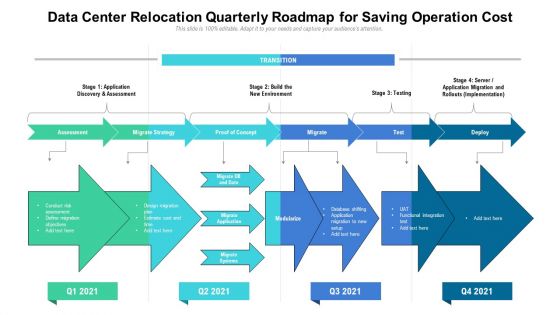
Data Center Relocation Quarterly Roadmap For Saving Operation Cost Microsoft PDF
Introducing our data center relocation quarterly roadmap for saving operation cost microsoft pdf. This PPT presentation is Google Slides compatible, therefore, you can share it easily with the collaborators for measuring the progress. Also, the presentation is available in both standard screen and widescreen aspect ratios. So edit the template design by modifying the font size, font type, color, and shapes as per your requirements. As this PPT design is fully editable it can be presented in PDF, JPG and PNG formats.

Data Organization Six Months Roadmap With Statistics And Machine Learning Portrait
Presenting our innovatively structured data organization six months roadmap with statistics and machine learning portrait Template. Showcase your roadmap process in different formats like PDF, PNG, and JPG by clicking the download button below. This PPT design is available in both Standard Screen and Widescreen aspect ratios. It can also be easily personalized and presented with modified font size, font type, color, and shapes to measure your progress in a clear way.
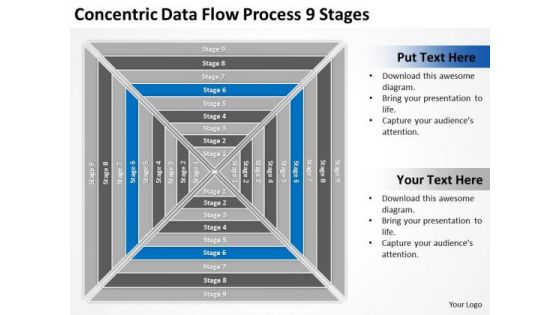
Concentric Data Flow Process 9 Stages Business Plans For PowerPoint Templates
We present our concentric data flow process 9 stages business plans for PowerPoint templates.Download and present our Flow Charts PowerPoint Templates because They will Put the wind in your sails. Skim smoothly over the choppy waters of the market. Use our Business PowerPoint Templates because You can Hit the nail on the head with our PowerPoint Templates and Slides. Embed your ideas in the minds of your audience. Download our Marketing PowerPoint Templates because Our PowerPoint Templates and Slides help you meet the demand of the Market. Just browse and pick the slides that appeal to your intuitive senses. Download our Process and Flow PowerPoint Templates because Our PowerPoint Templates and Slides will let Your superior ideas hit the target always and everytime. Present our Shapes PowerPoint Templates because Our PowerPoint Templates and Slides will let you Illuminate the road ahead to Pinpoint the important landmarks along the way.Use these PowerPoint slides for presentations relating to Flow, network, platform, diagram, connection, connect, business, flowchart, function, organization, coordinates, molecular, square, plan, interrelations, scheme, graphic, technology, graph, molecule, arrangement, comparison, scientific, variable, project, relationships, lines,attached, segments, interconnected, solution, organize, device, analyze, draft, pattern, construction, structure, nine, steps. The prominent colors used in the PowerPoint template are Gray, Blue, White.

Concentric Data Flow Process 9 Stages Ppt Business Plan PowerPoint Slides
We present our concentric data flow process 9 stages ppt business plan PowerPoint Slides.Download our Flow Charts PowerPoint Templates because our PowerPoint Templates and Slides are the string of your bow. Fire of your ideas and conquer the podium. Use our Process and Flows PowerPoint Templates because You should Kick up a storm with our PowerPoint Templates and Slides. The heads of your listeners will swirl with your ideas. Download our Marketing PowerPoint Templates because You are working at that stage with an air of royalty. Let our PowerPoint Templates and Slides be the jewels in your crown. Download our Business PowerPoint Templates because You should Bet on your luck with our PowerPoint Templates and Slides. Be assured that you will hit the jackpot. Present our Shapes PowerPoint Templates because You have the co-ordinates for your destination of success. Let our PowerPoint Templates and Slides map out your journey.Use these PowerPoint slides for presentations relating to Flow, network, platform, diagram, connection, connect, business, flowchart, function, organization, coordinates, molecular, square, plan, interrelations, scheme, graphic, technology, graph, molecule, arrangement, comparison, scientific, variable, project, relationships, lines,attached, segments, interconnected, solution, organize, device, analyze, draft, pattern, construction, structure, nine, steps. The prominent colors used in the PowerPoint template are Blue light, White, Gray.
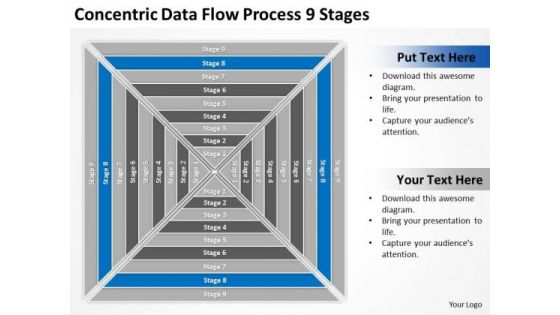
Concentric Data Flow Process 9 Stages Ppt Business Plan PowerPoint Templates
We present our concentric data flow process 9 stages ppt business plan PowerPoint templates.Download our Business PowerPoint Templates because It will get your audience in sync. Present our Flow Charts PowerPoint Templates because Watching this your Audience will Grab their eyeballs, they wont even blink. Use our Process and Flows PowerPoint Templates because Our PowerPoint Templates and Slides will fulfill your every need. Use them and effectively satisfy the desires of your audience. Download and present our Marketing PowerPoint Templates because Our PowerPoint Templates and Slides will let you meet your Deadlines. Use our Shapes PowerPoint Templates because Our PowerPoint Templates and Slides will bullet point your ideas. See them fall into place one by one.Use these PowerPoint slides for presentations relating to Flow, network, platform, diagram, connection, connect, business, flowchart, function, organization, coordinates, molecular, square, plan, interrelations, scheme, graphic, technology, graph, molecule, arrangement, comparison, scientific, variable, project, relationships, lines,attached, segments, interconnected, solution, organize, device, analyze, draft, pattern, construction, structure, nine, steps. The prominent colors used in the PowerPoint template are White, Gray, Blue.

Targeted Marketing Strategic Plan For Audience Engagement Use Of Data In Personalized Marketing Background PDF
This slide showcases use of consumer data which helps organization to formulate personalized marketing campaign. Various benefits include product recommendations, website content, automated emails and retargeting ads. This modern and well arranged Targeted Marketing Strategic Plan For Audience Engagement Use Of Data In Personalized Marketing Background PDF provides lots of creative possibilities. It is very simple to customize and edit with the Powerpoint Software. Just drag and drop your pictures into the shapes. All facets of this template can be edited with Powerpoint no extra software is necessary. Add your own material, put your images in the places assigned for them, adjust the colors, and then you can show your slides to the world, with an animated slide included.
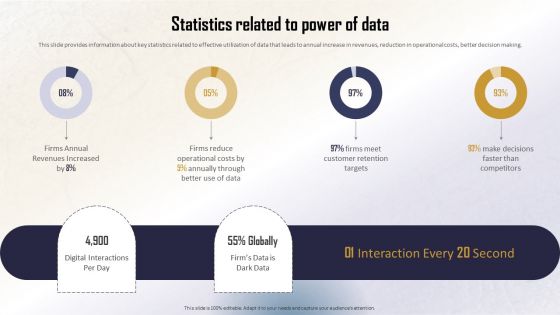
Identifying Direct And Indirect Statistics Related To Power Of Data Download PDF
This slide provides information about key statistics related to effective utilization of data that leads to annual increase in revenues, reduction in operational costs, better decision making. This Identifying Direct And Indirect Statistics Related To Power Of Data Download PDF from Slidegeeks makes it easy to present information on your topic with precision. It provides customization options, so you can make changes to the colors, design, graphics, or any other component to create a unique layout. It is also available for immediate download, so you can begin using it right away. Slidegeeks has done good research to ensure that you have everything you need to make your presentation stand out. Make a name out there for a brilliant performance.

Strategic Market Insight Implementation Guide Overview Of Data Analysis Methods To Gain Logical Insights Themes PDF
This slide outlines various methods used for data analysis to enhance market intelligence and gain relevant insights for effective decision making. It showcases methods such as conjoint analysis, MaxDiff analysis, gap analysis, trend analysis an text and sentiment analysis. Take your projects to the next level with our ultimate collection of Strategic Market Insight Implementation Guide Overview Of Data Analysis Methods To Gain Logical Insights Themes PDF. Slidegeeks has designed a range of layouts that are perfect for representing task or activity duration, keeping track of all your deadlines at a glance. Tailor these designs to your exact needs and give them a truly corporate look with your own brand colors they will make your projects stand out from the rest.
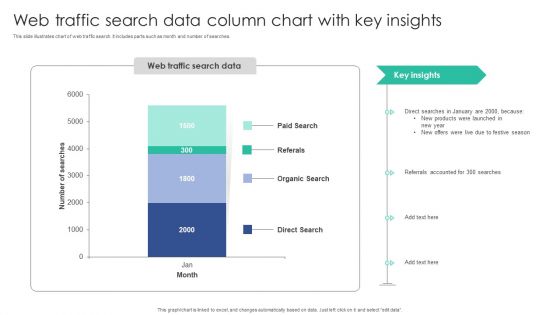
Web Traffic Search Data Column Chart With Key Insights Inspiration PDF
This slide illustrates chart of web traffic search. It includes parts such as month and number of searches.Pitch your topic with ease and precision using this Web Traffic Search Data Column Chart With Key Insights Inspiration PDF. This layout presents information on Organic Search, Referrals Accounted, Products Launched. It is also available for immediate download and adjustment. So, changes can be made in the color, design, graphics or any other component to create a unique layout.
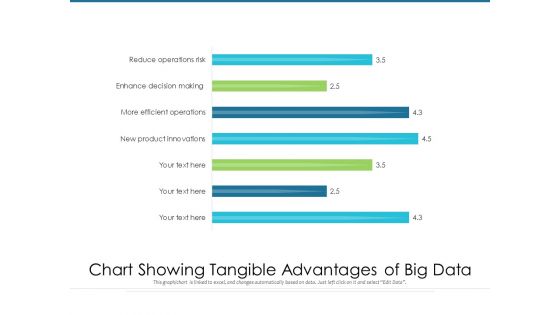
Chart Showing Tangible Advantages Of Big Data Ppt PowerPoint Presentation Infographics Clipart PDF
Pitch your topic with ease and precision using this chart showing tangible advantages of big data ppt powerpoint presentation infographics clipart pdf. This layout presents information on new product innovations, more efficient operations, enhance decision making, reduce operations risk. It is also available for immediate download and adjustment. So, changes can be made in the color, design, graphics or any other component to create a unique layout.

Marketers Guide To Data Analysis And Optimization Ppt PowerPoint Presentation Complete Deck With Slides
With well-researched insights and carefully constructed design, this Marketers Guide To Data Analysis And Optimization Ppt PowerPoint Presentation Complete Deck With Slides is all that you need for your next business meeting with clients and win them over. Add your data to graphs, charts, and tables that are already ready to display it with stunning visuals and help your audience recall your work. With this PPT Complete Deck, you will be able to display your knowledge of the subject as well as your skills as a communicator. Share your ideas and make an impact on the audience with this PowerPoint Layout and ensure that you are known as a presentation professional. Download this PPT Template Bundle to create the most interesting presentation anyone has ever seen.

Data Safety Initiatives For Effective IT Security Threats Administration Table Of Contents Themes PDF
Presenting data safety initiatives for effective it security threats administration table of contents themes pdf to provide visual cues and insights. Share and navigate important information on eight stages that need your due attention. This template can be used to pitch topics like global market insights, gap identification, defining business priorities, about security program, companies digitization levels. In addtion, this PPT design contains high resolution images, graphics, etc, that are easily editable and available for immediate download.
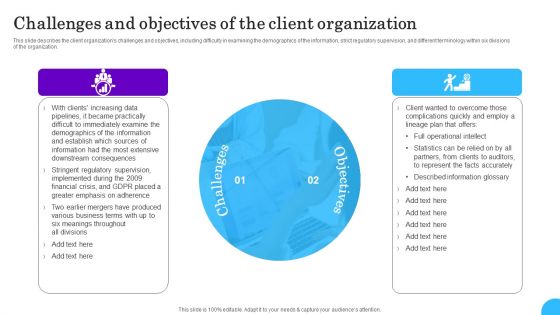
Comprehensive Analysis Of Different Data Lineage Classification Challenges And Objectives Client Themes PDF
This slide describes the client organizations challenges and objectives, including difficulty in examining the demographics of the information, strict regulatory supervision, and different terminology within six divisions of the organization. Get a simple yet stunning designed Comprehensive Analysis Of Different Data Lineage Classification Challenges And Objectives Client Themes PDF. It is the best one to establish the tone in your meetings. It is an excellent way to make your presentations highly effective. So, download this PPT today from Slidegeeks and see the positive impacts. Our easy to edit Comprehensive Analysis Of Different Data Lineage Classification Challenges And Objectives Client Themes PDF can be your go to option for all upcoming conferences and meetings. So, what are you waiting for Grab this template today.

Ml And Big Data In Information Technology Processes Aiops Dashboard To Monitor IT Operations Sample PDF
The following slide highlights the various key performance indicators of the AIOp, these can be problem quick review, cloud and infrastructure and applications health If you are looking for a format to display your unique thoughts, then the professionally designed Ml And Big Data In Information Technology Processes Aiops Dashboard To Monitor IT Operations Sample PDF is the one for you. You can use it as a Google Slides template or a PowerPoint template. Incorporate impressive visuals, symbols, images, and other charts. Modify or reorganize the text boxes as you desire. Experiment with shade schemes and font pairings. Alter, share or cooperate with other people on your work. Download Ml And Big Data In Information Technology Processes Aiops Dashboard To Monitor IT Operations Sample PDF and find out how to give a successful presentation. Present a perfect display to your team and make your presentation unforgettable.

Online Banking System Data Flow Charts Ppt PowerPoint Presentation File Layout Ideas PDF
this slide shows a level 1 dfd of an online banking system to demonstrate the information flows. it covers processes such as account administration system, transaction administration system, online banking system and loan administration system. Persuade your audience using this Online Banking System Data Flow Charts Ppt PowerPoint Presentation File Layout Ideas PDF. This PPT design covers four stages, thus making it a great tool to use. It also caters to a variety of topics including Transaction Administration System, Accountant, Cashier, Employee Record. Download this PPT design now to present a convincing pitch that not only emphasizes the topic but also showcases your presentation skills.

Different Categories Of Data Centers IT Ppt PowerPoint Presentation Complete Deck With Slides
With well-researched insights and carefully-constructed design, this Different Categories Of Data Centers IT Ppt PowerPoint Presentation Complete Deck With Slides is all that you need for your next business meeting with clients and win them over. Add your data to graphs, charts, and tables that are already ready to display it with stunning visuals and help your audience recall your work. With this PPT Complete Deck, you will be able to display your knowledge of the subject as well as your skills as a communicator. Share your ideas and make an impact on the audience with this PowerPoint Layout and ensure that you are known as a presentation professional. Download this PPT Template Bundle to create the most interesting presentation anyone has ever seen.

Ml And Big Data In Information Technology Processes Global Aiops Platform Market By Service Ideas PDF
Purpose of the following slide is to show the global artificial intelligence market by service, it showcases key service areas such as consulting service, training and education, license and maintenance etc. Explore a selection of the finest Ml And Big Data In Information Technology Processes Global Aiops Platform Market By Service Ideas PDF here. With a plethora of professionally designed and pre made slide templates, you can quickly and easily find the right one for your upcoming presentation. You can use our Ml And Big Data In Information Technology Processes Global Aiops Platform Market By Service Ideas PDF to effectively convey your message to a wider audience. Slidegeeks has done a lot of research before preparing these presentation templates. The content can be personalized and the slides are highly editable. Grab templates today from Slidegeeks.
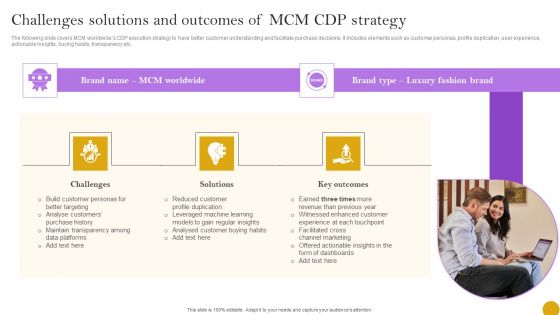
Comprehensive Customer Data Platform Guide Optimizing Promotional Initiatives Challenges Solutions And Outcomes Designs PDF
The following slide covers MCM worldwides CDP execution strategy to have better customer understanding and facilitate purchase decisions. It includes elements such as customer personas, profile duplication, user experience, actionable insights, buying habits, transparency etc. If you are looking for a format to display your unique thoughts, then the professionally designed Comprehensive Customer Data Platform Guide Optimizing Promotional Initiatives Challenges Solutions And Outcomes Designs PDF is the one for you. You can use it as a Google Slides template or a PowerPoint template. Incorporate impressive visuals, symbols, images, and other charts. Modify or reorganize the text boxes as you desire. Experiment with shade schemes and font pairings. Alter, share or cooperate with other people on your work. Download Comprehensive Customer Data Platform Guide Optimizing Promotional Initiatives Challenges Solutions And Outcomes Designs PDF and find out how to give a successful presentation. Present a perfect display to your team and make your presentation unforgettable.
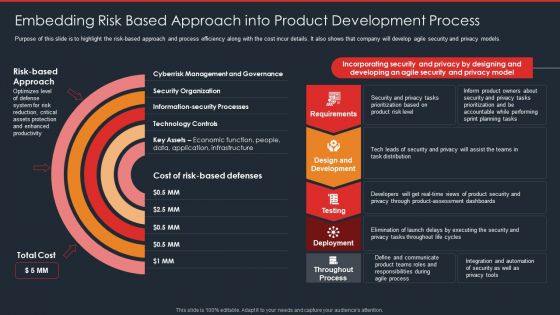
Data Safety Initiatives Embedding Risk Based Approach Into Product Development Process Topics PDF
Purpose of this slide is to highlight the risk-based approach and process efficiency along with the cost incur details. It also shows that company will develop agile security and privacy models. Deliver an awe inspiring pitch with this creative data safety initiatives embedding risk based approach into product development process topics pdf bundle. Topics like requirements, design and development, testing, deployment, throughout process can be discussed with this completely editable template. It is available for immediate download depending on the needs and requirements of the user.
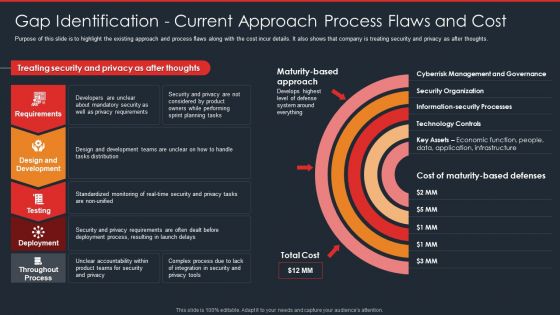
Data Safety Initiatives Gap Identification Current Approach Process Flaws And Cost Ideas PDF
Purpose of this slide is to highlight the existing approach and process flaws along with the cost incur details. It also shows that company is treating security and privacy as after thoughts. Deliver an awe inspiring pitch with this creative data safety initiatives gap identification current approach process flaws and cost ideas pdf bundle. Topics like requirements, design and development, testing, deployment, throughout process can be discussed with this completely editable template. It is available for immediate download depending on the needs and requirements of the user.
About Us Data Driven Promotional Guide To Increase Return On Investment Designs PDF
If you are looking for a format to display your unique thoughts, then the professionally designed About Us Data Driven Promotional Guide To Increase Return On Investment Designs PDF is the one for you. You can use it as a Google Slides template or a PowerPoint template. Incorporate impressive visuals, symbols, images, and other charts. Modify or reorganize the text boxes as you desire. Experiment with shade schemes and font pairings. Alter, share or cooperate with other people on your work. Download About Us Data Driven Promotional Guide To Increase Return On Investment Designs PDF and find out how to give a successful presentation. Present a perfect display to your team and make your presentation unforgettable.
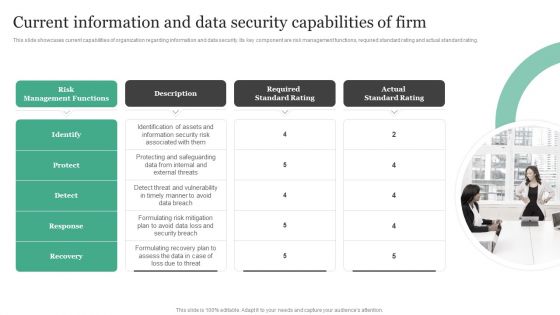
Current Information And Data Security Capabilities Of Firm Information Security Risk Administration Designs PDF
This slide showcases current capabilities of organization regarding information and data security. Its key component are risk management functions, required standard rating and actual standard rating.Do you know about Slidesgeeks Current Information And Data Security Capabilities Of Firm Information Security Risk Administration Designs PDF These are perfect for delivering any kind od presentation. Using it, create PowerPoint presentations that communicate your ideas and engage audiences. Save time and effort by using our pre-designed presentation templates that are perfect for a wide range of topic. Our vast selection of designs covers a range of styles, from creative to business, and are all highly customizable and easy to edit. Download as a PowerPoint template or use them as Google Slides themes.
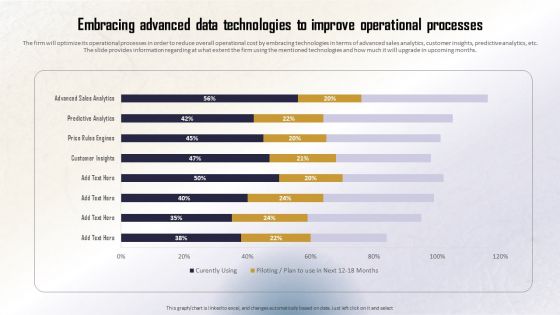
Identifying Direct And Indirect Embracing Advanced Data Technologies To Improve Guidelines PDF
The firm will optimize its operational processes in order to reduce overall operational cost by embracing technologies in terms of advanced sales analytics, customer insights, predictive analytics, etc. The slide provides information regarding at what extent the firm using the mentioned technologies and how much it will upgrade in upcoming months. Formulating a presentation can take up a lot of effort and time, so the content and message should always be the primary focus. The visuals of the PowerPoint can enhance the presenters message, so our Identifying Direct And Indirect Embracing Advanced Data Technologies To Improve Guidelines PDF was created to help save time. Instead of worrying about the design, the presenter can concentrate on the message while our designers work on creating the ideal templates for whatever situation is needed. Slidegeeks has experts for everything from amazing designs to valuable content, we have put everything into Identifying Direct And Indirect Embracing Advanced Data Technologies To Improve Guidelines PDF
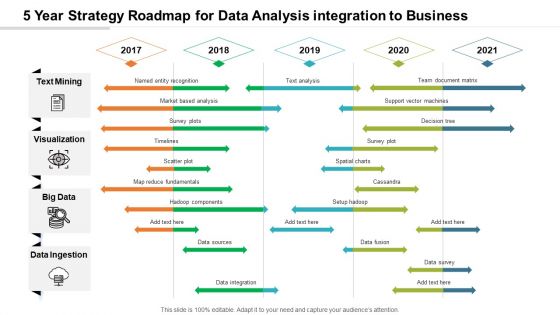
5 Year Strategy Roadmap For Data Analysis Integration To Business Pictures
Introducing our 5 year strategy roadmap for data analysis integration to business pictures. This PPT presentation is Google Slides compatible, therefore, you can share it easily with the collaborators for measuring the progress. Also, the presentation is available in both standard screen and widescreen aspect ratios. So edit the template design by modifying the font size, font type, color, and shapes as per your requirements. As this PPT design is fully editable it can be presented in PDF, JPG and PNG formats.
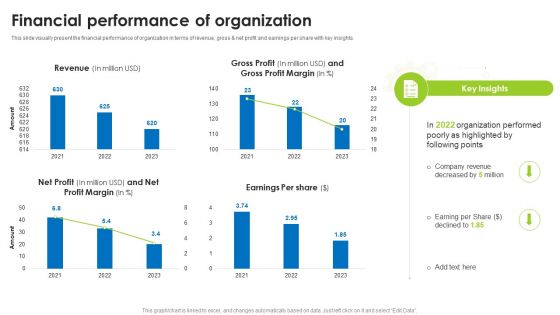
BI Technique For Data Informed Decisions Financial Performance Of Organization Guidelines PDF
This slide visually present the financial performance of organization in terms of revenue, gross and net profit and earnings per share with key insights. If you are looking for a format to display your unique thoughts, then the professionally designed BI Technique For Data Informed Decisions Financial Performance Of Organization Guidelines PDF is the one for you. You can use it as a Google Slides template or a PowerPoint template. Incorporate impressive visuals, symbols, images, and other charts. Modify or reorganize the text boxes as you desire. Experiment with shade schemes and font pairings. Alter, share or cooperate with other people on your work. Download BI Technique For Data Informed Decisions Financial Performance Of Organization Guidelines PDF and find out how to give a successful presentation. Present a perfect display to your team and make your presentation unforgettable.

Half Yearly Development And Strategy Roadmap For Big Data Analysis Ideas
Presenting our innovatively-structured half yearly development and strategy roadmap for big data analysis ideas Template. Showcase your roadmap process in different formats like PDF, PNG, and JPG by clicking the download button below. This PPT design is available in both Standard Screen and Widescreen aspect ratios. It can also be easily personalized and presented with modified font size, font type, color, and shapes to measure your progress in a clear way.
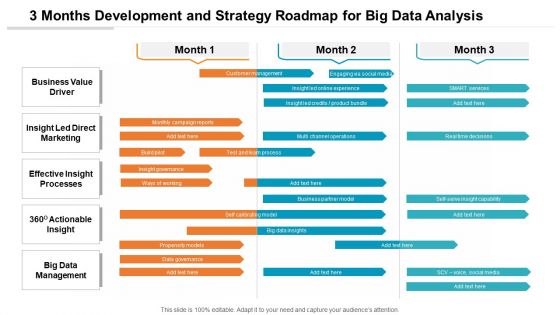
3 Months Development And Strategy Roadmap For Big Data Analysis Background
Presenting our innovatively-structured 3 months development and strategy roadmap for big data analysis background Template. Showcase your roadmap process in different formats like PDF, PNG, and JPG by clicking the download button below. This PPT design is available in both Standard Screen and Widescreen aspect ratios. It can also be easily personalized and presented with modified font size, font type, color, and shapes to measure your progress in a clear way.

5 Year Development And Strategy Roadmap For Big Data Analysis Elements
Presenting our innovatively-structured 5 year development and strategy roadmap for big data analysis elements Template. Showcase your roadmap process in different formats like PDF, PNG, and JPG by clicking the download button below. This PPT design is available in both Standard Screen and Widescreen aspect ratios. It can also be easily personalized and presented with modified font size, font type, color, and shapes to measure your progress in a clear way.

6 Months Development And Strategy Roadmap For Big Data Analysis Graphics
Presenting our innovatively-structured 6 months development and strategy roadmap for big data analysis graphics Template. Showcase your roadmap process in different formats like PDF, PNG, and JPG by clicking the download button below. This PPT design is available in both Standard Screen and Widescreen aspect ratios. It can also be easily personalized and presented with modified font size, font type, color, and shapes to measure your progress in a clear way.
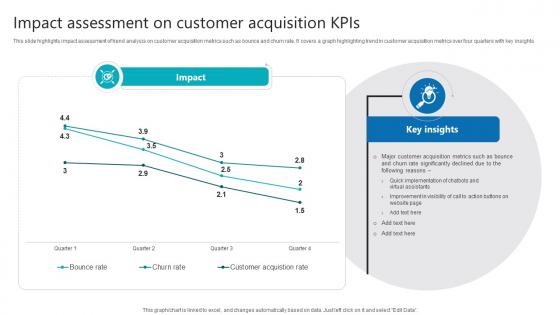
Impact Assessment On Customer Acquisition Kpis Product Analytics Implementation Data Analytics V
This slide highlights impact assessment of trend analysis on customer acquisition metrics such as bounce and churn rate. It covers a graph highlighting trend in customer acquisition metrics over four quarters with key insights The Impact Assessment On Customer Acquisition Kpis Product Analytics Implementation Data Analytics V is a compilation of the most recent design trends as a series of slides. It is suitable for any subject or industry presentation, containing attractive visuals and photo spots for businesses to clearly express their messages. This template contains a variety of slides for the user to input data, such as structures to contrast two elements, bullet points, and slides for written information. Slidegeeks is prepared to create an impression.

5 Steps Of Data Protection Regulations Ppt PowerPoint Presentation Summary Themes PDF
Persuade your audience using this 5 steps of data protection regulations ppt powerpoint presentation summary themes pdf. This PPT design covers five stages, thus making it a great tool to use. It also caters to a variety of topics including planning strategy, awareness, assessment audit, execute plan, evaluating and managing. Download this PPT design now to present a convincing pitch that not only emphasizes the topic but also showcases your presentation skills.

Financial Data Revelation To Varied Stakeholders Business Performance And Financial Highlights Designs PDF
This slide shows the business performance and financial highlights such as gross revenue, net revenue, gross margin, etc. If you are looking for a format to display your unique thoughts, then the professionally designed Financial Data Revelation To Varied Stakeholders Business Performance And Financial Highlights Designs PDF is the one for you. You can use it as a Google Slides template or a PowerPoint template. Incorporate impressive visuals, symbols, images, and other charts. Modify or reorganize the text boxes as you desire. Experiment with shade schemes and font pairings. Alter, share or cooperate with other people on your work. Download Financial Data Revelation To Varied Stakeholders Business Performance And Financial Highlights Designs PDF and find out how to give a successful presentation. Present a perfect display to your team and make your presentation unforgettable.
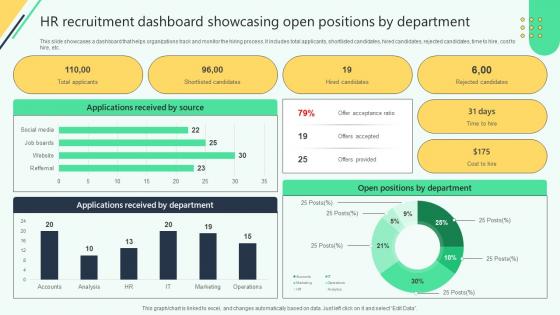
Hr Recruitment Dashboard Showcasing Open Positions By Analysing Hr Data For Effective Decision Making
This slide showcases a dashboard that helps organizations track and monitor the hiring process. It includes total applicants, shortlisted candidates, hired candidates, rejected candidates, time to hire, cost to hire, etc. The Hr Recruitment Dashboard Showcasing Open Positions By Analysing Hr Data For Effective Decision Making is a compilation of the most recent design trends as a series of slides. It is suitable for any subject or industry presentation, containing attractive visuals and photo spots for businesses to clearly express their messages. This template contains a variety of slides for the user to input data, such as structures to contrast two elements, bullet points, and slides for written information. Slidegeeks is prepared to create an impression.
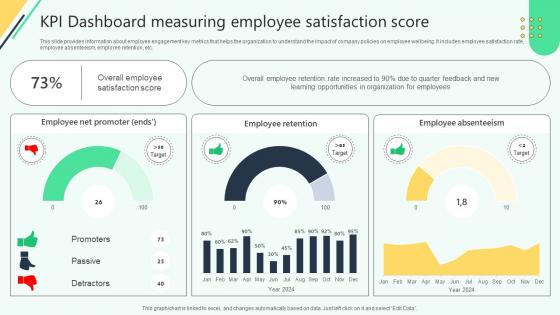
Kpi Dashboard Measuring Employee Satisfaction Score Analysing Hr Data For Effective Decision Making
This slide provides information about employee engagement key metrics that helps the organization to understand the impact of company policies on employee wellbeing. It includes employee satisfaction rate, employee absenteeism, employee retention, etc. Create an editable Kpi Dashboard Measuring Employee Satisfaction Score Analysing Hr Data For Effective Decision Making that communicates your idea and engages your audience. Whether you are presenting a business or an educational presentation, pre-designed presentation templates help save time. Kpi Dashboard Measuring Employee Satisfaction Score Analysing Hr Data For Effective Decision Making is highly customizable and very easy to edit, covering many different styles from creative to business presentations. Slidegeeks has creative team members who have crafted amazing templates. So, go and get them without any delay.
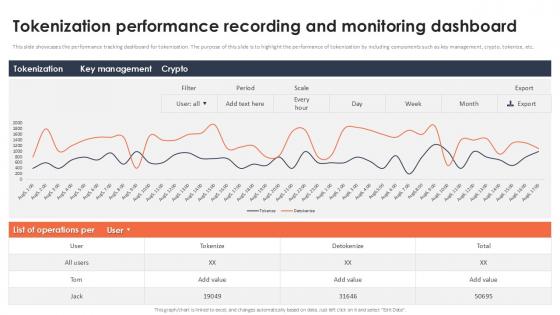
Tokenization Performance Recording And Monitoring Dashboard Securing Your Data Ppt Slide
This slide showcases the performance tracking dashboard for tokenization. The purpose of this slide is to highlight the performance of tokenization by including components such as key management, crypto, tokenize, etc. Do you have an important presentation coming up Are you looking for something that will make your presentation stand out from the rest Look no further than Tokenization Performance Recording And Monitoring Dashboard Securing Your Data Ppt Slide With our professional designs, you can trust that your presentation will pop and make delivering it a smooth process. And with Slidegeeks, you can trust that your presentation will be unique and memorable. So why wait Grab Tokenization Performance Recording And Monitoring Dashboard Securing Your Data Ppt Slide today and make your presentation stand out from the rest
Five Stages Of Data Transfer Process With Icons Ppt PowerPoint Presentation Icon Infographic Template PDF
Persuade your audience using this five stages of data transfer process with icons ppt powerpoint presentation icon infographic template pdf. This PPT design covers five stages, thus making it a great tool to use. It also caters to a variety of topics including assess, optimize, application. Download this PPT design now to present a convincing pitch that not only emphasizes the topic but also showcases your presentation skills.
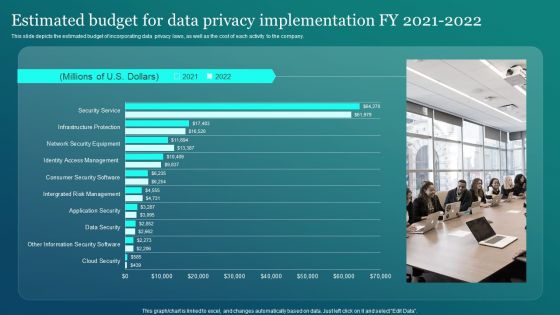
Information Security Estimated Budget For Data Privacy Implementation Fy 2021 2022 Graphics PDF
This slide depicts the estimated budget of incorporating data privacy laws, as well as the cost of each activity to the company. This Information Security Estimated Budget For Data Privacy Implementation Fy 2021 2022 Graphics PDF from Slidegeeks makes it easy to present information on your topic with precision. It provides customization options, so you can make changes to the colors, design, graphics, or any other component to create a unique layout. It is also available for immediate download, so you can begin using it right away. Slidegeeks has done good research to ensure that you have everything you need to make your presentation stand out. Make a name out there for a brilliant performance.

Strategic Market Insight Implementation Guide Data Evaluation Sample With Conjoint Analysis Background PDF
The following slide showcases sample of data assessment with conjoint analysis method to compare features and identify value. It outlines key components such as attribute, level, all responses and comments. Slidegeeks is here to make your presentations a breeze with Strategic Market Insight Implementation Guide Data Evaluation Sample With Conjoint Analysis Background PDF With our easy to use and customizable templates, you can focus on delivering your ideas rather than worrying about formatting. With a variety of designs to choose from, you are sure to find one that suits your needs. And with animations and unique photos, illustrations, and fonts, you can make your presentation pop. So whether you are giving a sales pitch or presenting to the board, make sure to check out Slidegeeks first.
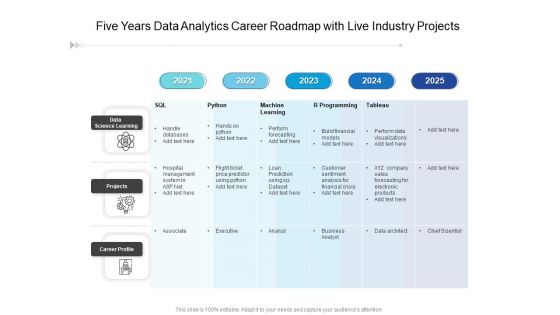
Five Years Data Analytics Career Roadmap With Live Industry Projects Portrait
Presenting our jaw-dropping five years data analytics career roadmap with live industry projects portrait. You can alternate the color, font size, font type, and shapes of this PPT layout according to your strategic process. This PPT presentation is compatible with Google Slides and is available in both standard screen and widescreen aspect ratios. You can also download this well-researched PowerPoint template design in different formats like PDF, JPG, and PNG. So utilize this visually-appealing design by clicking the download button given below.

 Home
Home