Data Analytics Team

Centralized Data Analytics Team Structure Clipart PDF
This slide shows the model representing the structure of the centralized data analytics team. It includes key stakeholders such as vice president, centralized data analytics team, and analysts of units A,B and C.Persuade your audience using this Centralized Data Analytics Team Structure Clipart PDF. This PPT design coversone stage, thus making it a great tool to use. It also caters to a variety of topics including Vice President, Data Analytics, Analytics Team. Download this PPT design now to present a convincing pitch that not only emphasizes the topic but also showcases your presentation skills.

Data Analytics Team Cost Structure One Pager Sample Example Document
Presenting you an exemplary Data Analytics Team Cost Structure One Pager Sample Example Document. Our one-pager comprises all the must-have essentials of an inclusive document. You can edit it with ease, as its layout is completely editable. With such freedom, you can tweak its design and other elements to your requirements. Download this Data Analytics Team Cost Structure One Pager Sample Example Document brilliant piece now.
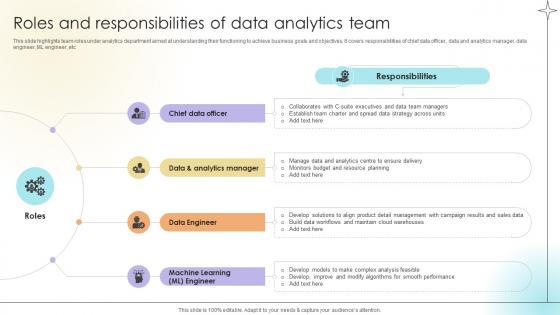
Roles And Responsibilities Of Data Analytics Team Data Analytics SS V
This slide highlights team roles under analytics department aimed at understanding their functioning to achieve business goals and objectives. It covers responsibilities of chief data officer, data and analytics manager, data engineer, ML engineer, etc.This Roles And Responsibilities Of Data Analytics Team Data Analytics SS V from Slidegeeks makes it easy to present information on your topic with precision. It provides customization options, so you can make changes to the colors, design, graphics, or any other component to create a unique layout. It is also available for immediate download, so you can begin using it right away. Slidegeeks has done good research to ensure that you have everything you need to make your presentation stand out. Make a name out there for a brilliant performance.
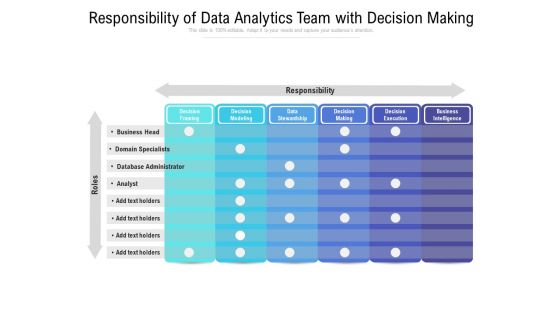
Responsibility Of Data Analytics Team With Decision Making Ppt PowerPoint Presentation File Outfit PDF
Pitch your topic with ease and precision using this responsibility of data analytics team with decision making ppt powerpoint presentation file outfit pdf. This layout presents information on business head, domain specialists, database administrator, analyst, responsibility. It is also available for immediate download and adjustment. So, changes can be made in the color, design, graphics or any other component to create a unique layout.

Product Data Analytics Benefits On Teams Performance Mockup Pdf
This slide presents the benefits of product data analytics on various teams for performance enhancement. This includes teams like leadership team, marketing team, engineering team, design team, etc. Pitch your topic with ease and precision using this Product Data Analytics Benefits On Teams Performance Mockup Pdf. This layout presents information on Leadership, Marketing, Customer Success. It is also available for immediate download and adjustment. So, changes can be made in the color, design, graphics or any other component to create a unique layout.

Core Team Big Data Analytics Investor Funding Elevator Pitch Deck
This slide provides information regarding key leaders involved in investment decisions. Some of the designations include founder and chief executive officer, chief operating officer, vice president of sales, and vice president of operations. Do you have to make sure that everyone on your team knows about any specific topic I yes, then you should give Core Team Big Data Analytics Investor Funding Elevator Pitch Deck a try. Our experts have put a lot of knowledge and effort into creating this impeccable Core Team Big Data Analytics Investor Funding Elevator Pitch Deck. You can use this template for your upcoming presentations, as the slides are perfect to represent even the tiniest detail. You can download these templates from the Slidegeeks website and these are easy to edit. So grab these today
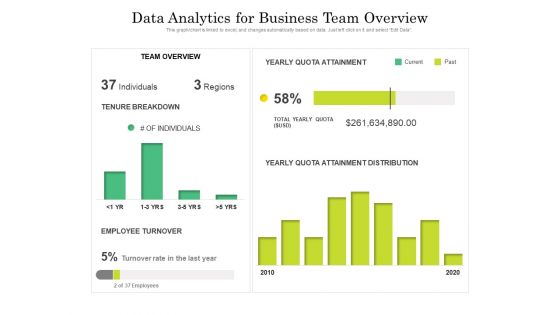
data analytics for business team overview ppt powerpoint presentation outline infographics pdf
Presenting this set of slides with name data analytics for business team overview ppt powerpoint presentation outline infographics pdf. The topics discussed in these slides are team overview, yearly quota attainment, individuals regions, tenure breakdown, employee turnover, yearly quota attainment distribution. This is a completely editable PowerPoint presentation and is available for immediate download. Download now and impress your audience.
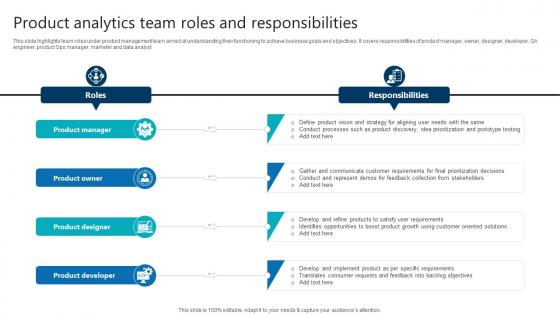
Product Analytics Team Roles And Responsibilities Product Analytics Implementation Data Analytics V
This slide highlights team roles under product management team aimed at understanding their functioning to achieve business goals and objectives. It covers responsibilities of product manager, owner, designer, developer, QA engineer, product Ops manager, marketer and data analyst From laying roadmaps to briefing everything in detail, our templates are perfect for you. You can set the stage with your presentation slides. All you have to do is download these easy-to-edit and customizable templates. Product Analytics Team Roles And Responsibilities Product Analytics Implementation Data Analytics V will help you deliver an outstanding performance that everyone would remember and praise you for. Do download this presentation today.
Toolkit For Data Science And Analytics Transition Meet Our Team Portrait PDF
This modern and well arranged Toolkit For Data Science And Analytics Transition Meet Our Team Portrait PDF provides lots of creative possibilities. It is very simple to customize and edit with the Powerpoint Software. Just drag and drop your pictures into the shapes. All facets of this template can be edited with Powerpoint no extra software is necessary. Add your own material, put your images in the places assigned for them, adjust the colors, and then you can show your slides to the world, with an animated slide included.
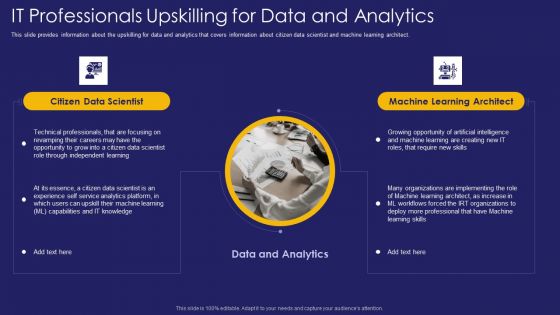
Role IT Team Digital Transformation It Professionals Upskilling For Data And Analytics Structure PDF
This slide provides information about the upskilling for data and analytics that covers information about citizen data scientist and machine learning architect. This is a role it team digital transformation it professionals upskilling for data and analytics structure pdf template with various stages. Focus and dispense information on two stages using this creative set, that comes with editable features. It contains large content boxes to add your information on topics like data, independent, learning. You can also showcase facts, figures, and other relevant content using this PPT layout. Grab it now.
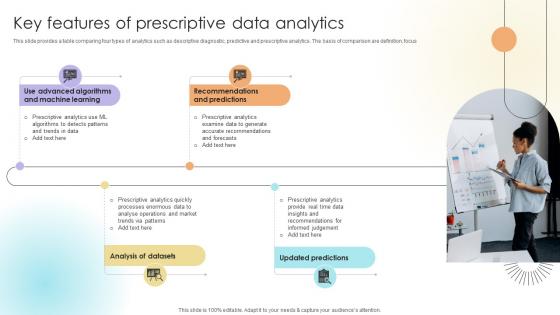
Key Features Of Prescriptive Data Analytics Data Analytics SS V
This slide provides a table comparing four types of analytics such as descriptive diagnostic, predictive and prescriptive analytics. The basis of comparison are definition, focus.Present like a pro with Key Features Of Prescriptive Data Analytics Data Analytics SS V. Create beautiful presentations together with your team, using our easy-to-use presentation slides. Share your ideas in real-time and make changes on the fly by downloading our templates. So whether you are in the office, on the go, or in a remote location, you can stay in sync with your team and present your ideas with confidence. With Slidegeeks presentation got a whole lot easier. Grab these presentations today.

Prescriptive Analytics Training Plan For Employees Data Analytics SS V
This slide outlines training plan aimed at helping employees learn the basics of prescriptive analytics to streamline its usage in the business enterprises. It covers details on training module, mode of training, training time slots with trainer name.Slidegeeks has constructed Prescriptive Analytics Training Plan For Employees Data Analytics SS V after conducting extensive research and examination. These presentation templates are constantly being generated and modified based on user preferences and critiques from editors. Here, you will find the most attractive templates for a range of purposes while taking into account ratings and remarks from users regarding the content. This is an excellent jumping-off point to explore our content and will give new users an insight into our top-notch PowerPoint Templates.
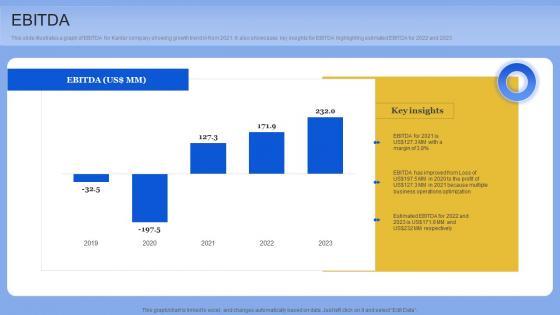
Ebitda Data Analytics Company Outline Topics PDF
This slide illustrates a graph of EBITDA for Kantar company showing growth trend in from 2021. It also showcases key insights for EBITDA highlighting estimated EBITDA for 2022 and 2023. Present like a pro with Ebitda Data Analytics Company Outline Topics PDF Create beautiful presentations together with your team, using our easy-to-use presentation slides. Share your ideas in real-time and make changes on the fly by downloading our templates. So whether you are in the office, on the go, or in a remote location, you can stay in sync with your team and present your ideas with confidence. With Slidegeeks presentation got a whole lot easier. Grab these presentations today.

Toolkit For Data Science And Analytics Transition Communication Best Practices For Data Analytics Project Summary PDF
This slide highlights the communication plan for translating the data analytics activities to team members with formal channel and frequency. Do you know about Slidesgeeks Toolkit For Data Science And Analytics Transition Communication Best Practices For Data Analytics Project Summary PDF These are perfect for delivering any kind od presentation. Using it, create PowerPoint presentations that communicate your ideas and engage audiences. Save time and effort by using our pre designed presentation templates that are perfect for a wide range of topic. Our vast selection of designs covers a range of styles, from creative to business, and are all highly customizable and easy to edit. Download as a PowerPoint template or use them as Google Slides themes.

Core Team Analytics Company Investor Funding Elevator
This slide represents core management team of analytics company. It includes CEO, Technology manager, and marketing manager.Formulating a presentation can take up a lot of effort and time, so the content and message should always be the primary focus. The visuals of the PowerPoint can enhance the presenters message, so our Core Team Analytics Company Investor Funding Elevator was created to help save time. Instead of worrying about the design, the presenter can concentrate on the message while our designers work on creating the ideal templates for whatever situation is needed. Slidegeeks has experts for everything from amazing designs to valuable content, we have put everything into Core Team Analytics Company Investor Funding Elevator.
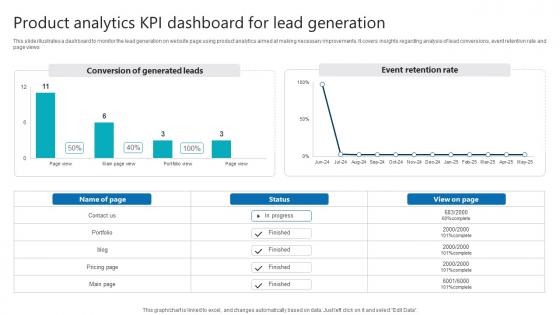
Product Analytics KPI Dashboard For Lead Generation Product Analytics Implementation Data Analytics V
This slide illustrates a dashboard to monitor the lead generation on website page using product analytics aimed at making necessary improvements. It covers insights regarding analysis of lead conversions, event retention rate and page views.Do you have to make sure that everyone on your team knows about any specific topic I yes, then you should give Product Analytics KPI Dashboard For Lead Generation Product Analytics Implementation Data Analytics V a try. Our experts have put a lot of knowledge and effort into creating this impeccable Product Analytics KPI Dashboard For Lead Generation Product Analytics Implementation Data Analytics V. You can use this template for your upcoming presentations, as the slides are perfect to represent even the tiniest detail. You can download these templates from the Slidegeeks website and these are easy to edit. So grab these today

Brief Overview Of Product Analytics Techniques Product Analytics Implementation Data Analytics V
This slide provides an overview of product analytics techniques aimed at identifying crucial patterns in data to make decisions. It covers trend, journey, attribution, retention and cohort analysis with uses.Do you have to make sure that everyone on your team knows about any specific topic I yes, then you should give Brief Overview Of Product Analytics Techniques Product Analytics Implementation Data Analytics V a try. Our experts have put a lot of knowledge and effort into creating this impeccable Brief Overview Of Product Analytics Techniques Product Analytics Implementation Data Analytics V. You can use this template for your upcoming presentations, as the slides are perfect to represent even the tiniest detail. You can download these templates from the Slidegeeks website and these are easy to edit. So grab these today

Recommendations To Improve Product Analytics Implementation Product Analytics Implementation Data Analytics V
This slide outlines key practices to implement product analytics aimed at helping teams move with agility and make informed decisions. It covers cross functional collaboration, prioritize data management, implement data governance, integrations, etc Find highly impressive Recommendations To Improve Product Analytics Implementation Product Analytics Implementation Data Analytics V on Slidegeeks to deliver a meaningful presentation. You can save an ample amount of time using these presentation templates. No need to worry to prepare everything from scratch because Slidegeeks experts have already done a huge research and work for you. You need to download Recommendations To Improve Product Analytics Implementation Product Analytics Implementation Data Analytics V for your upcoming presentation. All the presentation templates are 100 percent editable and you can change the color and personalize the content accordingly. Download now

Product Analytics Training Plan For Employees Product Analytics Implementation Data Analytics V
This slide outlines training plan aimed at helping employees learn the basics of product analytics to streamline its usage in the business enterprises. It covers details on training module, mode of training, training time slots with trainer name.Whether you have daily or monthly meetings, a brilliant presentation is necessary. Product Analytics Training Plan For Employees Product Analytics Implementation Data Analytics V can be your best option for delivering a presentation. Represent everything in detail using Product Analytics Training Plan For Employees Product Analytics Implementation Data Analytics V and make yourself stand out in meetings. The template is versatile and follows a structure that will cater to your requirements. All the templates prepared by Slidegeeks are easy to download and edit. Our research experts have taken care of the corporate themes as well. So, give it a try and see the results.
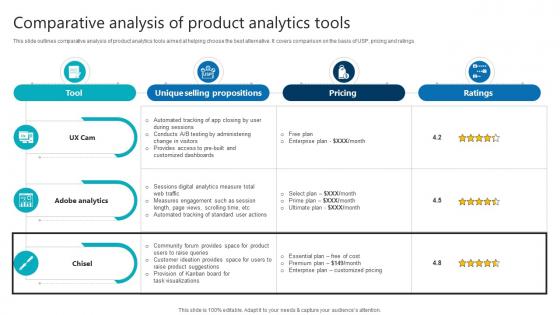
Comparative Analysis Of Product Analytics Tools Product Analytics Implementation Data Analytics V
This slide outlines comparative analysis of product analytics tools aimed at helping choose the best alternative. It covers comparison on the basis of USP, pricing and ratings If your project calls for a presentation, then Slidegeeks is your go-to partner because we have professionally designed, easy-to-edit templates that are perfect for any presentation. After downloading, you can easily edit Comparative Analysis Of Product Analytics Tools Product Analytics Implementation Data Analytics V and make the changes accordingly. You can rearrange slides or fill them with different images. Check out all the handy templates
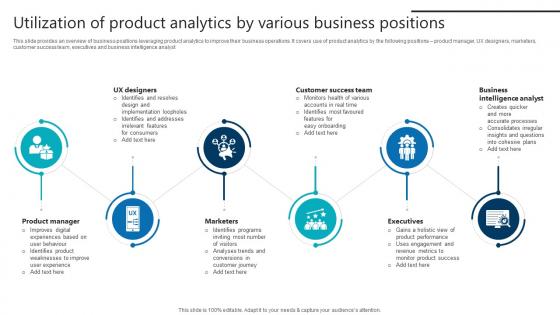
Utilization Of Product Analytics By Various Business Product Analytics Implementation Data Analytics V
This slide provides an overview of business positions leveraging product analytics to improve their business operations. It covers use of product analytics by the following positions product manager, UX designers, marketers, customer success team, executives and business intelligence analyst Retrieve professionally designed Utilization Of Product Analytics By Various Business Product Analytics Implementation Data Analytics V to effectively convey your message and captivate your listeners. Save time by selecting pre-made slideshows that are appropriate for various topics, from business to educational purposes. These themes come in many different styles, from creative to corporate, and all of them are easily adjustable and can be edited quickly. Access them as PowerPoint templates or as Google Slides themes. You do not have to go on a hunt for the perfect presentation because Slidegeeks got you covered from everywhere.
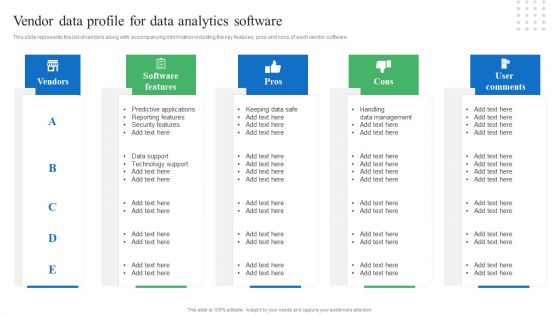
Toolkit For Data Science And Analytics Transition Vendor Data Profile For Data Analytics Software Infographics PDF
This slide represents the list of vendors along with accompanying information including the key features, pros and cons of each vendor software. If your project calls for a presentation, then Slidegeeks is your go to partner because we have professionally designed, easy to edit templates that are perfect for any presentation. After downloading, you can easily edit Toolkit For Data Science And Analytics Transition Vendor Data Profile For Data Analytics Software Infographics PDF and make the changes accordingly. You can rearrange slides or fill them with different images. Check out all the handy templates.

Big Data Analytics Lifecycle What Is Big Data Analytics Ppt Layouts Portrait PDF
This slide represents the meaning of big data and the complete data handling process such as data collection, storage, research, analysis, visualization, volume, and network. Present like a pro with Big Data Analytics Lifecycle What Is Big Data Analytics Ppt Layouts Portrait PDF Create beautiful presentations together with your team, using our easy-to-use presentation slides. Share your ideas in real-time and make changes on the fly by downloading our templates. So whether youre in the office, on the go, or in a remote location, you can stay in sync with your team and present your ideas with confidence. With Slidegeeks presentation got a whole lot easier. Grab these presentations today.

Toolkit For Data Science And Analytics Transition Data Analytics Project Plan Designs PDF
This slide shows the data analytics lifecycle covering multiple stages starting from presenting the business case to data identification, data validation, analysis and ending at data visualization and utilization of results. Present like a pro with Toolkit For Data Science And Analytics Transition Data Analytics Project Plan Designs PDF Create beautiful presentations together with your team, using our easy to use presentation slides. Share your ideas in real time and make changes on the fly by downloading our templates. So whether you are in the office, on the go, or in a remote location, you can stay in sync with your team and present your ideas with confidence. With Slidegeeks presentation got a whole lot easier. Grab these presentations today.
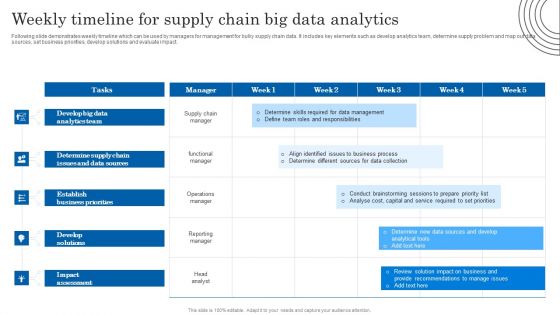
Weekly Timeline For Supply Chain Big Data Analytics Introduction PDF
Following slide demonstrates weekly timeline which can be used by managers for management for bulky supply chain data. It includes key elements such as develop analytics team, determine supply problem and map out data sources, set business priorities, develop solutions and evaluate impact. Pitch your topic with ease and precision using this Weekly Timeline For Supply Chain Big Data Analytics Introduction PDF. This layout presents information on Determine Supply Chain, Data Sources, Analytics Team. It is also available for immediate download and adjustment. So, changes can be made in the color, design, graphics or any other component to create a unique layout.
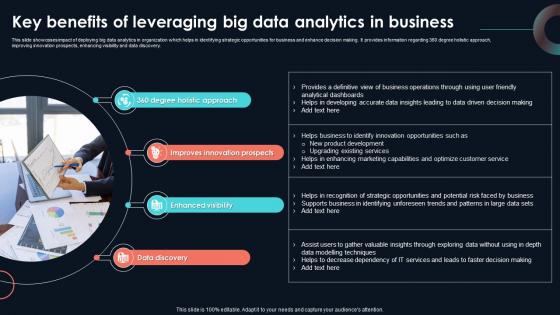
Key Benefits Of Leveraging Big Data Analytics Developing Strategic Insights Using Big Data Analytics SS V
This slide showcases impact of deploying big data analytics in organization which helps in identifying strategic opportunities for business and enhance decision making. It provides information regarding 360 degree holistic approach, improving innovation prospects, enhancing visibility and data discovery. Do you have to make sure that everyone on your team knows about any specific topic I yes, then you should give Key Benefits Of Leveraging Big Data Analytics Developing Strategic Insights Using Big Data Analytics SS V a try. Our experts have put a lot of knowledge and effort into creating this impeccable Key Benefits Of Leveraging Big Data Analytics Developing Strategic Insights Using Big Data Analytics SS V. You can use this template for your upcoming presentations, as the slides are perfect to represent even the tiniest detail. You can download these templates from the Slidegeeks website and these are easy to edit. So grab these today
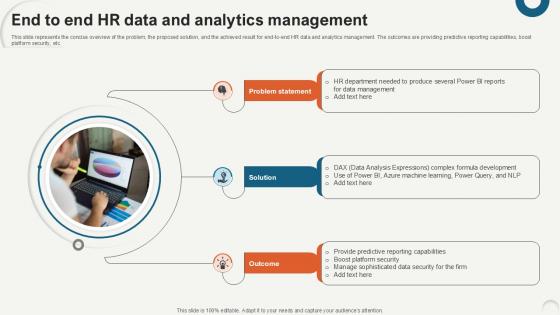
End To End HR Data And Analytics Data Analytics For Informed Decision Ppt Sample
This slide represents the concise overview of the problem, the proposed solution, and the achieved result for end-to-end HR data and analytics management. The outcomes are providing predictive reporting capabilities, boost platform security, etc. If you are looking for a format to display your unique thoughts, then the professionally designed End To End HR Data And Analytics Data Analytics For Informed Decision Ppt Sample is the one for you. You can use it as a Google Slides template or a PowerPoint template. Incorporate impressive visuals, symbols, images, and other charts. Modify or reorganize the text boxes as you desire. Experiment with shade schemes and font pairings. Alter, share or cooperate with other people on your work. Download End To End HR Data And Analytics Data Analytics For Informed Decision Ppt Sample and find out how to give a successful presentation. Present a perfect display to your team and make your presentation unforgettable.

Big Data Analytics Implementation In Developing Strategic Insights Using Big Data Analytics SS V
This slide provides an overview of implementing big data analytics in health industry which helps in improving health outcomes. It includes elements such as clinical decision making, effective healthcare operations, resource allocation etc. If you are looking for a format to display your unique thoughts, then the professionally designed Big Data Analytics Implementation In Developing Strategic Insights Using Big Data Analytics SS V is the one for you. You can use it as a Google Slides template or a PowerPoint template. Incorporate impressive visuals, symbols, images, and other charts. Modify or reorganize the text boxes as you desire. Experiment with shade schemes and font pairings. Alter, share or cooperate with other people on your work. Download Big Data Analytics Implementation In Developing Strategic Insights Using Big Data Analytics SS V and find out how to give a successful presentation. Present a perfect display to your team and make your presentation unforgettable.
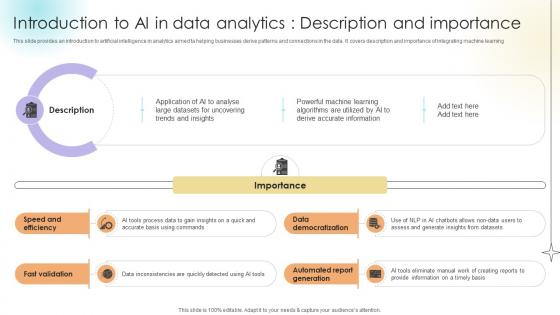
Introduction To Ai In Data Analytics Description And Importance Data Analytics SS V
This slide provides an introduction to artificial intelligence in analytics aimed ta helping businesses derive patterns and connections in the data. It covers description and importance of integrating machine learning.Create an editable Introduction To Ai In Data Analytics Description And Importance Data Analytics SS V that communicates your idea and engages your audience. Whether you are presenting a business or an educational presentation, pre-designed presentation templates help save time. Introduction To Ai In Data Analytics Description And Importance Data Analytics SS V is highly customizable and very easy to edit, covering many different styles from creative to business presentations. Slidegeeks has creative team members who have crafted amazing templates. So, go and get them without any delay.
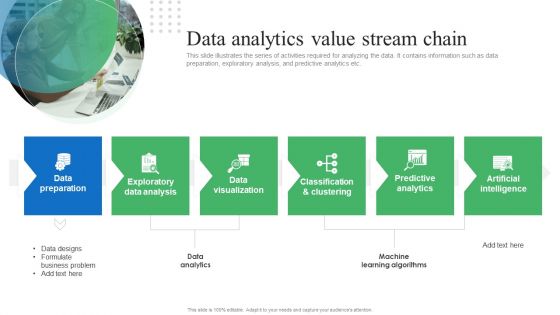
Toolkit For Data Science And Analytics Transition Data Analytics Value Stream Chain Pictures PDF
This slide illustrates the series of activities required for analyzing the data. It contains information such as data preparation, exploratory analysis, and predictive analytics etc. If you are looking for a format to display your unique thoughts, then the professionally designed Toolkit For Data Science And Analytics Transition Data Analytics Value Stream Chain Pictures PDF is the one for you. You can use it as a Google Slides template or a PowerPoint template. Incorporate impressive visuals, symbols, images, and other charts. Modify or reorganize the text boxes as you desire. Experiment with shade schemes and font pairings. Alter, share or cooperate with other people on your work. Download Toolkit For Data Science And Analytics Transition Data Analytics Value Stream Chain Pictures PDF and find out how to give a successful presentation. Present a perfect display to your team and make your presentation unforgettable.
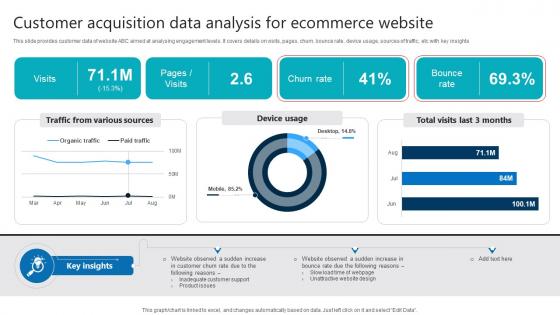
Customer Acquisition Data Analysis For Ecommerce Website Product Analytics Implementation Data Analytics V
This slide provides customer data of website ABC aimed at analysing engagement levels. It covers details on visits, pages, churn, bounce rate, device usage, sources of traffic, etc with key insights If you are looking for a format to display your unique thoughts, then the professionally designed Customer Acquisition Data Analysis For Ecommerce Website Product Analytics Implementation Data Analytics V is the one for you. You can use it as a Google Slides template or a PowerPoint template. Incorporate impressive visuals, symbols, images, and other charts. Modify or reorganize the text boxes as you desire. Experiment with shade schemes and font pairings. Alter, share or cooperate with other people on your work. Download Customer Acquisition Data Analysis For Ecommerce Website Product Analytics Implementation Data Analytics V and find out how to give a successful presentation. Present a perfect display to your team and make your presentation unforgettable.

Toolkit For Data Science And Analytics Transition Business Requirements For Data Analytics Project Designs PDF
The slide specifies the key requirements for data analytics project covering the business, data, application and technology aspects. Do you have to make sure that everyone on your team knows about any specific topic I yes, then you should give Toolkit For Data Science And Analytics Transition Business Requirements For Data Analytics Project Designs PDF a try. Our experts have put a lot of knowledge and effort into creating this impeccable Toolkit For Data Science And Analytics Transition Business Requirements For Data Analytics Project Designs PDF. You can use this template for your upcoming presentations, as the slides are perfect to represent even the tiniest detail. You can download these templates from the Slidegeeks website and these are easy to edit. So grab these today.
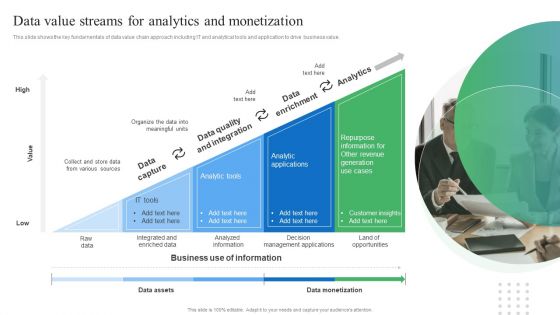
Toolkit For Data Science And Analytics Transition Data Value Streams For Analytics And Monetization Formats PDF
This slide shows the key fundamentals of data value chain approach including IT and analytical tools and application to drive business value. Present like a pro with Toolkit For Data Science And Analytics Transition Data Value Streams For Analytics And Monetization Formats PDF Create beautiful presentations together with your team, using our easy to use presentation slides. Share your ideas in real time and make changes on the fly by downloading our templates. So whether you are in the office, on the go, or in a remote location, you can stay in sync with your team and present your ideas with confidence. With Slidegeeks presentation got a whole lot easier. Grab these presentations today.

Toolkit For Data Science And Analytics Transition Data Analytics Software Features Inspiration PDF
This slide represents the key features of predictive data analytics including data mining, data visualization, and modelling etc. Do you have to make sure that everyone on your team knows about any specific topic I yes, then you should give Toolkit For Data Science And Analytics Transition Data Analytics Software Features Inspiration PDF a try. Our experts have put a lot of knowledge and effort into creating this impeccable Toolkit For Data Science And Analytics Transition Data Analytics Software Features Inspiration PDF. You can use this template for your upcoming presentations, as the slides are perfect to represent even the tiniest detail. You can download these templates from the Slidegeeks website and these are easy to edit. So grab these today.

Toolkit For Data Science And Analytics Transition Communication Plan For Data Analytics Program Designs PDF
This slide shows the key components of communication plan to keep the team members informed about the project deliverables. It covers information such as project owners, delivery method, key schedules and source of message. There are so many reasons you need a Toolkit For Data Science And Analytics Transition Communication Plan For Data Analytics Program Designs PDF. The first reason is you can not spend time making everything from scratch, Thus, Slidegeeks has made presentation templates for you too. You can easily download these templates from our website easily.
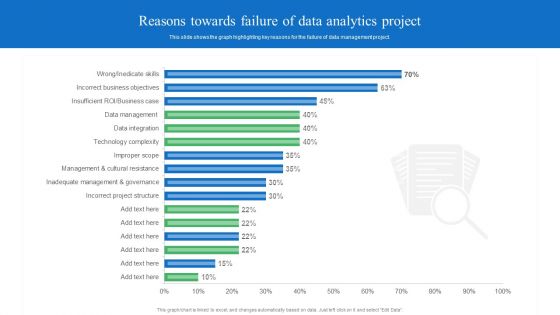
Toolkit For Data Science And Analytics Transition Reasons Towards Failure Of Data Analytics Project Background PDF
This slide shows the graph highlighting key reasons for the failure of data management project. If you are looking for a format to display your unique thoughts, then the professionally designed Toolkit For Data Science And Analytics Transition Reasons Towards Failure Of Data Analytics Project Background PDF is the one for you. You can use it as a Google Slides template or a PowerPoint template. Incorporate impressive visuals, symbols, images, and other charts. Modify or reorganize the text boxes as you desire. Experiment with shade schemes and font pairings. Alter, share or cooperate with other people on your work. Download Toolkit For Data Science And Analytics Transition Reasons Towards Failure Of Data Analytics Project Background PDF and find out how to give a successful presentation. Present a perfect display to your team and make your presentation unforgettable.

Toolkit For Data Science And Analytics Transition Key Phases Of Data Analytics Project Structure PDF
The slide explains the key phases of data analytics management. It includes multiple functions like data integration, data governance and repository management to accomplish data analytical results. Crafting an eye catching presentation has never been more straightforward. Let your presentation shine with this tasteful yet straightforward Toolkit For Data Science And Analytics Transition Key Phases Of Data Analytics Project Structure PDF template. It offers a minimalistic and classy look that is great for making a statement. The colors have been employed intelligently to add a bit of playfulness while still remaining professional. Construct the ideal Toolkit For Data Science And Analytics Transition Key Phases Of Data Analytics Project Structure PDF that effortlessly grabs the attention of your audience Begin now and be certain to wow your customers.

Toolkit For Data Science And Analytics Transition Key Failure Reasons For Data Analytics Project Structure PDF
This slide displays the key reasons for why the data analytics project fails. It includes reasons such as incorrect data, poor communication structure, and conflicting data etc. Find highly impressive Toolkit For Data Science And Analytics Transition Key Failure Reasons For Data Analytics Project Structure PDF on Slidegeeks to deliver a meaningful presentation. You can save an ample amount of time using these presentation templates. No need to worry to prepare everything from scratch because Slidegeeks experts have already done a huge research and work for you. You need to download Toolkit For Data Science And Analytics Transition Key Failure Reasons For Data Analytics Project Structure PDF for your upcoming presentation. All the presentation templates are 100 percent editable and you can change the color and personalize the content accordingly. Download now.

Toolkit For Data Science And Analytics Transition Key Essential Features Of Data Analytics Tools Elements PDF
The slide elaborates the key features of Data Analytics software which are required to improve business results. The features includes easy raw data processing, scalability, and technical support etc. Whether you have daily or monthly meetings, a brilliant presentation is necessary. Toolkit For Data Science And Analytics Transition Key Essential Features Of Data Analytics Tools Elements PDF can be your best option for delivering a presentation. Represent everything in detail using Toolkit For Data Science And Analytics Transition Key Essential Features Of Data Analytics Tools Elements PDF and make yourself stand out in meetings. The template is versatile and follows a structure that will cater to your requirements. All the templates prepared by Slidegeeks are easy to download and edit. Our research experts have taken care of the corporate themes as well. So, give it a try and see the results.
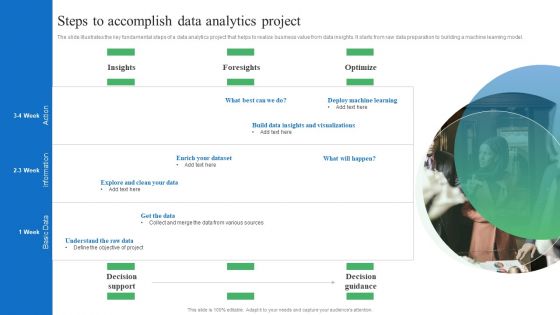
Toolkit For Data Science And Analytics Transition Steps To Accomplish Data Analytics Project Inspiration PDF
The slide illustrates the key fundamental steps of a data analytics project that helps to realize business value from data insights. It starts from raw data preparation to building a machine learning model. The best PPT templates are a great way to save time, energy, and resources. Slidegeeks have 100 percent editable powerpoint slides making them incredibly versatile. With these quality presentation templates, you can create a captivating and memorable presentation by combining visually appealing slides and effectively communicating your message. Download Toolkit For Data Science And Analytics Transition Steps To Accomplish Data Analytics Project Inspiration PDF from Slidegeeks and deliver a wonderful presentation.
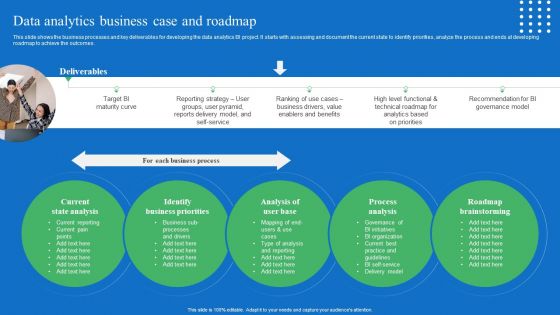
Toolkit For Data Science And Analytics Transition Data Analytics Business Case And Roadmap Designs PDF
This slide shows the business processes and key deliverables for developing the data analytics BI project. It starts with assessing and document the current state to identify priorities, analyze the process and ends at developing roadmap to achieve the outcomes. Get a simple yet stunning designed Toolkit For Data Science And Analytics Transition Data Analytics Business Case And Roadmap Designs PDF. It is the best one to establish the tone in your meetings. It is an excellent way to make your presentations highly effective. So, download this PPT today from Slidegeeks and see the positive impacts. Our easy to edit Toolkit For Data Science And Analytics Transition Data Analytics Business Case And Roadmap Designs PDF can be your go to option for all upcoming conferences and meetings. So, what are you waiting for Grab this template today.

Toolkit For Data Science And Analytics Transition Key Consideration To Implement Data Analytics Guidelines PDF
This slide show the roadmap of essential consideration for performing data analytics in business. Do you have an important presentation coming up Are you looking for something that will make your presentation stand out from the rest Look no further than Toolkit For Data Science And Analytics Transition Key Consideration To Implement Data Analytics Guidelines PDF. With our professional designs, you can trust that your presentation will pop and make delivering it a smooth process. And with Slidegeeks, you can trust that your presentation will be unique and memorable. So why wait Grab Toolkit For Data Science And Analytics Transition Key Consideration To Implement Data Analytics Guidelines PDF today and make your presentation stand out from the rest.
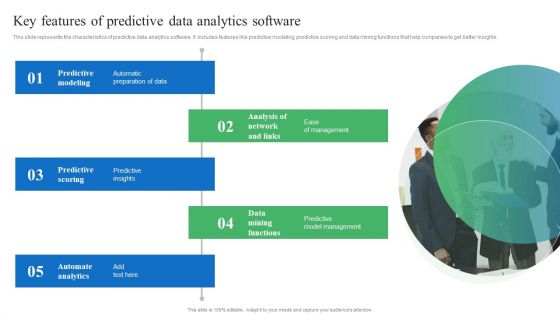
Toolkit For Data Science And Analytics Transition Key Features Of Predictive Data Analytics Software Ideas PDF
This slide represents the characteristics of predictive data analytics software. It includes features like predictive modeling, predictive scoring and data mining functions that help companies to get better insights. If your project calls for a presentation, then Slidegeeks is your go to partner because we have professionally designed, easy to edit templates that are perfect for any presentation. After downloading, you can easily edit Toolkit For Data Science And Analytics Transition Key Features Of Predictive Data Analytics Software Ideas PDF and make the changes accordingly. You can rearrange slides or fill them with different images. Check out all the handy templates.
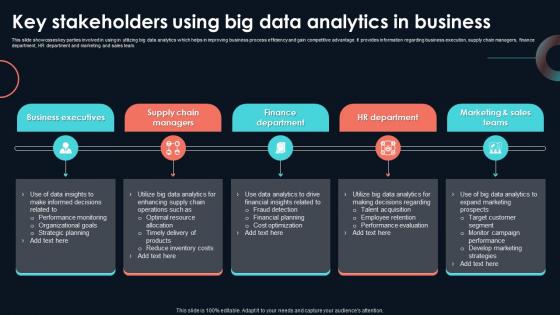
Key Stakeholders Using Big Data Analytics Developing Strategic Insights Using Big Data Analytics SS V
This slide showcases key parties involved in using in utilizing big data analytics which helps in improving business process efficiency and gain competitive advantage. It provides information regarding business execution, supply chain managers, finance department, HR department and marketing and sales team. If your project calls for a presentation, then Slidegeeks is your go-to partner because we have professionally designed, easy-to-edit templates that are perfect for any presentation. After downloading, you can easily edit Key Stakeholders Using Big Data Analytics Developing Strategic Insights Using Big Data Analytics SS V and make the changes accordingly. You can rearrange slides or fill them with different images. Check out all the handy templates
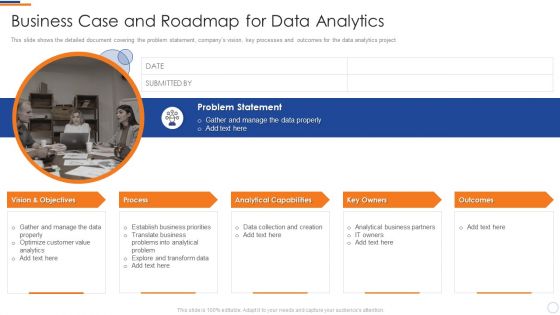
Business Intelligence And Big Data Analytics Business Case And Roadmap For Data Analytics Designs PDF
This slide shows the detailed document covering the problem statement, companys vision, key processes and outcomes for the data analytics project. Presenting business intelligence and big data analytics business case and roadmap for data analytics designs pdf to provide visual cues and insights. Share and navigate important information on one stages that need your due attention. This template can be used to pitch topics like problem statement, vision and objectives, process, analytical capabilities, key owners. In addtion, this PPT design contains high resolution images, graphics, etc, that are easily editable and available for immediate download.
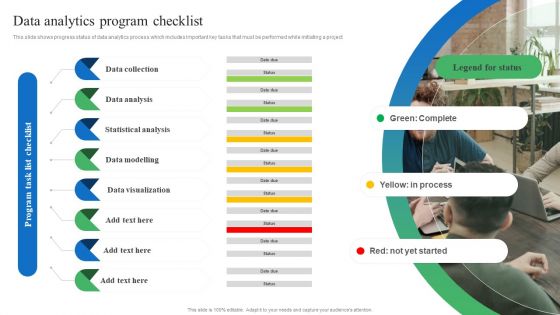
Toolkit For Data Science And Analytics Transition Data Analytics Program Checklist Portrait PDF
This slide shows progress status of data analytics process which includes important key tasks that must be performed while initiating a project. From laying roadmaps to briefing everything in detail, our templates are perfect for you. You can set the stage with your presentation slides. All you have to do is download these easy to edit and customizable templates. Toolkit For Data Science And Analytics Transition Data Analytics Program Checklist Portrait PDF will help you deliver an outstanding performance that everyone would remember and praise you for. Do download this presentation today.

Toolkit For Data Science And Analytics Transition Priority Checklist For Data Analytics Program Sample PDF
The slide displays the to do list that allows to set the high priority task at first and Least priority at last to ensure consistency and completeness while performing the process. This Toolkit For Data Science And Analytics Transition Priority Checklist For Data Analytics Program Sample PDF is perfect for any presentation, be it in front of clients or colleagues. It is a versatile and stylish solution for organizing your meetings. The Toolkit For Data Science And Analytics Transition Priority Checklist For Data Analytics Program Sample PDF features a modern design for your presentation meetings. The adjustable and customizable slides provide unlimited possibilities for acing up your presentation. Slidegeeks has done all the homework before launching the product for you. So, do not wait, grab the presentation templates today.

Toolkit For Data Science And Analytics Transition Key Features To Implement Data Analytics Software Elements PDF
This slide shows broad range of data analytics features that help businesses to draw data driven decision. It includes features such as collaboration, data cleaning, Data governance and many more. Are you in need of a template that can accommodate all of your creative concepts This one is crafted professionally and can be altered to fit any style. Use it with Google Slides or PowerPoint. Include striking photographs, symbols, depictions, and other visuals. Fill, move around, or remove text boxes as desired. Test out color palettes and font mixtures. Edit and save your work, or work with colleagues. Download Toolkit For Data Science And Analytics Transition Key Features To Implement Data Analytics Software Elements PDF and observe how to make your presentation outstanding. Give an impeccable presentation to your group and make your presentation unforgettable.

Toolkit For Data Science And Analytics Transition Key Consideration For Data Analytics Implementation Strategy Ideas PDF
This slide depicts a holistic data analytics implementation strategy that includes a roadmap with a mix of business and technology imperatives. Slidegeeks is here to make your presentations a breeze with Toolkit For Data Science And Analytics Transition Key Consideration For Data Analytics Implementation Strategy Ideas PDF With our easy to use and customizable templates, you can focus on delivering your ideas rather than worrying about formatting. With a variety of designs to choose from, you are sure to find one that suits your needs. And with animations and unique photos, illustrations, and fonts, you can make your presentation pop. So whether you are giving a sales pitch or presenting to the board, make sure to check out Slidegeeks first.
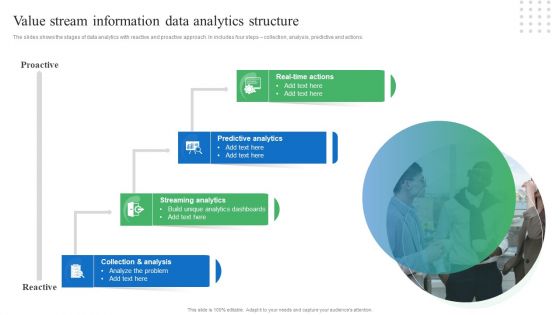
Toolkit For Data Science And Analytics Transition Value Stream Information Data Analytics Structure Sample PDF
The slides shows the stages of data analytics with reactive and proactive approach. In includes four steps collection, analysis, predictive and actions. Retrieve professionally designed Toolkit For Data Science And Analytics Transition Value Stream Information Data Analytics Structure Sample PDF to effectively convey your message and captivate your listeners. Save time by selecting pre made slideshows that are appropriate for various topics, from business to educational purposes. These themes come in many different styles, from creative to corporate, and all of them are easily adjustable and can be edited quickly. Access them as PowerPoint templates or as Google Slides themes. You do not have to go on a hunt for the perfect presentation because Slidegeeks got you covered from everywhere.

Business Intelligence And Big Data Analytics Data Analytics Business Case And Roadmap Template PDF
This slide shows the business processes and key deliverables for developing the data analytics BI project. It starts with assessing and document the current state to identify priorities, analyse the process and ends at developing roadmap to achieve the outcomes. This is a business intelligence and big data analytics data analytics business case and roadmap template pdf template with various stages. Focus and dispense information on five stages using this creative set, that comes with editable features. It contains large content boxes to add your information on topics like current state analysis, identify business priorities, analysis user base, process analysis, roadmap brainstorming. You can also showcase facts, figures, and other relevant content using this PPT layout. Grab it now.
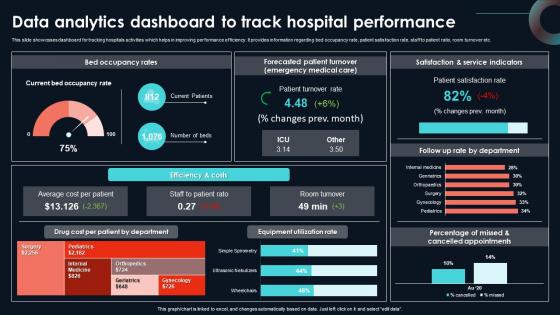
Data Analytics Dashboard To Track Hospital Developing Strategic Insights Using Big Data Analytics SS V
This slide showcases dashboard for tracking hospitals activities which helps in improving performance efficiency. It provides information regarding bed occupancy rate, patient satisfaction rate, staff to patient ratio, room turnover etc. The best PPT templates are a great way to save time, energy, and resources. Slidegeeks have 100 percent editable powerpoint slides making them incredibly versatile. With these quality presentation templates, you can create a captivating and memorable presentation by combining visually appealing slides and effectively communicating your message. Download Data Analytics Dashboard To Track Hospital Developing Strategic Insights Using Big Data Analytics SS V from Slidegeeks and deliver a wonderful presentation.
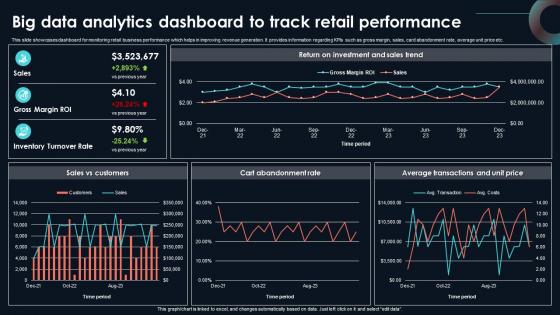
Big Data Analytics Dashboard To Track Developing Strategic Insights Using Big Data Analytics SS V
This slide showcases dashboard for monitoring retail business performance which helps in improving revenue generation. It provides information regarding KPIs such as gross margin, sales, card abandonment rate, average unit price etc. If your project calls for a presentation, then Slidegeeks is your go-to partner because we have professionally designed, easy-to-edit templates that are perfect for any presentation. After downloading, you can easily edit Big Data Analytics Dashboard To Track Developing Strategic Insights Using Big Data Analytics SS V and make the changes accordingly. You can rearrange slides or fill them with different images. Check out all the handy templates
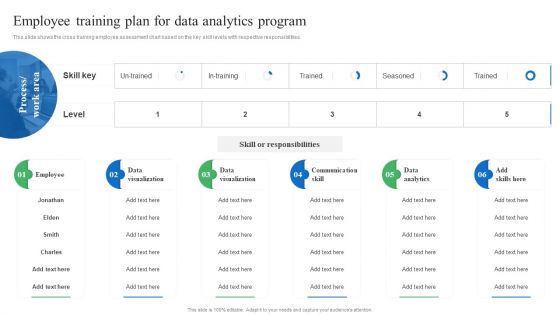
Toolkit For Data Science And Analytics Transition Employee Training Plan For Data Analytics Program Microsoft PDF
This slide shows the cross training employee assessment chart based on the key skill levels with respective responsibilities. Do you have an important presentation coming up Are you looking for something that will make your presentation stand out from the rest Look no further than Toolkit For Data Science And Analytics Transition Employee Training Plan For Data Analytics Program Microsoft PDF. With our professional designs, you can trust that your presentation will pop and make delivering it a smooth process. And with Slidegeeks, you can trust that your presentation will be unique and memorable. So why wait Grab Toolkit For Data Science And Analytics Transition Employee Training Plan For Data Analytics Program Microsoft PDF today and make your presentation stand out from the rest.
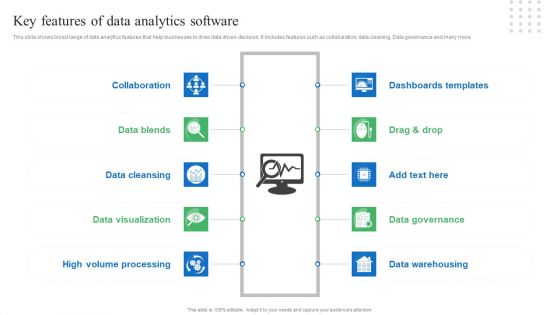
Toolkit For Data Science And Analytics Transition Key Features Of Data Analytics Software Topics PDF
If your project calls for a presentation, then Slidegeeks is your go to partner because we have professionally designed, easy to edit templates that are perfect for any presentation. After downloading, you can easily edit Toolkit For Data Science And Analytics Transition Key Features Of Data Analytics Software Topics PDF and make the changes accordingly. You can rearrange slides or fill them with different images. Check out all the handy templates.

Product Analytics Tool 1 UX Cam For Mobile App User Behaviour Product Analytics Implementation Data Analytics V
This slide provides an overview of product analytic tool UXCam. It covers details regarding tool description, unique selling proposition and pricing plans such as free, growth and enterprise.Present like a pro with Product Analytics Tool 1 UX Cam For Mobile App User Behaviour Product Analytics Implementation Data Analytics V. Create beautiful presentations together with your team, using our easy-to-use presentation slides. Share your ideas in real-time and make changes on the fly by downloading our templates. So whether you are in the office, on the go, or in a remote location, you can stay in sync with your team and present your ideas with confidence. With Slidegeeks presentation got a whole lot easier. Grab these presentations today.
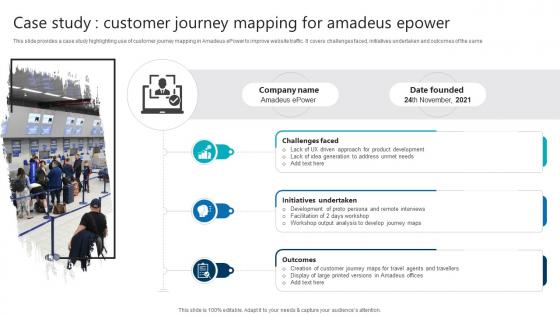
Case Study Customer Journey Mapping For Amadeus Epower Product Analytics Implementation Data Analytics V
This slide provides a case study highlighting use of customer journey mapping in Amadeus ePower to improve website traffic. It covers challenges faced, initiatives undertaken and outcomes of the samePresent like a pro with Case Study Customer Journey Mapping For Amadeus Epower Product Analytics Implementation Data Analytics V. Create beautiful presentations together with your team, using our easy-to-use presentation slides. Share your ideas in real-time and make changes on the fly by downloading our templates. So whether you are in the office, on the go, or in a remote location, you can stay in sync with your team and present your ideas with confidence. With Slidegeeks presentation got a whole lot easier. Grab these presentations today.
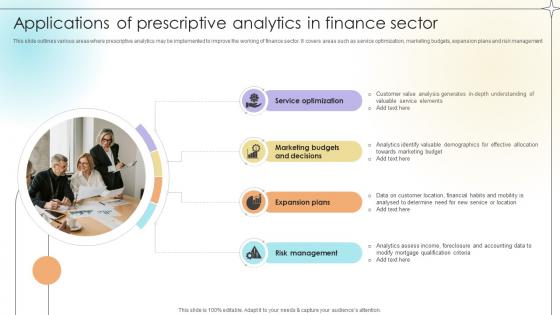
Applications Of Prescriptive Analytics In Finance Sector Data Analytics SS V
This slide outlines various areas where prescriptive analytics may be implemented to improve the working of finance sector. It covers areas such as service optimization, marketing budgets, expansion plans and risk management.Present like a pro with Applications Of Prescriptive Analytics In Finance Sector Data Analytics SS V. Create beautiful presentations together with your team, using our easy-to-use presentation slides. Share your ideas in real-time and make changes on the fly by downloading our templates. So whether you are in the office, on the go, or in a remote location, you can stay in sync with your team and present your ideas with confidence. With Slidegeeks presentation got a whole lot easier. Grab these presentations today.

Requirement Hierarchy For Product Data Analytics Enhancement Clipart Pdf
This slide showcases the requirement hierarchy to enhance product data analytics process for better analysis. This includes team leaders, status of task and steps like collect, refine, build, act and data actualization Showcasing this set of slides titled Requirement Hierarchy For Product Data Analytics Enhancement Clipart Pdf. The topics addressed in these templates are Develop Graphs, Collect Required Data, Develop Dashboards. All the content presented in this PPT design is completely editable. Download it and make adjustments in color, background, font etc. as per your unique business setting.
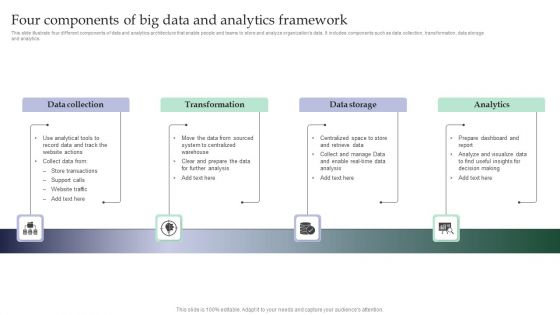
Four Components Of Big Data And Analytics Framework Diagrams PDF
This slide illustrate four different components of data and analytics architecture that enable people and teams to store and analyze organizations data. It includes components such as data collection, transformation, data storage and analytics Persuade your audience using this Four Components Of Big Data And Analytics Framework Diagrams PDF. This PPT design covers four stages, thus making it a great tool to use. It also caters to a variety of topics including Data Collection, Transformation, Data Storage. Download this PPT design now to present a convincing pitch that not only emphasizes the topic but also showcases your presentation skills.

 Home
Home