Dashboards

Dashboard Showcasing Executive Initiating Globalization Of Banking Ppt Template
This slide showcases different KPIs related to banking. This template focuses on giving executives a holistic overview of enterprise and ts performance. It includes information related to expense trend, profits by branch, revenue, etc. Present like a pro with Dashboard Showcasing Executive Initiating Globalization Of Banking Ppt Template. Create beautiful presentations together with your team, using our easy-to-use presentation slides. Share your ideas in real-time and make changes on the fly by downloading our templates. So whether you are in the office, on the go, or in a remote location, you can stay in sync with your team and present your ideas with confidence. With Slidegeeks presentation got a whole lot easier. Grab these presentations today.

Dashboard Analysis For Tracking Enhancing Productivity With Adoption PPT Presentation
This slide showcases the KPIs that would help to track the improvements with adoption of new sustainable agriculture practices. It includes current tasks, crops, harvest, todays weather, summary, etc. This Dashboard Analysis For Tracking Enhancing Productivity With Adoption PPT Presentation from Slidegeeks makes it easy to present information on your topic with precision. It provides customization options, so you can make changes to the colors, design, graphics, or any other component to create a unique layout. It is also available for immediate download, so you can begin using it right away. Slidegeeks has done good research to ensure that you have everything you need to make your presentation stand out. Make a name out there for a brilliant performance.
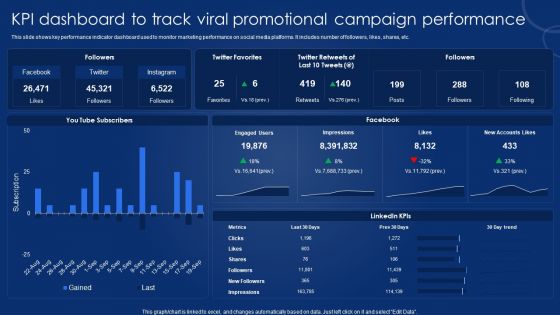
KPI Dashboard To Track Viral Promotional Campaign Performance Icons PDF

Performance Strategic Analysis Dashboard For Tactical Management Rules PDF
This slide defines the dashboard for analyzing the sales key performance indicators KPIs. It includes information related to the number of sales, revenue, profit, and cost. Showcasing this set of slides titled Performance Strategic Analysis Dashboard For Tactical Management Rules PDF. The topics addressed in these templates are Revenue, New Customers, Average Revenue, Per Customer. All the content presented in this PPT design is completely editable. Download it and make adjustments in color, background, font etc. as per your unique business setting.

Email Marketing Campaign Outcomes Result Analysis Dashboard Mockup PDF
This slide covers the dashboard for analyzing the email campaign metrics. It includes information related to engagement a key performance indicator KPIs. Pitch your topic with ease and precision using this Email Marketing Campaign Outcomes Result Analysis Dashboard Mockup PDF. This layout presents information on Campaigns Sent, Emails Sent, Delivery Rate. It is also available for immediate download and adjustment. So, changes can be made in the color, design, graphics or any other component to create a unique layout.
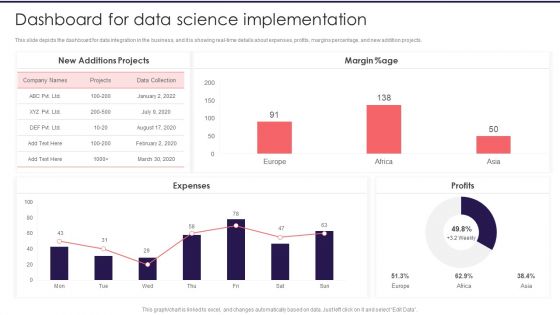
Information Studies Dashboard For Data Science Implementation Structure PDF
This slide depicts the dashboard for data integration in the business, and it is showing real time details about expenses, profits, margins percentage, and new addition projects. Deliver an awe inspiring pitch with this creative Information Studies Dashboard For Data Science Implementation Structure PDF bundle. Topics like New Additions Projects, Margin, Expenses can be discussed with this completely editable template. It is available for immediate download depending on the needs and requirements of the user.
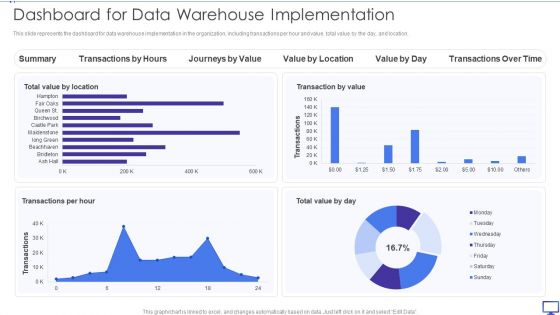
Decision Support System Dashboard For Data Warehouse Implementation Designs PDF
This slide represents the dashboard for data warehouse implementation in the organization, including transactions per hour and value, total value by the day, and location. Deliver an awe inspiring pitch with this creative Decision Support System Dashboard For Data Warehouse Implementation Designs PDF bundle. Topics like Transactions Per Hour, Total Value Day, Transactions Over Time can be discussed with this completely editable template. It is available for immediate download depending on the needs and requirements of the user.
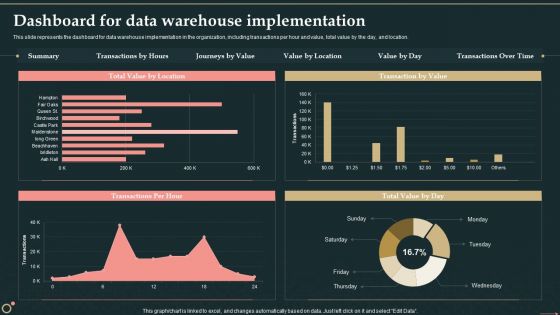
Management Information System Dashboard For Data Warehouse Implementation Structure PDF
This slide represents the dashboard for data warehouse implementation in the organization, including transactions per hour and value, total value by the day, and location.Deliver and pitch your topic in the best possible manner with this Management Information System Dashboard For Data Warehouse Implementation Structure PDF. Use them to share invaluable insights on Transactions, Value Location, Transactions Over and impress your audience. This template can be altered and modified as per your expectations. So, grab it now.

Information Security Risk Evaluation Dashboard For Data Privacy Introduction PDF
This slide depicts the risk evaluation dashboard for data privacy based on audits with open findings, GDPR processing per region, control and measure trends, average response time. There are so many reasons you need a Information Security Risk Evaluation Dashboard For Data Privacy Introduction PDF. The first reason is you can not spend time making everything from scratch, Thus, Slidegeeks has made presentation templates for you too. You can easily download these templates from our website easily.
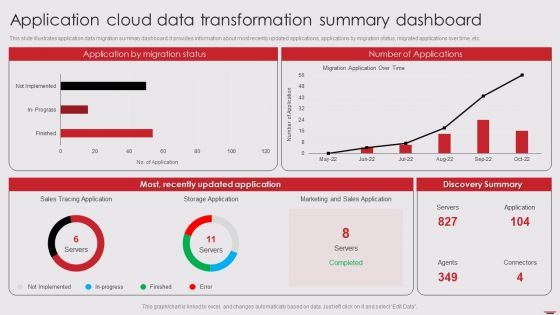
Application Cloud Data Transformation Summary Dashboard Mockup PDF
This slide illustrates application data migration summary dashboard. It provides information about most recently updated applications, applications by migration status, migrated applications over time, etc. Showcasing this set of slides titled Application Cloud Data Transformation Summary Dashboard Mockup PDF. The topics addressed in these templates are Application Migration Status, Number Applications, Most Recently Updated. All the content presented in this PPT design is completely editable. Download it and make adjustments in color, background, font etc. as per your unique business setting.
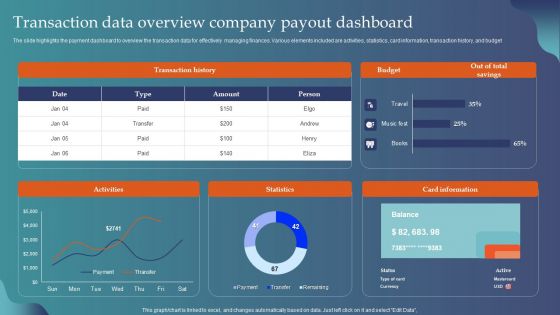
Transaction Data Overview Company Payout Dashboard Guidelines PDF
The slide highlights the payment dashboard to overview the transaction data for effectively managing finances. Various elements included are activities, statistics, card information, transaction history, and budget. Pitch your topic with ease and precision using this Transaction Data Overview Company Payout Dashboard Guidelines PDF. This layout presents information on Transaction History, Budget, Card Information, Statistics. It is also available for immediate download and adjustment. So, changes can be made in the color, design, graphics or any other component to create a unique layout.
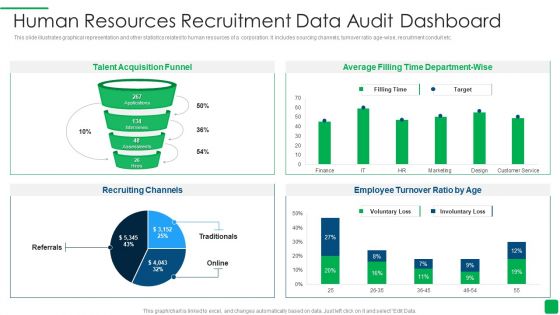
Human Resources Recruitment Data Audit Dashboard Sample PDF
This slide illustrates graphical representation and other statistics related to human resources of a corporation. It includes sourcing channels, turnover ratio age-wise, recruitment conduit etc. Showcasing this set of slides titled Human Resources Recruitment Data Audit Dashboard Sample PDF. The topics addressed in these templates are Recruitment, Dashboard, Human Resources. All the content presented in this PPT design is completely editable. Download it and make adjustments in color, background, font etc. as per your unique business setting.
Online Business Framework Ecommerce Management Kpis And Dashboard Professional PDF
This is a online business framework ecommerce management kpis and dashboard professional pdf template with various stages. Focus and dispense information on two stages using this creative set, that comes with editable features. It contains large content boxes to add your information on topics like ecommerce management kpis dashboard. You can also showcase facts, figures, and other relevant content using this PPT layout. Grab it now.

Corporate Compliance Risk And Kpis Dashboard Slides PDF
This slide illustrates graphical representation of top 5 vulnerabilities, compliance risk graph, risk heat map. It also includes risk action plan and audit check ratio. Showcasing this set of slides titled Corporate Compliance Risk And Kpis Dashboard Slides PDF. The topics addressed in these templates are Corporate Compliance Risk And Kpis Dashboard. All the content presented in this PPT design is completely editable. Download it and make adjustments in color, background, font etc. as per your unique business setting.
Performance Analysis Dashboard Icon For Email Communication Kpis Introduction PDF
Persuade your audience using this Performance Analysis Dashboard Icon For Email Communication Kpis Introduction PDF. This PPT design covers four stages, thus making it a great tool to use. It also caters to a variety of topics including Performance Analysis, Dashboard Icon, Email Communication, Kpis. Download this PPT design now to present a convincing pitch that not only emphasizes the topic but also showcases your presentation skills.
Business Intelligence Dashboard Icon To Track Kpis Pictures PDF
Persuade your audience using this Business Intelligence Dashboard Icon To Track Kpis Pictures PDF. This PPT design covers three stages, thus making it a great tool to use. It also caters to a variety of topics including Business Intelligence, Dashboard Icon, Track Kpis. Download this PPT design now to present a convincing pitch that not only emphasizes the topic but also showcases your presentation skills.

Product Commercialization Action Plan Kpis And DASHBOARD Clipart PDF
Presenting product commercialization action plan KPIs and DASHBOARD clipart pdf to provide visual cues and insights. Share and navigate important information on four stages that need your due attention. This template can be used to pitch topics like sales metrics, service metrics, marketing metrics, dashboard. In addtion, this PPT design contains high resolution images, graphics, etc, that are easily editable and available for immediate download.

Competitor Assessment In Product Development Kpis And Dashboard Download PDF
This is a competitor assessment in product development kpis and dashboard download pdf. template with various stages. Focus and dispense information on four stages using this creative set, that comes with editable features. It contains large content boxes to add your information on topics like sales metrics, service metrics, marketing metrics, dashboard. You can also showcase facts, figures, and other relevant content using this PPT layout. Grab it now.
Commodity Category Analysis Kpis And Dashboard Ppt Styles Ideas PDF
Presenting commodity category analysis kpis and dashboard ppt styles ideas pdf to provide visual cues and insights. Share and navigate important information on four stages that need your due attention. This template can be used to pitch topics like sales metrics, service metrics, marketing metrics, dashboard. In addtion, this PPT design contains high resolution images, graphics, etc, that are easily editable and available for immediate download.
Commodity Channel Segmentation Kpis And Dashboard Ppt Styles Information PDF
Presenting commodity channel segmentation kpis and dashboard ppt styles information pdf to provide visual cues and insights. Share and navigate important information on four stages that need your due attention. This template can be used to pitch topics like sales metrics, service metrics, marketing metrics, dashboard. In addtion, this PPT design contains high resolution images, graphics, etc, that are easily editable and available for immediate download.
HR Dashboard Indicating Weekly Professional Counselling Kpis Icons PDF
This slide illustrates HR career counselling dashboard. It provides information about hours of consultation, satisfaction rate, per consultant rate, popular counselors, etc. Showcasing this set of slides titled HR Dashboard Indicating Weekly Professional Counselling Kpis Icons PDF. The topics addressed in these templates are Specialization, Hours Of Consultation, Popular Counselors. All the content presented in this PPT design is completely editable. Download it and make adjustments in color, background, font etc. as per your unique business setting.
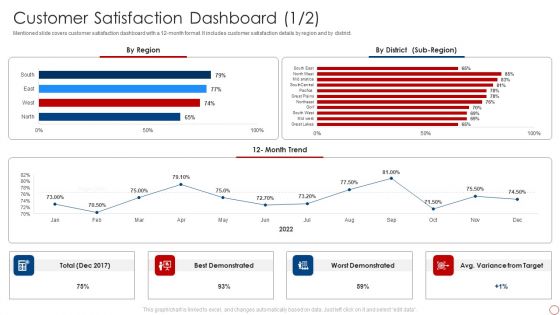
Kpis For Evaluating Business Sustainability Customer Satisfaction Dashboard Clipart PDF
Mentioned slide covers customer satisfaction dashboard with a 12-month format. It includes customer satisfaction details by region and by district. Deliver an awe inspiring pitch with this creative Kpis For Evaluating Business Sustainability Customer Satisfaction Dashboard Clipart PDF bundle. Topics like Best Demonstrated, Worst Demonstrated, 12 Month Trend can be discussed with this completely editable template. It is available for immediate download depending on the needs and requirements of the user.
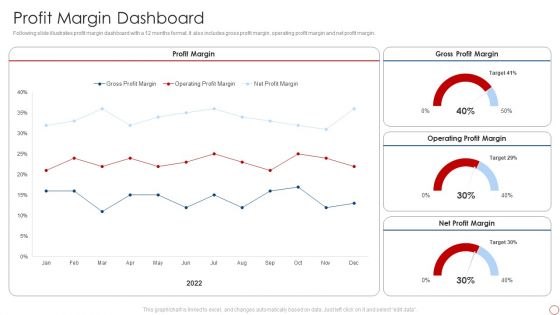
Kpis For Evaluating Business Sustainability Profit Margin Dashboard Pictures PDF
Following slide illustrates profit margin dashboard with a 12 months format. It also includes gross profit margin, operating profit margin and net profit margin. Deliver and pitch your topic in the best possible manner with this Kpis For Evaluating Business Sustainability Profit Margin Dashboard Pictures PDF. Use them to share invaluable insights on Profit Margin, Gross Profit Margin, Operating Profit Margin and impress your audience. This template can be altered and modified as per your expectations. So, grab it now.

Stakeholder Engagement And Management Supplier Compliance Kpis Dashboard Pictures PDF
This slide exhibits a dashboard for stakeholder supplier metrics. It covers contract compliance, average supplier procurement cycle in days and percentage etc. Showcasing this set of slides titled Stakeholder Engagement And Management Supplier Compliance Kpis Dashboard Pictures PDF. The topics addressed in these templates are Average Supplier Procurement Cycle, Average Supplier Procurement Cycle . All the content presented in this PPT design is completely editable. Download it and make adjustments in color, background, font etc. as per your unique business setting.

Manufacturing Kpis Dashboard Showing Overall Equipment Effectiveness Formats PDF
This slide represents the dashboard showing the manufacturing metrics of overall equipment effectiveness. It includes details related to total effective equipment performance, total downtime, good part vs defective parts etc. Showcasing this set of slides titled Manufacturing Kpis Dashboard Showing Overall Equipment Effectiveness Formats PDF. The topics addressed in these templates are OEE, Availability, Performance, Quality. All the content presented in this PPT design is completely editable. Download it and make adjustments in color, background, font etc. as per your unique business setting.

Call Center Kpis Dashboard With Routine Tasks Structure PDF
This slide covers contact center daily operational metrics KPI dashboard. It involves metrics such as ticket status, ticket solved by agents, response time and full resolution time. Pitch your topic with ease and precision using this Call Center Kpis Dashboard With Routine Tasks Structure PDF. This layout presents information on Agent, Response Time, Routine Tasks. It is also available for immediate download and adjustment. So, changes can be made in the color, design, graphics or any other component to create a unique layout.
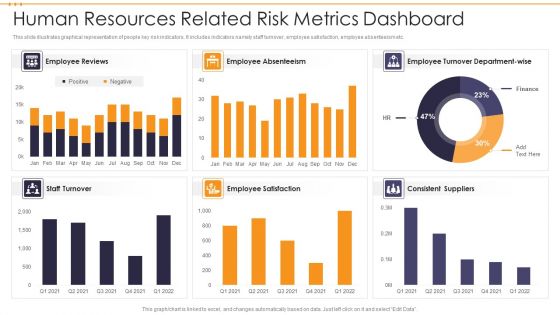
Human Resources Related Risk Metrics Dashboard Information PDF
This slide illustrates graphical representation of people key risk indicators. It includes indicators namely staff turnover, employee satisfaction, employee absenteeism etc. Pitch your topic with ease and precision using this Human Resources Related Risk Metrics Dashboard Information PDF. This layout presents information on Human Resources Related Risk Metrics Dashboard. It is also available for immediate download and adjustment. So, changes can be made in the color, design, graphics or any other component to create a unique layout.

Alternative Distribution Advertising Platform Marketing Performance Dashboard Structure PDF
This infographic is used to track the multichannel marketing dashboard which covers lead funnel, traffic sources, key metrics, etc. Deliver an awe inspiring pitch with this creative alternative distribution advertising platform marketing performance dashboard structure pdf bundle. Topics like web visits, captured lead, qualified lead, sales accepted, opportunity can be discussed with this completely editable template. It is available for immediate download depending on the needs and requirements of the user.
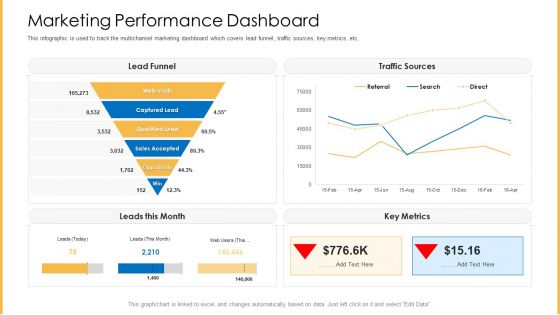
Amalgamation Marketing Pitch Deck Marketing Performance Dashboard Slides PDF
This infographic is used to track the multichannel marketing dashboard which covers lead funnel, traffic sources, key metrics, etc. Deliver an awe inspiring pitch with this creative amalgamation marketing pitch deck marketing performance dashboard slides pdf bundle. Topics like web visits, captured lead, qualified lead, sales accepted, opportunity can be discussed with this completely editable template. It is available for immediate download depending on the needs and requirements of the user.

Organization Sustainability Dashboard With Sourced Technologies Ppt Example SS
The following slide showcases techniques to bring sustainability in startups. It provides information about sustainable solutions, eco point, electric vehicles, ozone generator, etc. Retrieve professionally designed Organization Sustainability Dashboard With Sourced Technologies Ppt Example SS to effectively convey your message and captivate your listeners. Save time by selecting pre-made slideshows that are appropriate for various topics, from business to educational purposes. These themes come in many different styles, from creative to corporate, and all of them are easily adjustable and can be edited quickly. Access them as PowerPoint templates or as Google Slides themes. You do not have to go on a hunt for the perfect presentation because Slidegeeks got you covered from everywhere.
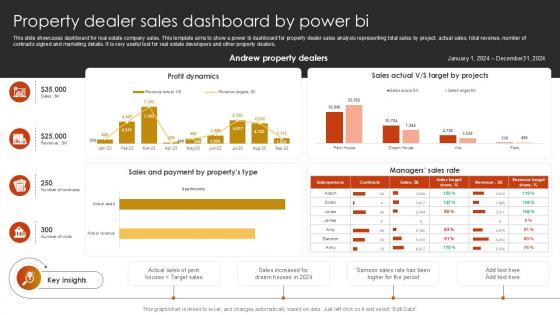
Property Dealer Sales Dashboard By Power BI Ppt Presentation SS
The following slide showcases figures highlighting sustainability plans taken by corporates. It provides information about competitors, energy reduction, waste management, operations, employee retention, etc. Do you know about Slidesgeeks Property Dealer Sales Dashboard By Power BI Ppt Presentation SS These are perfect for delivering any kind od presentation. Using it, create PowerPoint presentations that communicate your ideas and engage audiences. Save time and effort by using our pre-designed presentation templates that are perfect for a wide range of topic. Our vast selection of designs covers a range of styles, from creative to business, and are all highly customizable and easy to edit. Download as a PowerPoint template or use them as Google Slides themes.
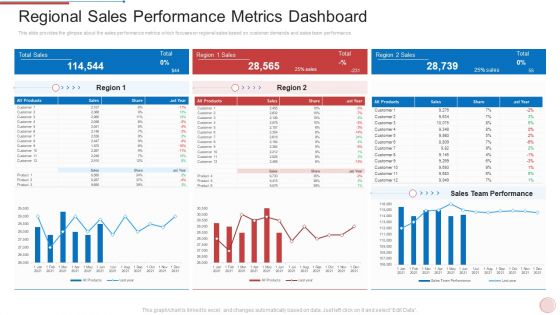
Regional Marketing Strategies Regional Sales Performance Metrics Dashboard Infographics PDF
This slide provides the glimpse about the sales performance metrics which focuses on regional sales based on customer demands and sales team performance. Deliver and pitch your topic in the best possible manner with this regional marketing strategies regional sales performance metrics dashboard infographics pdf. Use them to share invaluable insights on regional sales performance metrics dashboard and impress your audience. This template can be altered and modified as per your expectations. So, grab it now.
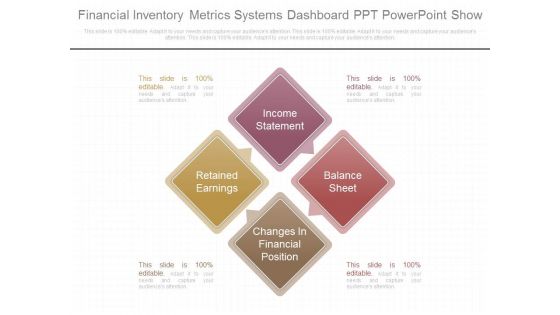
Financial Inventory Metrics Systems Dashboard Ppt Powerpoint Show
This is a financial inventory metrics systems dashboard ppt powerpoint show. This is a four stage process. The stages in this process are income statement, retained earnings, balance sheet, changes in financial position.
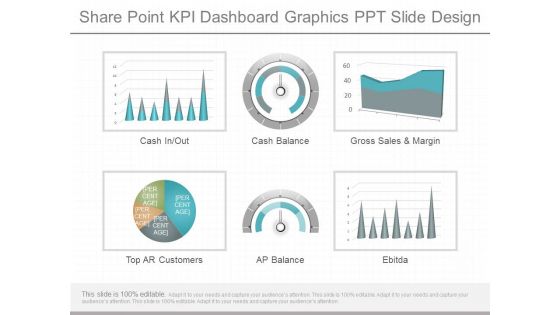
Share Point Kpi Dashboard Graphics Ppt Slide Design
This is a share point kpi dashboard graphics ppt slide design. This is a six stage process. The stages in this process are cash in out, cash balance, gross sales and margin, top ar customers, ap balance, ebitda.
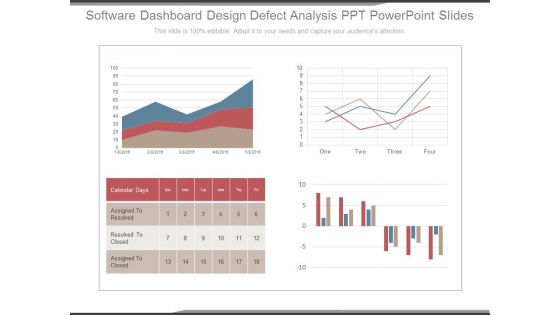
Software Dashboard Design Defect Analysis Ppt Powerpoint Slides
This is a software dashboard design defect analysis ppt powerpoint slides. This is a four stage process. The stages in this process are calendar days, assigned to resolved, resolved to closed, assigned to closed.
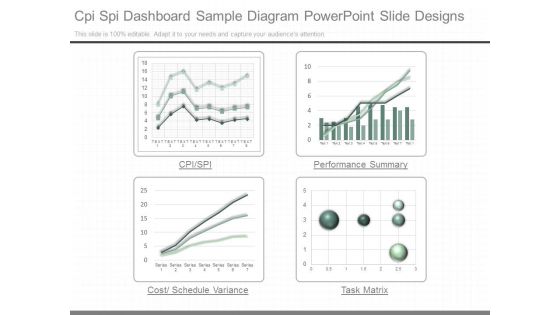
Cpi Spi Dashboard Sample Diagram Powerpoint Slide Designs
This is a cpi spi dashboard sample diagram powerpoint slide designs. This is a four stage process. The stages in this process are cpi spi, performance summary, cost schedule variance, task matrix.

Kpi For Projects Dashboard Diagram Powerpoint Slide Themes
This is a kpi for projects dashboard diagram powerpoint slide themes. This is a four stage process. The stages in this process are project status green, costs thousands, resource bug allocations, burndown.
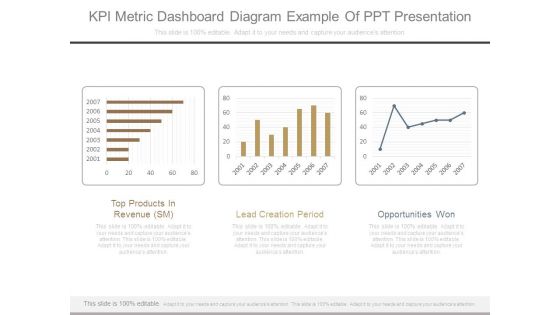
Kpi Metric Dashboard Diagram Example Of Ppt Presentation
This is a kpi metric dashboard diagram example of ppt presentation. This is a three stage process. The stages in this process are top products in revenue sm, lead creation period, opportunities won.
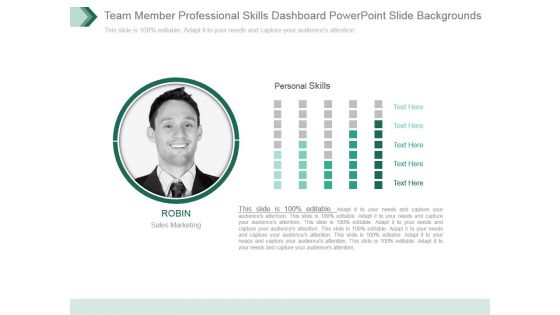
Team Member Professional Skills Dashboard Powerpoint Slide Backgrounds
This is a team member professional skills dashboard powerpoint slide backgrounds. This is a one stage process. The stages in this process are personal skills, sales marketing, business, management, presentation.

Lead Scoring Lead Nurturing Ideas Dashboard Ppt Sample Download
This is a lead scoring lead nurturing ideas dashboard ppt sample download. This is a four stage process. The stages in this process are adoption of lead scoring solutions chosen, number of dimensions, projects completed, number of scoring rules.
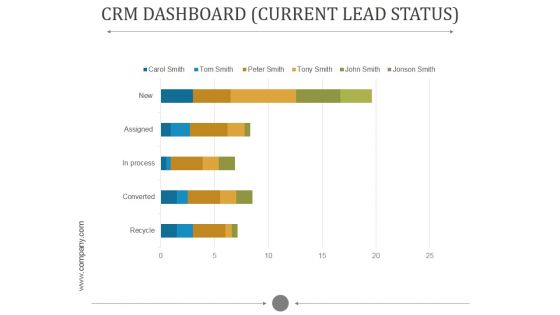
Crm Dashboard Current Lead Status Ppt PowerPoint Presentation Influencers
This is a crm dashboard current lead status ppt powerpoint presentation influencers. This is a five stage process. The stages in this process are new, assigned, process, converted, recycle.

Crm Dashboard Opportunity By Rating Ppt PowerPoint Presentation Template
This is a crm dashboard opportunity by rating ppt powerpoint presentation template. This is a five stage process. The stages in this process are count all opportunity, cold, hot, warm.
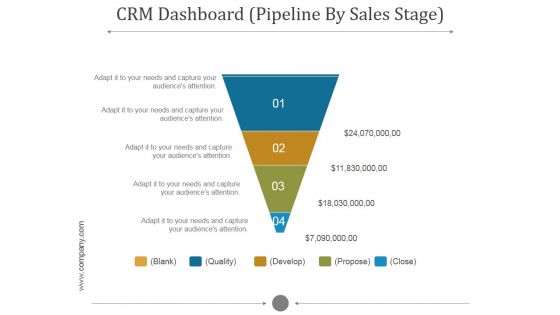
Crm Dashboard Pipeline By Sales Stage Ppt PowerPoint Presentation Styles
This is a crm dashboard pipeline by sales stage ppt powerpoint presentation styles. This is a five stage process. The stages in this process are blank, quality, develop, propose, close.

Monthly Social Media Dashboard Ppt PowerPoint Presentation Background Designs
This is a monthly social media dashboard ppt powerpoint presentation background designs. This is a four stage process. The stages in this process are business, finance, marketing, strategy, analysis, success.
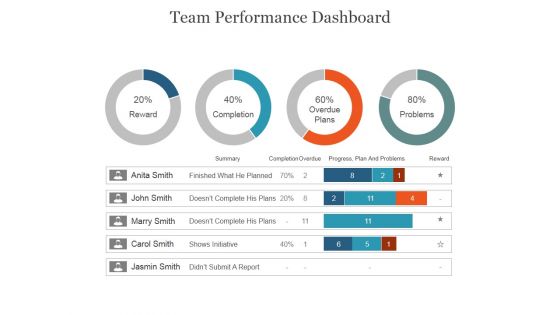
Team Performance Dashboard Ppt PowerPoint Presentation Example 2015
This is a team performance dashboard ppt powerpoint presentation example 2015. This is a four stage process. The stages in this process are reward, completion, overdue plans, problems, summary, completion.
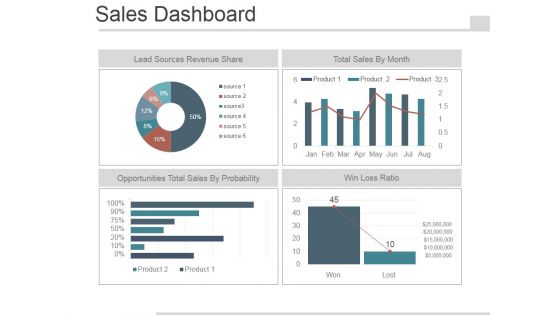
Sales Dashboard Slide Template 2 Ppt PowerPoint Presentation Images
This is a sales dashboard slide template 2 ppt powerpoint presentation images. This is a four stage process. The stages in this process are lead sources revenue share, total sales by month, opportunities total sales by probability, win loss ratio.

Brand Performance Dashboard Template 1 Ppt PowerPoint Presentation Inspiration
This is a brand performance dashboard template 1 ppt powerpoint presentation inspiration. This is a ten stage process. The stages in this process are new customer, film, dollars, amazon.

Financial Balance Sheet Dashboard Ppt PowerPoint Presentation Background Image
This is a financial balance sheet dashboard ppt powerpoint presentation background image. This is a two stage process. The stages in this process are current assets, cash, inventory, prepaid expenses, total assets.
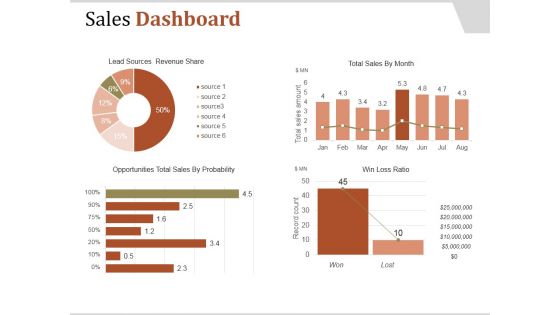
Sales Dashboard Template 2 Ppt PowerPoint Presentation Clipart
This is a sales dashboard template 2 ppt powerpoint presentation clipart. This is a four stage process. The stages in this process are lead sources revenue share, total sales by month, win loss ratio, opportunities total sales by probability.

Brand Performance Dashboard Template 2 Ppt PowerPoint Presentation Template
This is a brand performance dashboard template 2 ppt powerpoint presentation template. This is a five stage process. The stages in this process are marketing, business, social, icons, management.
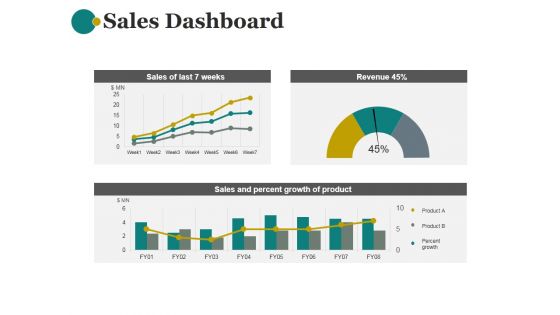
Sales Dashboard Template 1 Ppt PowerPoint Presentation Show
This is a sales dashboard template 1 ppt powerpoint presentation show. This is a three stage process. The stages in this process are sales of last 7 weeks, revenue, sales and percent growth of product.
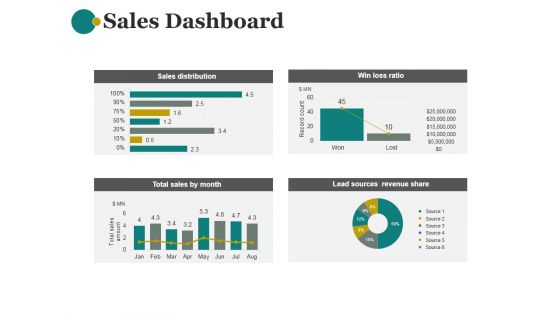
Sales Dashboard Template 2 Ppt PowerPoint Presentation Examples
This is a sales dashboard template 2 ppt powerpoint presentation examples. This is a four stage process. The stages in this process are sales distribution, win loss ratio, lead sources revenue share, total sales by month.

Brand Performance Dashboard Template 1 Ppt PowerPoint Presentation Layouts
This is a brand performance dashboard template 1 ppt powerpoint presentation layouts. This is a five stage process. The stages in this process are business, marketing, strategy, finance, analysis.
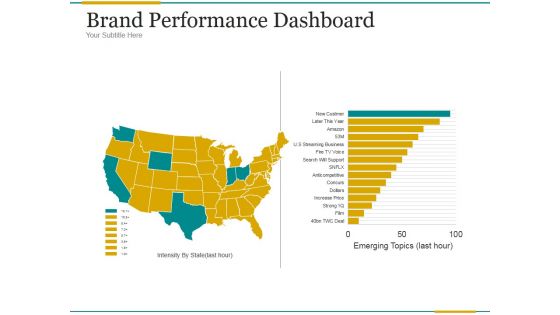
Brand Performance Dashboard Template 2 Ppt PowerPoint Presentation Gallery
This is a brand performance dashboard template 2 ppt powerpoint presentation gallery. This is a two stage process. The stages in this process are business, finance, performance, location, strategy, success.

Crm Dashboard Leads By Source Ppt PowerPoint Presentation Slides
This is a crm dashboard leads by source ppt powerpoint presentation slides. This is a four stage process. The stages in this process are online site, exhibition, email campaign, advertisement.
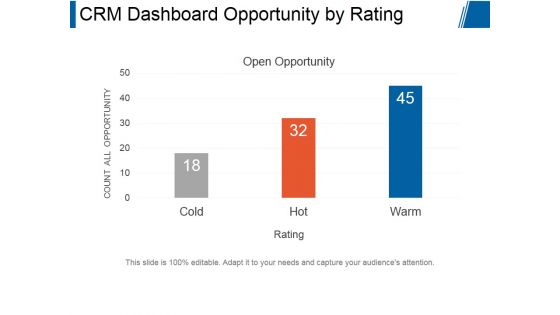
Crm Dashboard Opportunity By Rating Ppt PowerPoint Presentation Backgrounds
This is a crm dashboard opportunity by rating ppt powerpoint presentation backgrounds. This is a three stage process. The stages in this process are open opportunity, count all opportunity, rating.
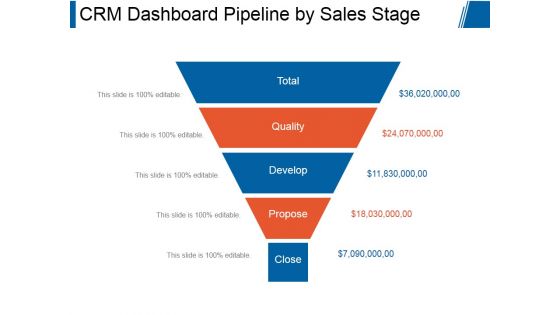
Crm Dashboard Pipeline By Sales Stage Ppt PowerPoint Presentation Show
This is a crm dashboard pipeline by sales stage ppt powerpoint presentation show. This is a five stage process. The stages in this process are total, quality, develop, propose, close.

Crm Dashboard Project Management Ppt PowerPoint Presentation Graphics
This is a crm dashboard project management ppt powerpoint presentation graphics. This is a two stage process. The stages in this process are total projects, projects on hold, overdue projects, available resources, schedule.

Crm Dashboard Top Customers Ppt PowerPoint Presentation Graphics
This is a crm dashboard top customers ppt powerpoint presentation graphics. This is a ten stage process. The stages in this process are top customers, business, marketing, process, management.
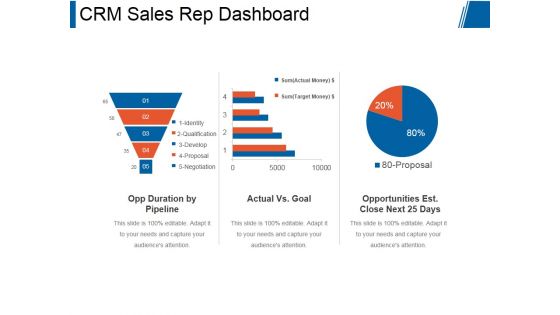
Crm Sales Rep Dashboard Ppt PowerPoint Presentation Influencers
This is a crm sales rep dashboard ppt powerpoint presentation influencers. This is a three stage process. The stages in this process are opp duration by pipeline, actual vs goal, opportunities est close next 25 days.

 Home
Home