Dashboards Manufacturing
CRM Dashboard For Tracking Sales Pipeline Brochure PDF
This slide covers the CRM KPI dashboard for monitoring lead status in the sales funnel. It includes metrics such as open pipeline value, open pipeline by product package, pipeline value forecast, etc. Crafting an eye catching presentation has never been more straightforward. Let your presentation shine with this tasteful yet straightforward CRM Dashboard For Tracking Sales Pipeline Brochure PDF template. It offers a minimalistic and classy look that is great for making a statement. The colors have been employed intelligently to add a bit of playfulness while still remaining professional. Construct the ideal CRM Dashboard For Tracking Sales Pipeline Brochure PDF that effortlessly grabs the attention of your audience Begin now and be certain to wow your customers.
Marketing Activities Tracking Dashboard For Insurance Agency Infographics PDF
This slide provides glimpse about essential marketing activities tracking dashboard for insurance agency in terms of campaign spend by product line, marketing calendar, campaign revenue analysis, etc. Find highly impressive Marketing Activities Tracking Dashboard For Insurance Agency Infographics PDF on Slidegeeks to deliver a meaningful presentation. You can save an ample amount of time using these presentation templates. No need to worry to prepare everything from scratch because Slidegeeks experts have already done a huge research and work for you. You need to download Marketing Activities Tracking Dashboard For Insurance Agency Infographics PDF for your upcoming presentation. All the presentation templates are 100 percent editable and you can change the color and personalize the content accordingly. Download now
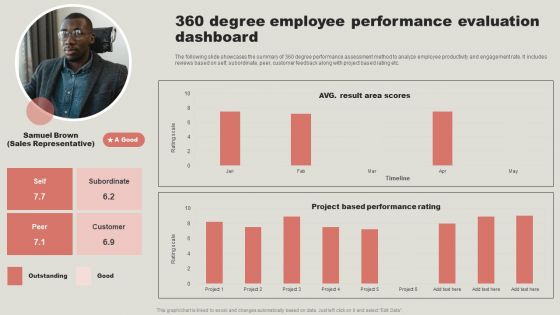
360 Degree Employee Performance Evaluation Dashboard Elements PDF
The following slide showcases the summary of 360 degree performance assessment method to analyze employee productivity and engagement rate. It includes reviews based on self, subordinate, peer, customer feedback along with project based rating etc. Presenting this PowerPoint presentation, titled 360 Degree Employee Performance Evaluation Dashboard Elements PDF, with topics curated by our researchers after extensive research. This editable presentation is available for immediate download and provides attractive features when used. Download now and captivate your audience. Presenting this 360 Degree Employee Performance Evaluation Dashboard Elements PDF. Our researchers have carefully researched and created these slides with all aspects taken into consideration. This is a completely customizable 360 Degree Employee Performance Evaluation Dashboard Elements PDF that is available for immediate downloading. Download now and make an impact on your audience. Highlight the attractive features available with our PPTs.

KPI Dashboard To Measure Financial Institution Industry Revenue Summary PDF
Pitch your topic with ease and precision using this KPI Dashboard To Measure Financial Institution Industry Revenue Summary PDF. This layout presents information on Measure Financial, Institution Industry . It is also available for immediate download and adjustment. So, changes can be made in the color, design, graphics or any other component to create a unique layout.
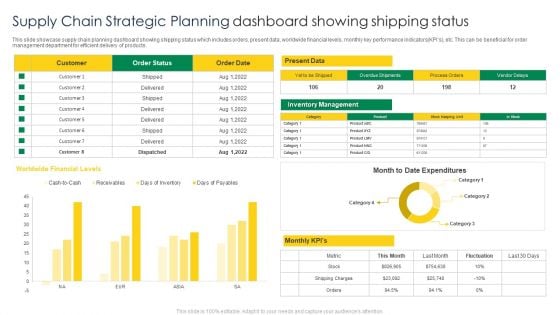
Supply Chain Strategic Planning Dashboard Showing Shipping Status Structure PDF
This slide showcase supply chain planning dashboard showing shipping status which includes orders, present data, worldwide financial levels, monthly key performance indicators KPIs, etc. This can be beneficial for order management department for efficient delivery of products. Showcasing this set of slides titled Supply Chain Strategic Planning Dashboard Showing Shipping Status Structure PDF. The topics addressed in these templates are Worldwide Financial Levels, Present Data, Customer. All the content presented in this PPT design is completely editable. Download it and make adjustments in color, background, font etc. as per your unique business setting.
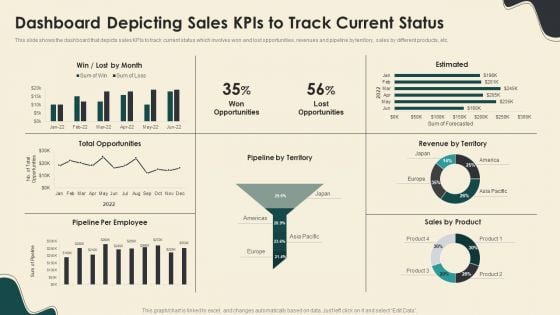
Dashboard Depicting Sales Kpis To Track Current Status Structure PDF
This slide shows the dashboard that depicts sales KPIs to track current status which involves won and lost opportunities, revenues and pipeline by territory, sales by different products, etc. Deliver and pitch your topic in the best possible manner with this Dashboard Depicting Sales Kpis To Track Current Status Structure PDF. Use them to share invaluable insights on Total Opportunities, Revenue By Territory, Sales By Product and impress your audience. This template can be altered and modified as per your expectations. So, grab it now.
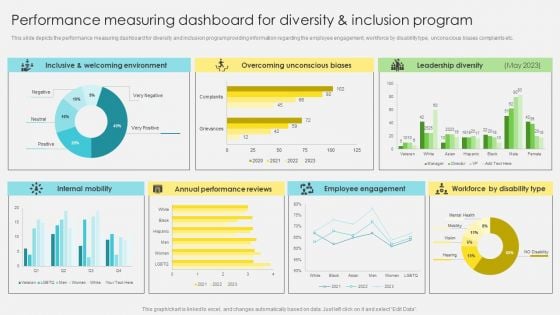
Performance Measuring Dashboard For Diversity And Inclusion Program Template PDF
This slide depicts the performance measuring dashboard for diversity and inclusion program providing information regarding the employee engagement, workforce by disability type, unconscious biases complaints etc. The Performance Measuring Dashboard For Diversity And Inclusion Program Template PDF is a compilation of the most recent design trends as a series of slides. It is suitable for any subject or industry presentation, containing attractive visuals and photo spots for businesses to clearly express their messages. This template contains a variety of slides for the user to input data, such as structures to contrast two elements, bullet points, and slides for written information. Slidegeeks is prepared to create an impression.
Social Media Performance Tracking And Monitoring Dashboard Graphics PDF
The following slide showcases a dashboard to track and measure social media platforms performance. It includes key elements such as website traffic, social media referral rate, site revenue, social media site revenue, etc. The Social Media Performance Tracking And Monitoring Dashboard Graphics PDF is a compilation of the most recent design trends as a series of slides. It is suitable for any subject or industry presentation, containing attractive visuals and photo spots for businesses to clearly express their messages. This template contains a variety of slides for the user to input data, such as structures to contrast two elements, bullet points, and slides for written information. Slidegeeks is prepared to create an impression.
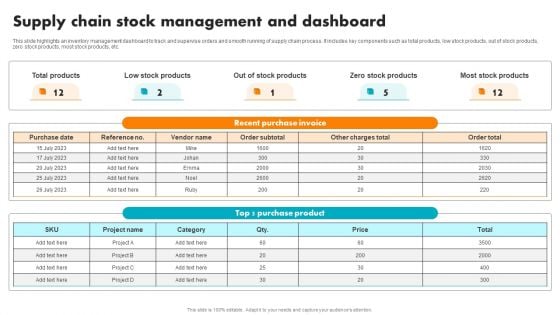
Supply Chain Stock Management And Dashboard Inspiration PDF
This slide highlights an inventory management dashboard to track and supervise orders and smooth running of supply chain process. It includes key components such as total products, low stock products, out of stock products, zero stock products, most stock products, etc. Showcasing this set of slides titled Supply Chain Stock Management And Dashboard Inspiration PDF. The topics addressed in these templates are Low Stock Products, Out Of Stock Products, Zero Stock Products, Most Stock Products. All the content presented in this PPT design is completely editable. Download it and make adjustments in color, background, font etc. as per your unique business setting.
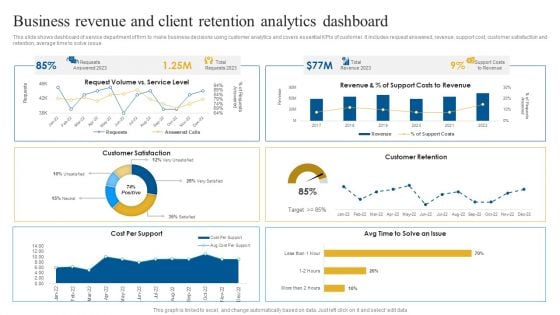
Business Revenue And Client Retention Analytics Dashboard Brochure PDF
This slide shows dashboard of service department of firm to make business decisions using customer analytics and covers essential KPIs of customer. It includes request answered, revenue, support cost, customer satisfaction and retention, average time to solve issue. Showcasing this set of slides titled Business Revenue And Client Retention Analytics Dashboard Brochure PDF. The topics addressed in these templates are Customer Satisfaction, Customer Retention, Revenue. All the content presented in this PPT design is completely editable. Download it and make adjustments in color, background, font etc. as per your unique business setting.

Business Operations Dashboard Ppt PowerPoint Presentation Styles Pictures PDF
This slide shows dashboard for measuring business operations. It includes details of total production, weekly average production, scrap and scrap average in each production line. It also covers daily production statistics, production trend, project summary, events and distribution.Deliver an awe-inspiring pitch with this creative business operations dashboard ppt powerpoint presentation styles pictures pdf. bundle. Topics like production trend, daily production, production summary, distribution can be discussed with this completely editable template. It is available for immediate download depending on the needs and requirements of the user.
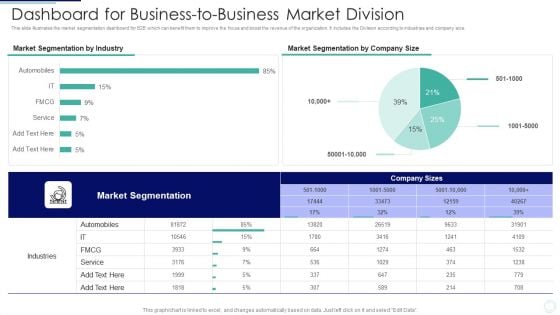
Dashboard For Business To Business Market Division Inspiration PDF
This slide illustrates the market segmentation dashboard for B2B which can benefit them to improve the focus and boost the revenue of the organization. It includes the Division according to industries and company size. Showcasing this set of slides titled Dashboard For Business To Business Market Division Inspiration PDF. The topics addressed in these templates are Industries, Service, Automobiles. All the content presented in this PPT design is completely editable. Download it and make adjustments in color, background, font etc. as per your unique business setting.
Monthly Comparison Dashboard For Lead Tracking Sample PDF
This slide showcases dashboard that can help organization to compare the leads converted in different months and make changes in sales and marketing campaigns . Its key components lead generated by country, by industry type and lead sources by month. Showcasing this set of slides titled Monthly Comparison Dashboard For Lead Tracking Sample PDF. The topics addressed in these templates are Leads Received, Industry Type, Lead Generated. All the content presented in this PPT design is completely editable. Download it and make adjustments in color, background, font etc. as per your unique business setting.
Customer Service Metrics Dashboard With Customer Retention Rate Icons PDF
This slide showcases KPIs dashboard for customer service that can help organization to track the consumer satisfaction score and improve product or service by improving customer loyalty. Its key components are net promoter score, customer retention and support costs. Showcasing this set of slides titled Customer Service Metrics Dashboard With Customer Retention Rate Icons PDF. The topics addressed in these templates are Customer Retention, Net Promoter Score, Service Level. All the content presented in this PPT design is completely editable. Download it and make adjustments in color, background, font etc. as per your unique business setting.
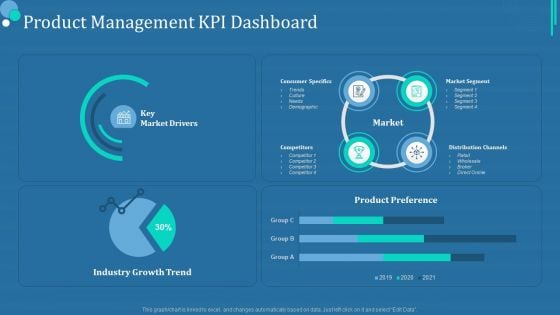
Commodity Category Analysis Product Management KPI Dashboard Inspiration PDF
Deliver an awe inspiring pitch with this creative commodity category analysis product management kpi dashboard inspiration pdf bundle. Topics like key market drivers, industry growth trend, product preference can be discussed with this completely editable template. It is available for immediate download depending on the needs and requirements of the user.
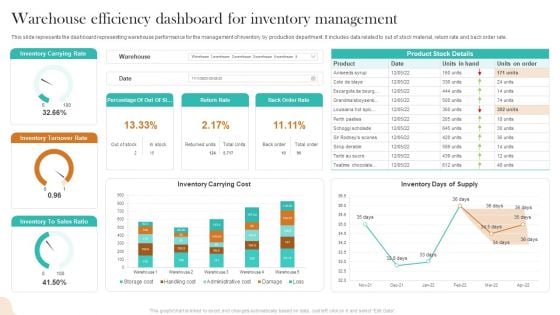
Warehouse Efficiency Dashboard For Inventory Management Infographics PDF
This slide represents the dashboard representing warehouse performance for the management of inventory by production department. It includes data related to out of stock material, return rate and back order rate. Showcasing this set of slides titled Warehouse Efficiency Dashboard For Inventory Management Infographics PDF. The topics addressed in these templates are Inventory Carrying Rate, Inventory Turnover Rate, Inventory Carrying Cost. All the content presented in this PPT design is completely editable. Download it and make adjustments in color, background, font etc. as per your unique business setting.
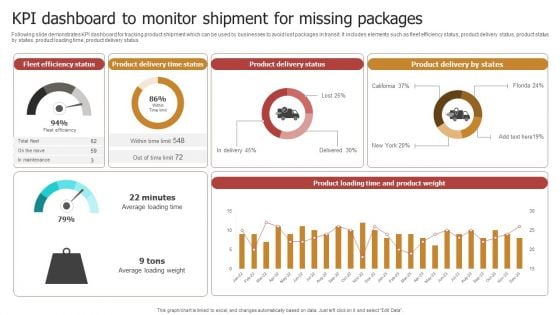
KPI Dashboard To Monitor Shipment For Missing Packages Themes PDF
Following slide demonstrates KPI dashboard for tracking product shipment which can be used by businesses to avoid lost packages in transit. It includes elements such as fleet efficiency status, product delivery status, product status by states, product loading time, product delivery status. Showcasing this set of slides titled KPI Dashboard To Monitor Shipment For Missing Packages Themes PDF. The topics addressed in these templates are Fleet Efficiency Status, Product Delivery Time Status, Product Delivery Status. All the content presented in this PPT design is completely editable. Download it and make adjustments in color, background, font etc. as per your unique business setting.
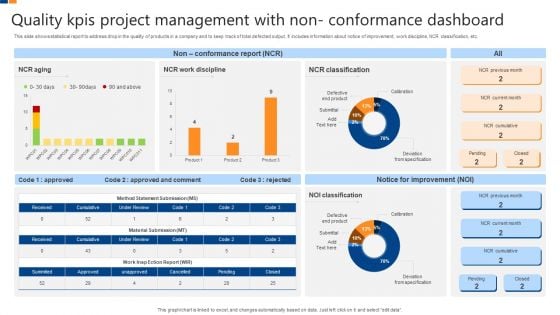
Quality Kpis Project Management With Non Conformance Dashboard Structure PDF
This slide shows statistical report to address drop in the quality of products in a company and to keep track of total defected output. It includes information about notice of improvement, work discipline, NCR classification, etc. Showcasing this set of slides titled Quality Kpis Project Management With Non Conformance Dashboard Structure PDF. The topics addressed in these templates are Quality Kpis Project Management, Non Conformance Dashboard. All the content presented in this PPT design is completely editable. Download it and make adjustments in color, background, font etc. as per your unique business setting.
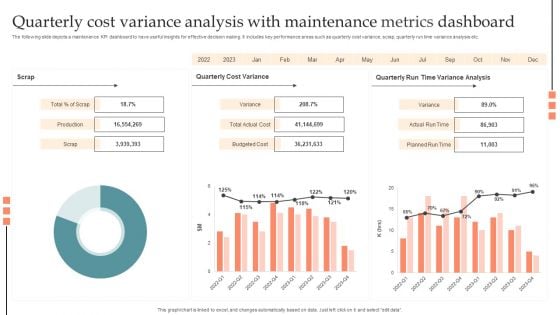
Quarterly Cost Variance Analysis With Maintenance Metrics Dashboard Information PDF
The following slide depicts a maintenance KPI dashboard to have useful insights for effective decision making. It includes key performance areas such as quarterly cost variance, scrap, quarterly run time variance analysis etc. Pitch your topic with ease and precision using this Quarterly Cost Variance Analysis With Maintenance Metrics Dashboard Information PDF. This layout presents information on Production, Budgeted Cost, Planned Run Time, Actual Run Time. It is also available for immediate download and adjustment. So, changes can be made in the color, design, graphics or any other component to create a unique layout.
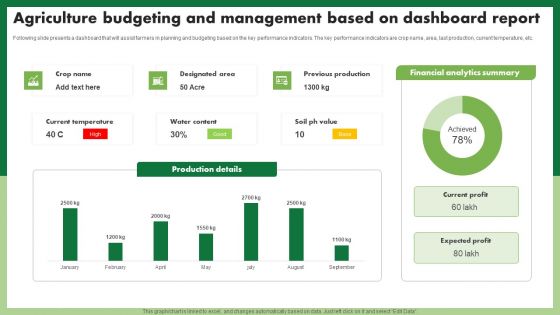
Agriculture Budgeting And Management Based On Dashboard Report Topics PDF
Following slide presents a dashboard that will assist farmers in planning and budgeting based on the key performance indicators. The key performance indicators are crop name, area, last production, current temperature, etc. Showcasing this set of slides titled Agriculture Budgeting And Management Based On Dashboard Report Topics PDF. The topics addressed in these templates are Production Details. All the content presented in this PPT design is completely editable. Download it and make adjustments in color, background, font etc. as per your unique business setting.
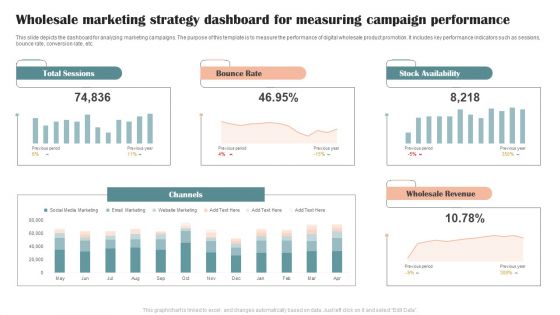
Wholesale Marketing Strategy Dashboard For Measuring Campaign Performance Graphics PDF
This slide depicts the dashboard for analyzing marketing campaigns. The purpose of this template is to measure the performance of digital wholesale product promotion. It includes key performance indicators such as sessions, bounce rate, conversion rate, etc. Showcasing this set of slides titled Wholesale Marketing Strategy Dashboard For Measuring Campaign Performance Graphics PDF. The topics addressed in these templates are Total Sessions, Bounce Rate, Stock Availability. All the content presented in this PPT design is completely editable. Download it and make adjustments in color, background, font etc. as per your unique business setting.
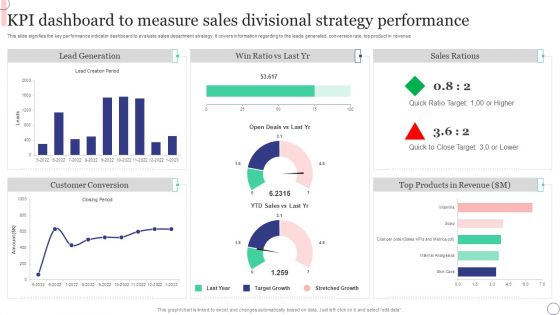
KPI Dashboard To Measure Sales Divisional Strategy Performance Microsoft PDF
This slide signifies the key performance indicator dashboard to evaluate sales department strategy. It covers information regarding to the leads generated, conversion rate, top product in revenue. Pitch your topic with ease and precision using this KPI Dashboard To Measure Sales Divisional Strategy Performance Microsoft PDF. This layout presents information on Sales Rations, Lead Generation, Customer Conversion. It is also available for immediate download and adjustment. So, changes can be made in the color, design, graphics or any other component to create a unique layout.
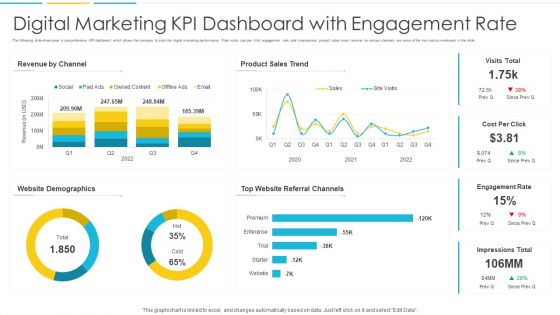
Digital Marketing KPI Dashboard With Engagement Rate Background PDF
The following slide showcases a comprehensive KPI dashboard which allows the company to track the digital marketing performance. Total visits, cost per click, engagement rate, total impressions, product sales trend, revenue by various channels are some of the key metrics mentioned in the slide. Showcasing this set of slides titled Digital Marketing KPI Dashboard With Engagement Rate Background PDF. The topics addressed in these templates are Demographics, Revenue, Sales. All the content presented in this PPT design is completely editable. Download it and make adjustments in color, background, font etc. as per your unique business setting.
Product Capabilities Product Management KPI Dashboard Ppt Pictures Icon PDF
Deliver and pitch your topic in the best possible manner with this product capabilities product management kpi dashboard ppt pictures icon pdf. Use them to share invaluable insights on growth, segment, demographic, competitors and impress your audience. This template can be altered and modified as per your expectations. So, grab it now.
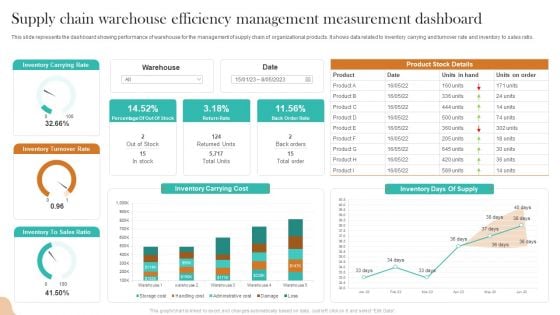
Supply Chain Warehouse Efficiency Management Measurement Dashboard Inspiration PDF
This slide represents the dashboard showing performance of warehouse for the management of supply chain of organizational products. It shows data related to inventory carrying and turnover rate and inventory to sales ratio. Pitch your topic with ease and precision using this Supply Chain Warehouse Efficiency Management Measurement Dashboard Inspiration PDF. This layout presents information on Inventory Carrying Rate, Inventory Turnover Rate, Inventory Carrying Cost. It is also available for immediate download and adjustment. So, changes can be made in the color, design, graphics or any other component to create a unique layout.
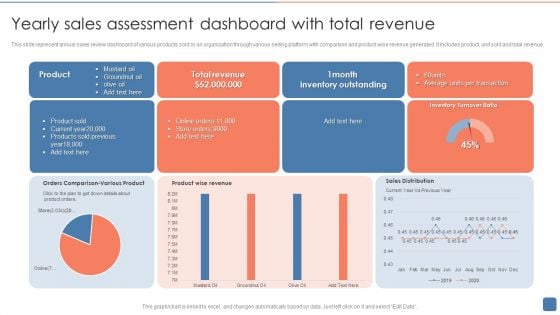
Yearly Sales Assessment Dashboard With Total Revenue Introduction PDF
This slide represent annual sales review dashboard of various products sold by an organization through various selling platform with comparison and product wise revenue generated .It includes product, unit sold and total revenue. Showcasing this set of slides titled Yearly Sales Assessment Dashboard With Total Revenue Introduction PDF. The topics addressed in these templates are Product Sold, Inventory Outstanding, Average. All the content presented in this PPT design is completely editable. Download it and make adjustments in color, background, font etc. as per your unique business setting.
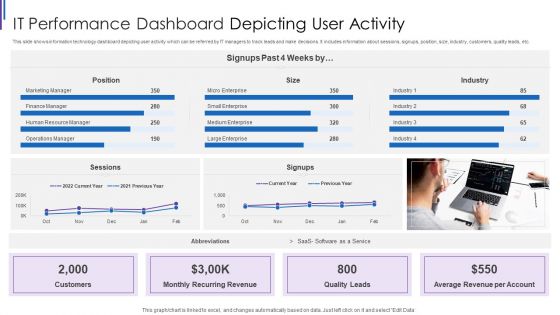
IT Performance Dashboard Depicting User Activity Inspiration PDF
This slide shows information technology dashboard depicting user activity which can be referred by IT managers to track leads and make decisions. It includes information about sessions, signups, position, size, industry, customers, quality leads, etc. Pitch your topic with ease and precision using this IT Performance Dashboard Depicting User Activity Inspiration PDF. This layout presents information on Monthly Recurring Revenue, Average Revenue Per, Account Quality Leads, Customers Position Sessions. It is also available for immediate download and adjustment. So, changes can be made in the color, design, graphics or any other component to create a unique layout.
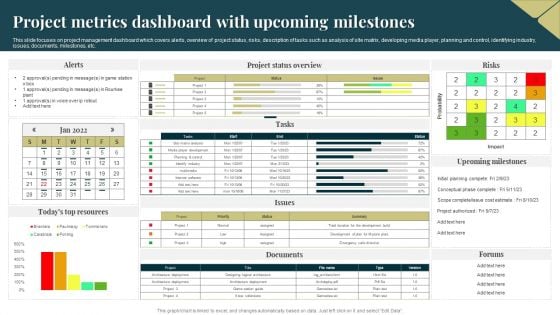
Project Metrics Dashboard With Upcoming Milestones Demonstration PDF
This slide focuses on project management dashboard which covers alerts, overview of project status, risks, description of tasks such as analysis of site matrix, developing media player, planning and control, identifying industry, issues, documents, milestones, etc. Pitch your topic with ease and precision using this Project Metrics Dashboard With Upcoming Milestones Demonstration PDF. This layout presents information on Probability, Project, Risks. It is also available for immediate download and adjustment. So, changes can be made in the color, design, graphics or any other component to create a unique layout.
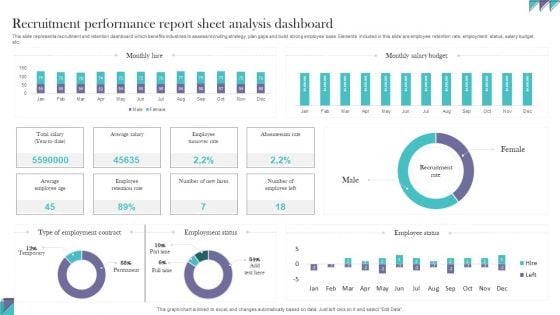
Recruitment Performance Report Sheet Analysis Dashboard Information PDF
This slide represents recruitment and retention dashboard which benefits industries to assess recruiting strategy, plan gaps and build strong employee base. Elements included in this slide are employee retention rate, employment status, salary budget, etc. Pitch your topic with ease and precision using this Recruitment Performance Report Sheet Analysis Dashboard Information PDF. This layout presents information onRecruitment Performance, Report Sheet Analysis. It is also available for immediate download and adjustment. So, changes can be made in the color, design, graphics or any other component to create a unique layout.
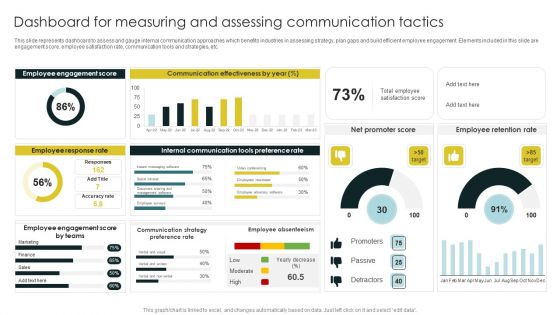
Dashboard For Measuring And Assessing Communication Tactics Information PDF
This slide represents dashboard to assess and gauge internal communication approaches which benefits industries in assessing strategy, plan gaps and build efficient employee engagement. Elements included in this slide are engagement score, employee satisfaction rate, communication tools and strategies, etc. Showcasing this set of slides titled Dashboard For Measuring And Assessing Communication Tactics Information PDF. The topics addressed in these templates are Employee Engagement, Employee Response Rate, Communication Effectiveness. All the content presented in this PPT design is completely editable. Download it and make adjustments in color, background, font etc. as per your unique business setting.
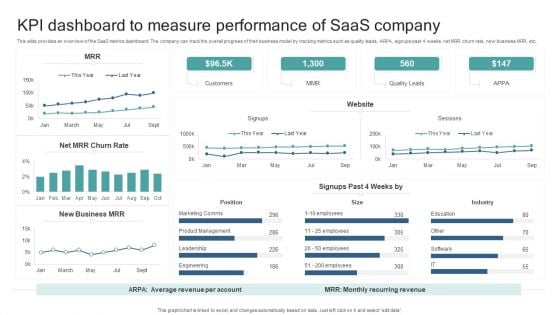
KPI Dashboard To Measure Performance Of Saas Company Introduction PDF
This slide provides an overview of the SaaS metrics dashboard. The company can track the overall progress of their business model by tracking metrics such as quality leads, ARPA, signups past 4 weeks, net MRR churn rate, new business MRR, etc. Pitch your topic with ease and precision using this KPI Dashboard To Measure Performance Of Saas Company Introduction PDF. This layout presents information on Industry, Position, Customers, Quality Leads. It is also available for immediate download and adjustment. So, changes can be made in the color, design, graphics or any other component to create a unique layout.
Pharma Medical Dashboard To Analyze Sales Strategy Performance Icons PDF
The following slide delineates a comprehensive medical dashboard which can be used by the pharma company to measure its sales strategy performance. The KPIs covered in the slide are top sales producers, sales channels, volume by product, etc. Showcasing this set of slides titled Pharma Medical Dashboard To Analyze Sales Strategy Performance Icons PDF. The topics addressed in these templates are Market Leaders, Sales Channels, Volume Product. All the content presented in this PPT design is completely editable. Download it and make adjustments in color, background, font etc. as per your unique business setting.
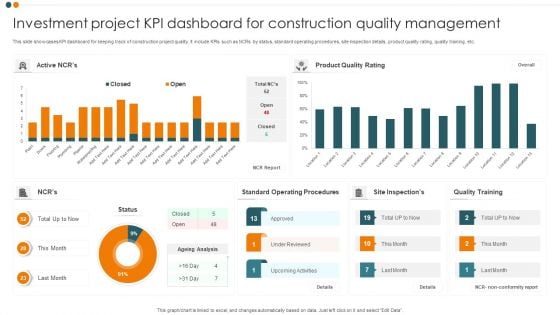
Investment Project KPI Dashboard For Construction Quality Management Pictures PDF
This slide showcases KPI dashboard for keeping track of construction project quality. It include KPIs such as NCRs by status, standard operating procedures, site inspection details, product quality rating, quality training, etc. Showcasing this set of slides titled Investment Project KPI Dashboard For Construction Quality Management Pictures PDF. The topics addressed in these templates are Product Quality Rating, Standard Operating Procedures, Quality Training. All the content presented in this PPT design is completely editable. Download it and make adjustments in color, background, font etc. as per your unique business setting.

Shopping Cart Conversion Rate Dashboard Ppt Model Graphics PDF
This slide shows shopping cart conversion rate dashboard. It includes details of online revenue share, shipping error rate, shopping cart conversion rate, coupon conversion, product views per session and revenue per visitors. Deliver an awe-inspiring pitch with this creative shopping cart conversion rate dashboard ppt model graphics pdf. bundle. Topics like shopping cart conversion rate, coupon cart conversion, product views per session, revenue per visitors, avg product views can be discussed with this completely editable template. It is available for immediate download depending on the needs and requirements of the user.
Datafy Performance Tracking Dashboard For E-Commerce Website Information PDF
This slide represents the performance tracking dashboard for an e-commerce website by covering the details of visitors and return visitors, total customers and products, the top three products and product categories, and average visit duration and purchase per visit. The best PPT templates are a great way to save time, energy, and resources. Slidegeeks have percent editable powerpoint slides making them incredibly versatile. With these quality presentation templates, you can create a captivating and memorable presentation by combining visually appealing slides and effectively communicating your message. Download Datafy Performance Tracking Dashboard For E-Commerce Website Information PDF from Slidegeeks and deliver a wonderful presentation.
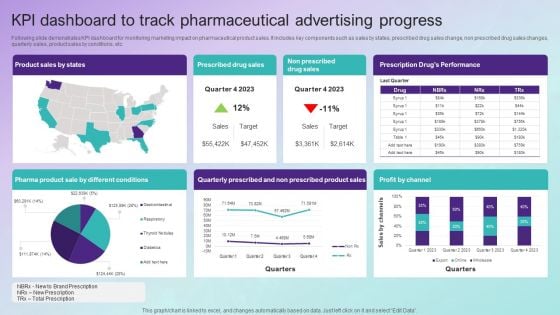
KPI Dashboard To Track Pharmaceutical Advertising Progress Topics PDF
Following slide demonstrates KPI dashboard for monitoring marketing impact on pharmaceutical product sales. It includes key components such as sales by states, prescribed drug sales change, non prescribed drug sales changes, quarterly sales, product sales by conditions, etc. Showcasing this set of slides titled KPI Dashboard To Track Pharmaceutical Advertising Progress Topics PDF. The topics addressed in these templates are Product Sales By States, Prescribed Drug Sales, Non Prescribed Drug Sales, Profit By Channel. All the content presented in this PPT design is completely editable. Download it and make adjustments in color, background, font etc. as per your unique business setting.
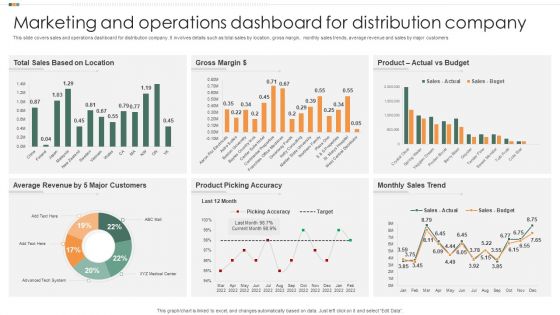
Marketing And Operations Dashboard For Distribution Company Guidelines PDF
This slide covers sales and operations dashboard for distribution company. It involves details such as total sales by location, gross margin, monthly sales trends, average revenue and sales by major customers. Pitch your topic with ease and precision using this Marketing And Operations Dashboard For Distribution Company Guidelines PDF. This layout presents information on Gross Margin, Actual Vs Budget, Product. It is also available for immediate download and adjustment. So, changes can be made in the color, design, graphics or any other component to create a unique layout.
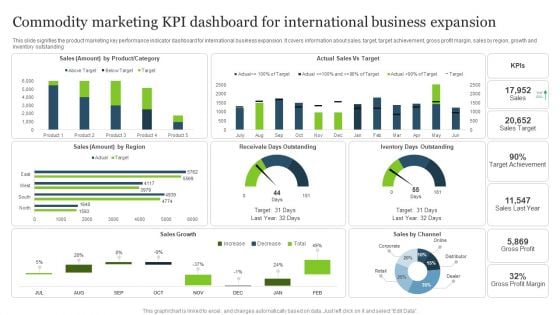
Commodity Marketing KPI Dashboard For International Business Expansion Formats PDF
This slide signifies the product marketing key performance indicator dashboard for international business expansion. It covers information about sales, target, target achievement, gross profit margin, sales by region, growth and inventory outstanding.Pitch your topic with ease and precision using this Commodity Marketing KPI Dashboard For International Business Expansion Formats PDF. This layout presents information on Target Achievement, Receivale Days, Gross Profit. It is also available for immediate download and adjustment. So, changes can be made in the color, design, graphics or any other component to create a unique layout.
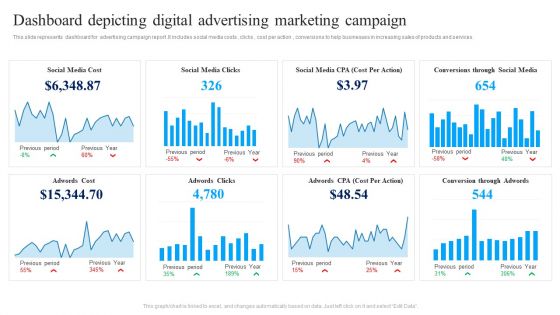
Dashboard Depicting Digital Advertising Marketing Campaign Ppt Summary Elements PDF
This slide represents dashboard for advertising campaign report .It includes social media costs , clicks , cost per action , conversions to help businesses in increasing sales of products and services. Showcasing this set of slides titled Dashboard Depicting Digital Advertising Marketing Campaign Ppt Summary Elements PDF. The topics addressed in these templates are Social Media Cost, Social Media Clicks, Adwords Clicks, Adwords Cost . All the content presented in this PPT design is completely editable. Download it and make adjustments in color, background, font etc. as per your unique business setting.
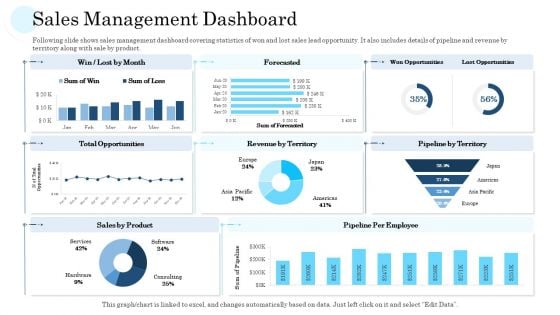
Sales Management Dashboard Ppt PowerPoint Presentation Portfolio Gallery PDF
Following slide shows sales management dashboard covering statistics of won and lost sales lead opportunity. It also includes details of pipeline and revenue by territory along with sale by product.Deliver and pitch your topic in the best possible manner with this sales management dashboard ppt powerpoint presentation portfolio gallery pdf. Use them to share invaluable insights on total opportunities, sales by product, revenue by territory, pipeline per employee and impress your audience. This template can be altered and modified as per your expectations. So, grab it now.
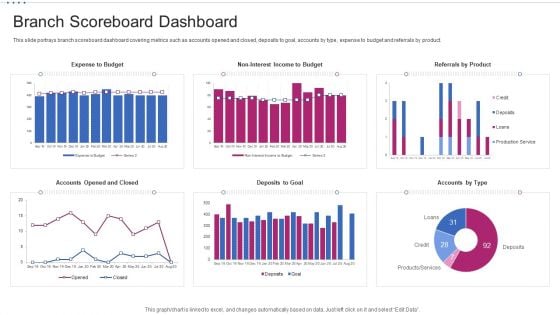
M Banking System Improving Consumer Branch Scoreboard Dashboard Demonstration PDF
This slide portrays branch scoreboard dashboard covering metrics such as accounts opened and closed, deposits to goal, accounts by type, expense to budget and referrals by product. Deliver an awe inspiring pitch with this creative m banking system improving consumer branch scoreboard dashboard demonstration pdf bundle. Topics like expense to budget, no interest income to budget, referrals by product, deposits to goal, accounts opened and closed can be discussed with this completely editable template. It is available for immediate download depending on the needs and requirements of the user.
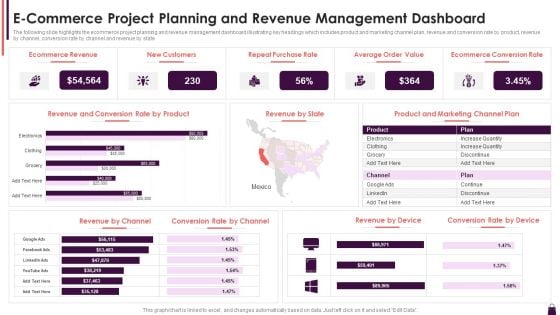
E Commerce Project Planning And Revenue Management Dashboard Introduction PDF
The following slide highlights the ecommerce project planning and revenue management dashboard illustrating key headings which includes product and marketing channel plan, revenue and conversion rate by product, revenue by channel, conversion rate by channel and revenue by state. Showcasing this set of slides titled E Commerce Project Planning And Revenue Management Dashboard Introduction PDF. The topics addressed in these templates are New Customers, Ecommerce Revenue, Repeat Purchase Rate. All the content presented in this PPT design is completely editable. Download it and make adjustments in color, background, font etc. as per your unique business setting.
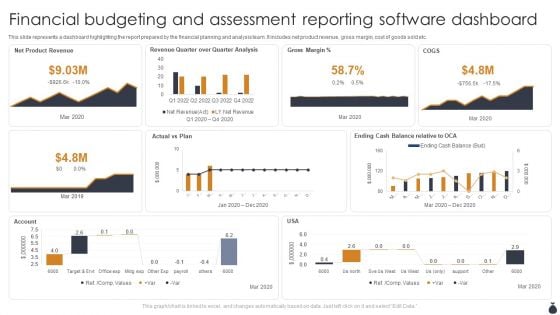
Financial Budgeting And Assessment Reporting Software Dashboard Template PDF
This slide represents a dashboard highlighting the report prepared by the financial planning and analysis team. It includes net product revenue, gross margin, cost of goods sold etc. Showcasing this set of slides titled Financial Budgeting And Assessment Reporting Software Dashboard Template PDF. The topics addressed in these templates are Net Product Revenue, Actual Vs Plan, Account. All the content presented in this PPT design is completely editable. Download it and make adjustments in color, background, font etc. as per your unique business setting.
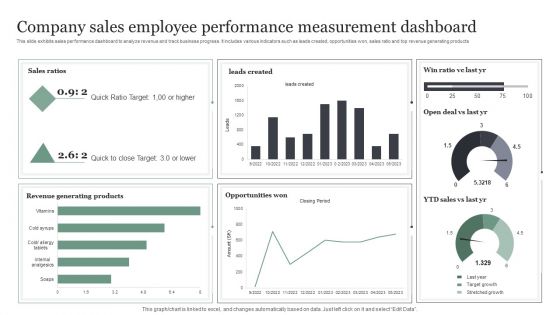
Company Sales Employee Performance Measurement Dashboard Information PDF
This slide exhibits sales performance dashboard to analyze revenue and track business progress. It includes various indicators such as leads created, opportunities won, sales ratio and top revenue generating products. Showcasing this set of slides titled Company Sales Employee Performance Measurement Dashboard Information PDF. The topics addressed in these templates are Quick Ratio Target, Opportunities Won, Revenue Generating Products. All the content presented in this PPT design is completely editable. Download it and make adjustments in color, background, font etc. as per your unique business setting.
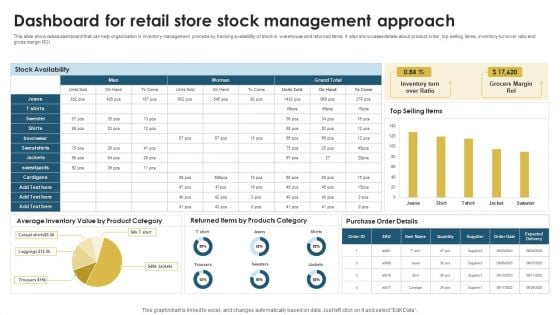
Dashboard For Retail Store Stock Management Approach Portrait PDF
This slide showcases dashboard that can help organization in inventory management process by tracking availability of stock in warehouse and returned items. It also showcases details about product order, top selling items, inventory turnover ratio and gross margin ROI. Showcasing this set of slides titled Dashboard For Retail Store Stock Management Approach Portrait PDF. The topics addressed in these templates are Average Inventory, Product Category, Inventory Turn. All the content presented in this PPT design is completely editable. Download it and make adjustments in color, background, font etc. as per your unique business setting.
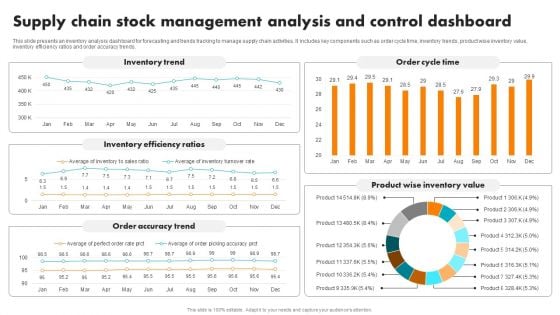
Supply Chain Stock Management Analysis And Control Dashboard Brochure PDF
This slide presents an inventory analysis dashboard for forecasting and trends tracking to manage supply chain activities. It includes key components such as order cycle time, inventory trends, product wise inventory value, inventory efficiency ratios and order accuracy trends. Pitch your topic with ease and precision using this Supply Chain Stock Management Analysis And Control Dashboard Brochure PDF. This layout presents information on Inventory Trend, Inventory Efficiency Ratios, Order Accuracy Trend, Order Cycle Time, Product Wise Inventory Value. It is also available for immediate download and adjustment. So, changes can be made in the color, design, graphics or any other component to create a unique layout.
IT Project Management Progress Tracking KPI Dashboard Template PDF
This slide provides IT project development dashboard which helps managers performance status. It provides information regarding team velocity, work in story points, product estimation status, closed story point vs epic story point and pending story points. Showcasing this set of slides titled IT Project Management Progress Tracking KPI Dashboard Template PDF. The topics addressed in these templates are Team Velocity, Product Estimation Status, Pending Story Points. All the content presented in this PPT design is completely editable. Download it and make adjustments in color, background, font etc. as per your unique business setting.
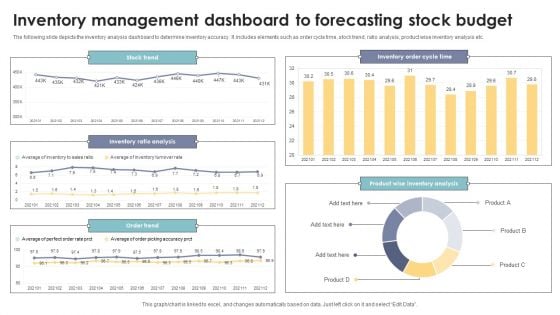
Inventory Management Dashboard To Forecasting Stock Budget Elements PDF
The following slide depicts the inventory analysis dashboard to determine inventory accuracy. It includes elements such as order cycle time, stock trend, ratio analysis, product wise inventory analysis etc. Pitch your topic with ease and precision using this Inventory Management Dashboard To Forecasting Stock Budget Elements PDF. This layout presents information on Inventory Ratio Analysis, Product Wise Inventory Analysis, Stock Trend. It is also available for immediate download and adjustment. So, changes can be made in the color, design, graphics or any other component to create a unique layout.
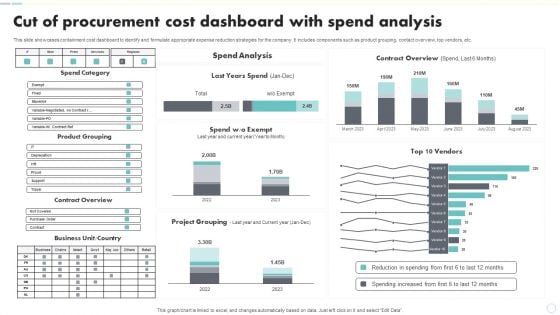
Cut Of Procurement Cost Dashboard With Spend Analysis Elements PDF
This slide showcases containment cost dashboard to identify and formulate appropriate expense reduction strategies for the company. It includes components such as product grouping, contact overview, top vendors, etc. Showcasing this set of slides titled Cut Of Procurement Cost Dashboard With Spend Analysis Elements PDF. The topics addressed in these templates are Spend Category, Product Grouping, Contract Overview. All the content presented in this PPT design is completely editable. Download it and make adjustments in color, background, font etc. as per your unique business setting.
Social Media Performance Tracking And Monitoring Dashboard Mockup PDF
The following slide showcases a dashboard to track and measure social media platforms performance. It includes key elements such as website traffic, social media referral rate, site revenue, social media site revenue, etc. This Social Media Performance Tracking And Monitoring Dashboard Mockup PDF is perfect for any presentation, be it in front of clients or colleagues. It is a versatile and stylish solution for organizing your meetings. The product features a modern design for your presentation meetings. The adjustable and customizable slides provide unlimited possibilities for acing up your presentation. Slidegeeks has done all the homework before launching the product for you. So, do not wait, grab the presentation templates today
Social Media Performance Tracking And Monitoring Dashboard Information PDF
The following slide showcases a dashboard to track and measure social media platforms performance. It includes key elements such as website traffic, social media referral rate, site revenue, social media site revenue, etc. This Social Media Performance Tracking And Monitoring Dashboard Information PDF is perfect for any presentation, be it in front of clients or colleagues. It is a versatile and stylish solution for organizing your meetings. The product features a modern design for your presentation meetings. The adjustable and customizable slides provide unlimited possibilities for acing up your presentation. Slidegeeks has done all the homework before launching the product for you. So, do not wait, grab the presentation templates today
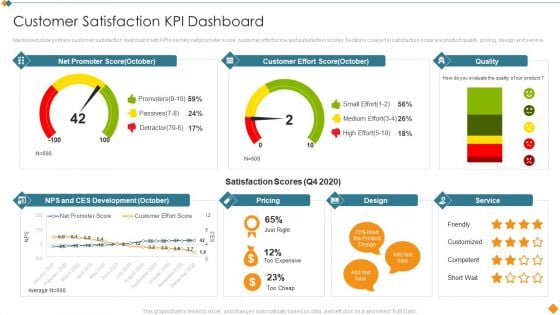
Maintaining Partner Relationships Customer Satisfaction KPI Dashboard Inspiration PDF
Mentioned slide portrays customer satisfaction dashboard with KPIs namely net promoter score, customer effort score and satisfaction scores. Sections covered in satisfaction score are product quality, pricing, design and service. Deliver and pitch your topic in the best possible manner with this Maintaining Partner Relationships Customer Satisfaction KPI Dashboard Inspiration PDF. Use them to share invaluable insights on Net Promoter Score, Customer Effort Score, Quality, Service, Pricing and impress your audience. This template can be altered and modified as per your expectations. So, grab it now.
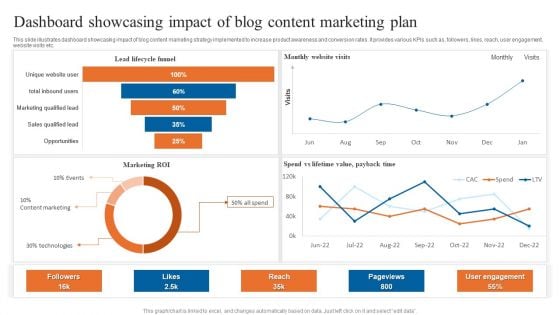
Dashboard Showcasing Impact Of Blog Content Marketing Plan Summary PDF
This slide illustrates dashboard showcasing impact of blog content marketing strategy implemented to increase product awareness and conversion rates. It provides various KPIs such as, followers, likes, reach, user engagement, website visits etc. Pitch your topic with ease and precision using this Dashboard Showcasing Impact Of Blog Content Marketing Plan Summary PDF. This layout presents information on User Engagement, Monthly Website Visits, Spend Lifetime Value, Payback Time. It is also available for immediate download and adjustment. So, changes can be made in the color, design, graphics or any other component to create a unique layout.

Sales Measurement Dashboard For ABC Carbonated Drink Company Template PDF
The slide shows the sales measurement dashboard for measuring sales effectiveness, Inventory Turnover rate, Average Time to Sell in days, Freshness duration of Products sold etc. Deliver an awe-inspiring pitch with this creative sales measurement dashboard for abc carbonated drink company template pdf. bundle. Topics like out of stock rate, inventory turnover, inventory turnover, average time to sell, average time to sell can be discussed with this completely editable template. It is available for immediate download depending on the needs and requirements of the user.
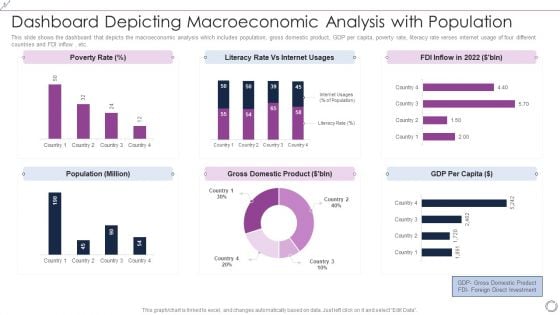
Dashboard Depicting Macroeconomic Analysis With Population Inspiration PDF
This slide shows the dashboard that depicts the macroeconomic analysis which includes population, gross domestic product, GDP per capita, poverty rate, literacy rate verses internet usage of four different countries and FDI inflow, etc. Pitch your topic with ease and precision using this Dashboard Depicting Macroeconomic Analysis With Population Inspiration PDF. This layout presents information on Poverty Rate, Literacy Rate Vs Internet Usages, FDI Inflow In 2022. It is also available for immediate download and adjustment. So, changes can be made in the color, design, graphics or any other component to create a unique layout.
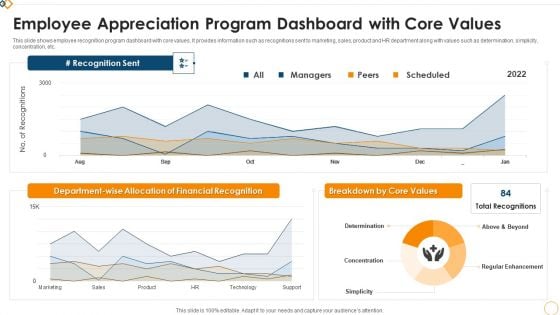
Employee Appreciation Program Dashboard With Core Values Themes PDF
This slide shows employee recognition program dashboard with core values. It provides information such as recognitions sent to marketing, sales, product and HR department along with values such as determination, simplicity, concentration, etc. Showcasing this set of slides titled Employee Appreciation Program Dashboard With Core Values Themes PDF. The topics addressed in these templates are Regular Enhancement, Determination, Concentration. All the content presented in this PPT design is completely editable. Download it and make adjustments in color, background, font etc. as per your unique business setting.
HR Dashboard To Tackle Low Output Icons PDF
This slide depicts the dashboard used by human resource management to track employee productivity rate and identify bottlenecks in performance. It includes status of tickets, occupancy and resolution rate, net promoter score and track of agents solving tickets. Showcasing this set of slides titled HR Dashboard To Tackle Low Output Icons PDF. The topics addressed in these templates are Resolution Rate, Occupancy Rate, Net Promoter Score. All the content presented in this PPT design is completely editable. Download it and make adjustments in color, background, font etc. as per your unique business setting.
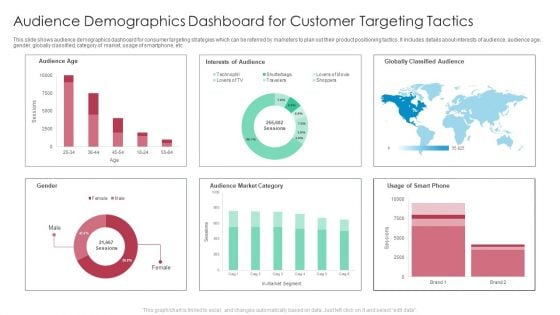
Audience Demographics Dashboard For Customer Targeting Tactics Slides PDF
This slide shows audience demographics dashboard for consumer targeting strategies which can be referred by marketers to plan out their product positioning tactics. It includes details about interests of audience, audience age, gender, globally classified, category of market, usage of smartphone, etc. Showcasing this set of slides titled Audience Demographics Dashboard For Customer Targeting Tactics Slides PDF. The topics addressed in these templates are Globally Classified Audience, Audience Market Category, Audience Age. All the content presented in this PPT design is completely editable. Download it and make adjustments in color, background, font etc. as per your unique business setting.
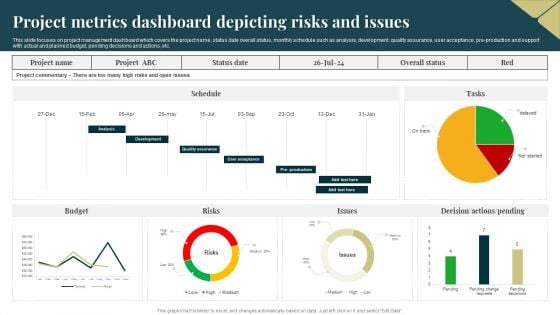
Project Metrics Dashboard Depicting Risks And Issues Rules PDF
This slide focuses on project management dashboard which covers the project name, status date overall status, monthly schedule such as analysis, development, quality assurance, user acceptance, pre production and support with actual and planned budget, pending decisions and actions, etc. Showcasing this set of slides titled Project Metrics Dashboard Depicting Risks And Issues Rules PDF. The topics addressed in these templates are Budget, Risks, Project. All the content presented in this PPT design is completely editable. Download it and make adjustments in color, background, font etc. as per your unique business setting.
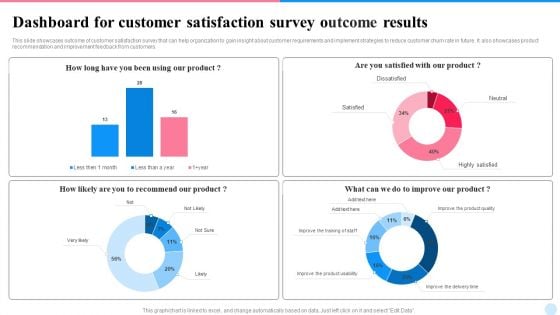
Dashboard For Customer Satisfaction Survey Outcome Results Topics PDF
This slide showcases outcome of customer satisfaction survey that can help organization to gain insight about customer requirements and implement strategies to reduce customer churn rate in future. It also showcases product recommendation and improvement feedback from customers. Pitch your topic with ease and precision using this Dashboard For Customer Satisfaction Survey Outcome Results Topics PDF. This layout presents information on Dashboard, Customer Satisfaction, Survey Outcome Results. It is also available for immediate download and adjustment. So, changes can be made in the color, design, graphics or any other component to create a unique layout.

 Home
Home