Dashboards Construction
Optimize Brand Valuation Product Branding Performance Tracking Dashboard Background PDF
This slide provides information regarding product branding performance tracking dashboard in terms of revenues, new customers, customer satisfaction rate. Create an editable Optimize Brand Valuation Product Branding Performance Tracking Dashboard Background PDF that communicates your idea and engages your audience. Whether you are presenting a business or an educational presentation, pre-designed presentation templates help save time. Optimize Brand Valuation Product Branding Performance Tracking Dashboard Background PDF is highly customizable and very easy to edit, covering many different styles from creative to business presentations. Slidegeeks has creative team members who have crafted amazing templates. So, go and get them without any delay.
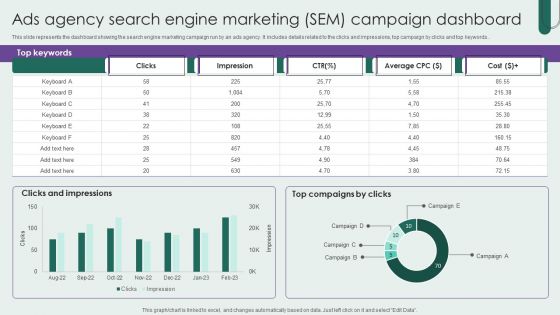
Ads Agency Search Engine Marketing Sem Campaign Dashboard Graphics PDF
This slide represents the dashboard showing the search engine marketing campaign run by an ads agency. It includes details related to the clicks and impressions, top campaign by clicks and top keywords. Showcasing this set of slides titled Ads Agency Search Engine Marketing Sem Campaign Dashboard Graphics PDF. The topics addressed in these templates are Ads Agency Search Engine Marketing, Campaign Dashboard. All the content presented in this PPT design is completely editable. Download it and make adjustments in color, background, font etc. as per your unique business setting.
KPI Dashboard For Tracking Marcom Mix Strategy Progress Ideas PDF
Following slide showcases marketing mix progress monitoring dashboard to determine business performance. It includes elements such as clicks, impressions, click through rate, conversion rate, cost per click and monthly overview to Google ads. Showcasing this set of slides titled KPI Dashboard For Tracking Marcom Mix Strategy Progress Ideas PDF. The topics addressed in these templates are Kpi Dashboard, Tracking Marcom, Mix Strategy Progress. All the content presented in this PPT design is completely editable. Download it and make adjustments in color, background, font etc. as per your unique business setting.

Branding Management Dashboard With Sales Volume Mockup PDF
This slide presents KPI dashboard indicating brand performance helpful in tracking sales and promotion. Price, location, merchandising and overall output can be useful for improving performance visibility and providing actionable insights. Showcasing this set of slides titled Branding Management Dashboard With Sales Volume Mockup PDF. The topics addressed in these templates are Branding Management Dashboard, Sales Volume. All the content presented in this PPT design is completely editable. Download it and make adjustments in color, background, font etc. as per your unique business setting.
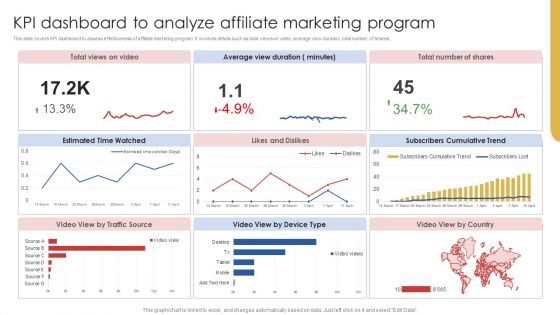
KPI Dashboard To Analyze Affiliate Marketing Program Rules PDF
This slide covers KPI dashboard to assess effectiveness of affiliate marketing program. It involves details such as total views on video, average view duration, total number of shares. Create an editable KPI Dashboard To Analyze Affiliate Marketing Program Rules PDF that communicates your idea and engages your audience. Whether you are presenting a business or an educational presentation, pre-designed presentation templates help save time. KPI Dashboard To Analyze Affiliate Marketing Program Rules PDF is highly customizable and very easy to edit, covering many different styles from creative to business presentations. Slidegeeks has creative team members who have crafted amazing templates. So, go and get them without any delay.

KPI Dashboard To Assess Medical Information Clipart PDF
This slide covers dashboard to analyze medical information. It involves details such as bed occupancy, average medical cost, admission vs. readmission rate and patient population by urgency type. Get a simple yet stunning designed KPI Dashboard To Assess Medical Information Clipart PDF. It is the best one to establish the tone in your meetings. It is an excellent way to make your presentations highly effective. So, download this PPT today from Slidegeeks and see the positive impacts. Our easy to edit KPI Dashboard To Assess Medical Information Clipart PDF can be your go to option for all upcoming conferences and meetings. So, what are you waiting for Grab this template today.

Business Intelligence Dashboard For Food And Beverage Industry Diagrams PDF
This slide showcases BI dashboard to track overall performance of business operations. It further includes elements such as sales, total transactions, non labor margin, expenses by category, etc. Pitch your topic with ease and precision using this Business Intelligence Dashboard For Food And Beverage Industry Diagrams PDF. This layout presents information on Expenses, Sales, Business Intelligence Dashboard. It is also available for immediate download and adjustment. So, changes can be made in the color, design, graphics or any other component to create a unique layout.
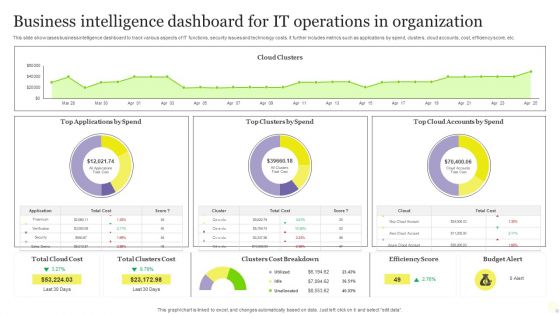
Business Intelligence Dashboard For It Operations In Organization Themes PDF
This slide showcases business intelligence dashboard to track various aspects of IT functions, security issues and technology costs. It further includes metrics such as applications by spend, clusters, cloud accounts, cost, efficiency score, etc. Showcasing this set of slides titled Business Intelligence Dashboard For It Operations In Organization Themes PDF. The topics addressed in these templates are Business Intelligence Dashboard, IT Operations, Organization. All the content presented in this PPT design is completely editable. Download it and make adjustments in color, background, font etc. as per your unique business setting.
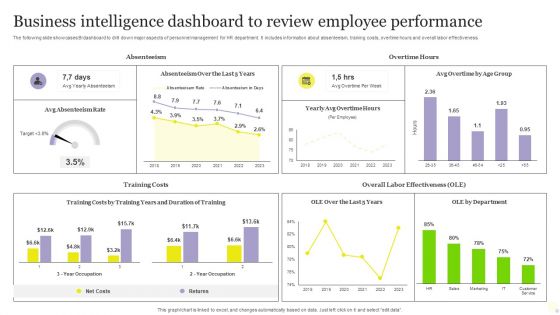
Business Intelligence Dashboard To Review Employee Performance Pictures PDF
The following slide showcases BI dashboard to drill down major aspects of personnel management for HR department. It includes information about absenteeism, training costs, overtime hours and overall labor effectiveness. Showcasing this set of slides titled Business Intelligence Dashboard To Review Employee Performance Pictures PDF. The topics addressed in these templates are Business Intelligence Dashboard, Review Employee Performance. All the content presented in this PPT design is completely editable. Download it and make adjustments in color, background, font etc. as per your unique business setting.
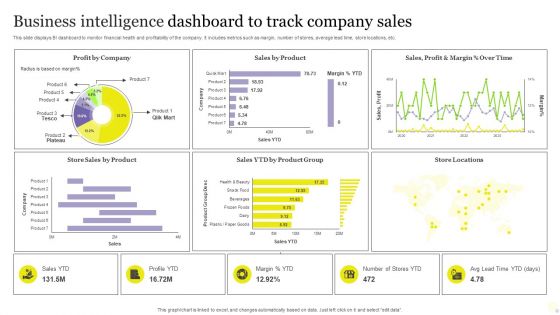
Business Intelligence Dashboard To Track Company Sales Rules PDF
This slide displays BI dashboard to monitor financial health and profitability of the company. It includes metrics such as margin, number of stores, average lead time, store locations, etc. Showcasing this set of slides titled Business Intelligence Dashboard To Track Company Sales Rules PDF. The topics addressed in these templates are Business Intelligence Dashboard, Track Company Sales. All the content presented in this PPT design is completely editable. Download it and make adjustments in color, background, font etc. as per your unique business setting.

Recurring Income Generation Model Recurring Revenue Dashboard Pictures PDF
The following slide display recurring revenue generated over the year, the following dashboard displays MRR, churn rate net recurring revenue and growth rate. Explore a selection of the finest Recurring Income Generation Model Recurring Revenue Dashboard Pictures PDF here. With a plethora of professionally designed and pre made slide templates, you can quickly and easily find the right one for your upcoming presentation. You can use our Recurring Income Generation Model Recurring Revenue Dashboard Pictures PDF to effectively convey your message to a wider audience. Slidegeeks has done a lot of research before preparing these presentation templates. The content can be personalized and the slides are highly editable. Grab templates today from Slidegeeks.
Biomarker Categorization Dashboard For Digital Biomarkers Tracking Background PDF
This slide represents the dashboard for digital biomarkers tracking, and it covers details about coughing, talking, physical activity, respiration, cardiac activity, body orientation, and snoring, including the date and time of these activities. Create an editable Biomarker Categorization Dashboard For Digital Biomarkers Tracking Background PDF that communicates your idea and engages your audience. Whether youre presenting a business or an educational presentation, pre designed presentation templates help save time. Biomarker Categorization Dashboard For Digital Biomarkers Tracking Background PDF is highly customizable and very easy to edit, covering many different styles from creative to business presentations. Slidegeeks has creative team members who have crafted amazing templates. So, go and get them without any delay.

Recruitment Funnel Dashboard Indicating Multiple Stages Of Hiring Ideas PDF
This slide showcases recruitment funnel dashboard which helps recruiters access multiple stages of hiring. It provides details about applied, evaluation, review, interview, offer acceptance, etc. Get a simple yet stunning designed Recruitment Funnel Dashboard Indicating Multiple Stages Of Hiring Ideas PDF. It is the best one to establish the tone in your meetings. It is an excellent way to make your presentations highly effective. So, download this PPT today from Slidegeeks and see the positive impacts. Our easy to edit Recruitment Funnel Dashboard Indicating Multiple Stages Of Hiring Ideas PDF can be your go to option for all upcoming conferences and meetings. So, what are you waiting for Grab this template today.

Customer Service Dashboard Showcasing User Experience Introduction PDF
This slide represents customer service dashboard showcasing user experience. It includes request volume, revenue, customer satisfaction, customer retention etc. Create an editable Customer Service Dashboard Showcasing User Experience Introduction PDF that communicates your idea and engages your audience. Whether you are presenting a business or an educational presentation, pre designed presentation templates help save time. Customer Service Dashboard Showcasing User Experience Introduction PDF is highly customizable and very easy to edit, covering many different styles from creative to business presentations. Slidegeeks has creative team members who have crafted amazing templates. So, go and get them without any delay.

Project Management Dashboard For Tracking Cost Time Analysis Background PDF
This slide depicts the project management dashboard used to track the cost and schedule performance and ensure it does not exceed estimated levels. It includes overall health, task at hand, schedule and cost tracker, progress and current workload. Pitch your topic with ease and precision using this Project Management Dashboard For Tracking Cost Time Analysis Background PDF. This layout presents information on Project Management Dashboard, Tracking Cost Time Analysis. It is also available for immediate download and adjustment. So, changes can be made in the color, design, graphics or any other component to create a unique layout.
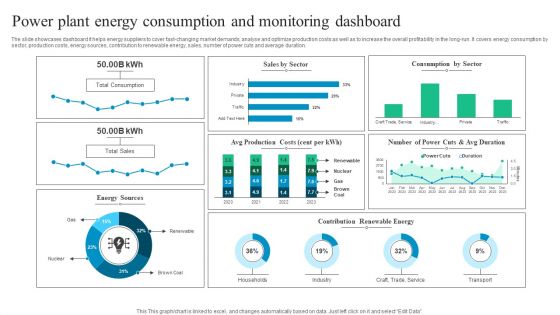
Power Plant Energy Consumption And Monitoring Dashboard Diagrams PDF
The slide showcases dashboard it helps energy suppliers to cover fast-changing market demands, analyse and optimize production costs as well as to increase the overall profitability in the long-run. It covers energy consumption by sector, production costs, energy sources, contribution to renewable energy, sales, number of power cuts and average duration. Pitch your topic with ease and precision using this Power Plant Energy Consumption And Monitoring Dashboard Diagrams PDF. This layout presents information on Power Plant Energy Consumption, Monitoring Dashboard. It is also available for immediate download and adjustment. So, changes can be made in the color, design, graphics or any other component to create a unique layout.
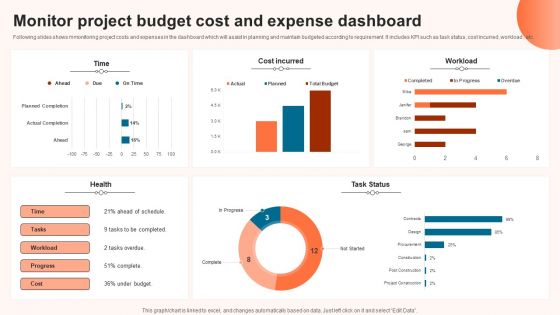
Monitor Project Budget Cost And Expense Dashboard Brochure PDF
Following slides shows mmonitoring project costs and expenses in the dashboard which will assist in planning and maintain budgeted according to requirement. It includes KPI such as task status, cost incurred ,workload , etc. Pitch your topic with ease and precision using this Monitor Project Budget Cost And Expense Dashboard Brochure PDF. This layout presents information on Expense Dashboard, Monitor Project Budget Cost. It is also available for immediate download and adjustment. So, changes can be made in the color, design, graphics or any other component to create a unique layout.

Retail Risk Management Dashboard To Track Incidents Professional PDF
The following slide illustrates a safety dashboard for the retail industry. The purpose of this slide is to track various metrics related to store security. It includes the number of incidents, incident location, safety evaluation score,risk assessment, safety training completion rate, and fire drill evacuations. Showcasing this set of slides titled Retail Risk Management Dashboard To Track Incidents Professional PDF. The topics addressed in these templates are Risk Evaluation, Retail Risk Management Dashboard, Track Incidents. All the content presented in this PPT design is completely editable. Download it and make adjustments in color, background, font etc. as per your unique business setting.

Vendor Performance Management KPI Dashboard To Track Deliveries Graphics PDF
This slide exhibits a supplier quality dashboard used by healthcare organizations to replace low performers. It includes elements such as top suppliers, bottom suppliers, defects by product, complaints by category, etc. Showcasing this set of slides titled Vendor Performance Management KPI Dashboard To Track Deliveries Graphics PDF. The topics addressed in these templates are Vendor Performance Management, KPI Dashboard, Track Deliveries. All the content presented in this PPT design is completely editable. Download it and make adjustments in color, background, font etc. as per your unique business setting.
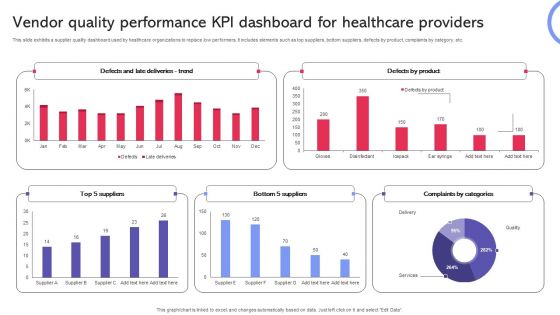
Vendor Quality Performance KPI Dashboard For Healthcare Providers Introduction PDF
This slide exhibits a supplier quality dashboard used by healthcare organizations to replace low performers. It includes elements such as top suppliers, bottom suppliers, defects by product, complaints by category, etc. Showcasing this set of slides titled Vendor Quality Performance KPI Dashboard For Healthcare Providers Introduction PDF. The topics addressed in these templates are Vendor Quality, Performance KPI Dashboard, Healthcare Providers. All the content presented in this PPT design is completely editable. Download it and make adjustments in color, background, font etc. as per your unique business setting.
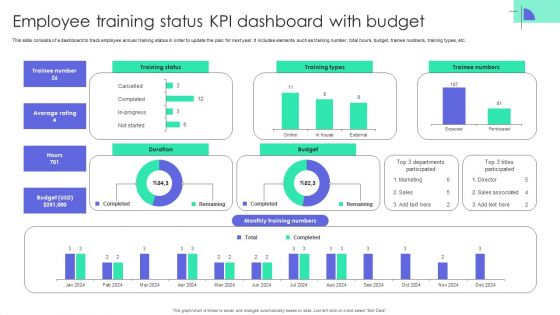
Employee Training Status KPI Dashboard With Budget Summary PDF
This slide consists of a dashboard to track employee annual training status in order to update the plan for next year. It includes elements such as training number, total hours, budget, trainee numbers, training types, etc. Pitch your topic with ease and precision using this Employee Training Status KPI Dashboard With Budget Summary PDF. This layout presents information on Employee Training Status, KPI Dashboard With Budget. It is also available for immediate download and adjustment. So, changes can be made in the color, design, graphics or any other component to create a unique layout.

Corporate Scam Risk Analysis Report KPI Dashboard Themes PDF
Following slides show the report dashboard on corporate fraud risk which will assist in creating fraud prevention strategies .It includes KPI such as risk matrix, transaction split , transaction alert, etc. Pitch your topic with ease and precision using this Corporate Scam Risk Analysis Report KPI Dashboard Themes PDF. This layout presents information on Global Transaction Flow, Risk Matrix, Transaction Split, Analysis Report Kpi Dashboard. It is also available for immediate download and adjustment. So, changes can be made in the color, design, graphics or any other component to create a unique layout.
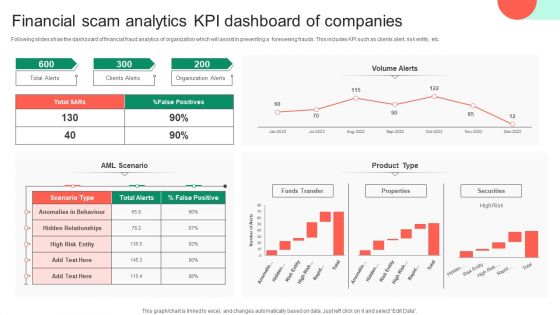
Financial Scam Analytics KPI Dashboard Of Companies Clipart PDF
Following slides show the dashboard of financial fraud analytics of organization which will assist in preventing a foreseeing frauds. This includes KPI such as clients alert, risk entity, etc. Pitch your topic with ease and precision using this Financial Scam Analytics KPI Dashboard Of Companies Clipart PDF. This layout presents information on Financial Scam Analytics, Kpi Dashboard Of Companies. It is also available for immediate download and adjustment. So, changes can be made in the color, design, graphics or any other component to create a unique layout.

Operational Scam Detection KPI Dashboard Of Company Topics PDF
Following slides shows the dashboard for operational fraud detection which will assist in identifying internal and external risks that could significantly affect their assets, reputation, and exposure to legal action. The KPI such as total profiles analyzed, yearly fraud analysis. Pitch your topic with ease and precision using this Operational Scam Detection KPI Dashboard Of Company Topics PDF. This layout presents information on Profiles Analyzed, Operational Scam Detection, Kpi Dashboard Of Company. It is also available for immediate download and adjustment. So, changes can be made in the color, design, graphics or any other component to create a unique layout.
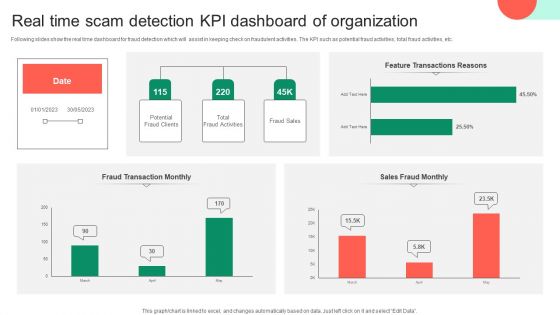
Real Time Scam Detection KPI Dashboard Of Organization Information PDF
Following slides show the real time dashboard for fraud detection which will assist in keeping check on fraudulent activities. The KPI such as potential fraud activities, total fraud activities, etc. Pitch your topic with ease and precision using this Real Time Scam Detection KPI Dashboard Of Organization Information PDF. This layout presents information on Real Time Scam Detection, Kpi Dashboard Of Organization. It is also available for immediate download and adjustment. So, changes can be made in the color, design, graphics or any other component to create a unique layout.

Scam Prevention Startup KPI Dashboard For Ecommerce Themes PDF
Following slides show the startup dashboard for fraud protection in e-commerce which will assist in identifies developing and fresh fraud attacks. The KPI such as active merchants, covered merchants, approved volume. Pitch your topic with ease and precision using this Scam Prevention Startup KPI Dashboard For Ecommerce Themes PDF. This layout presents information on Approved Volume, Chargebacks Rate, Kpi Dashboard For Ecommerce. It is also available for immediate download and adjustment. So, changes can be made in the color, design, graphics or any other component to create a unique layout.
Tracking Expenditure Incurred On Cloud Deployment Dashboard Download PDF
The following slide highlights cloud implementation expenditure dashboard to determine overspend, unused resources, plan future costs, available discounts, customization options etc. It includes components such as cloud native, software, departments, cost centre etc. Pitch your topic with ease and precision using this Tracking Expenditure Incurred On Cloud Deployment Dashboard Download PDF. This layout presents information on Dashboard, Tracking, Deployment. It is also available for immediate download and adjustment. So, changes can be made in the color, design, graphics or any other component to create a unique layout.
Tracking Performance Of Cloud Storage Deployment Dashboard Portrait PDF
The following slide highlights implementation of cloud storage performance tracking dashboard to improve innovation, to attain faster time to market. It includes components such as pinned folders, storage usage, recently used files, documents, images, videos, music, fonts, projects etc. Showcasing this set of slides titled Tracking Performance Of Cloud Storage Deployment Dashboard Portrait PDF. The topics addressed in these templates are Storage Usage, Dashboard, Tracking. All the content presented in this PPT design is completely editable. Download it and make adjustments in color, background, font etc. as per your unique business setting.
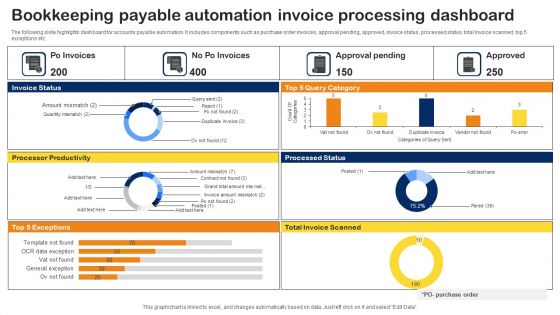
Bookkeeping Payable Automation Invoice Processing Dashboard Summary PDF
The following slide highlights dashboard for accounts payable automation. It includes components such as purchase order invoices, approval pending, approved, invoice status, processed status, total invoice scanned, top 5 exceptions etc. Showcasing this set of slides titled Bookkeeping Payable Automation Invoice Processing Dashboard Summary PDF. The topics addressed in these templates are Processor Productivity, Bookkeeping Payable Automation, Invoice Processing Dashboard. All the content presented in this PPT design is completely editable. Download it and make adjustments in color, background, font etc. as per your unique business setting.

Online Bookkeeping And Finance Automation Dashboard Topics PDF
The following slide highlights dashboard for accounting and finance automation. It includes components such as bank balance, accounts receivable, accounts payable, income, expenses, overdue amount, overdue invoices, over time accounts receivable and payable, invoice anticipated details by customers etc. Pitch your topic with ease and precision using this Online Bookkeeping And Finance Automation Dashboard Topics PDF. This layout presents information on Online Bookkeeping, Finance Automation Dashboard. It is also available for immediate download and adjustment. So, changes can be made in the color, design, graphics or any other component to create a unique layout.
Business Intelligence Dashboard Icon To Analyze Industry Trends Topics PDF
Persuade your audience using this Business Intelligence Dashboard Icon To Analyze Industry Trends Topics PDF. This PPT design covers three stages, thus making it a great tool to use. It also caters to a variety of topics including Business Intelligence Dashboard Icon, Analyze Industry Trends. Download this PPT design now to present a convincing pitch that not only emphasizes the topic but also showcases your presentation skills.
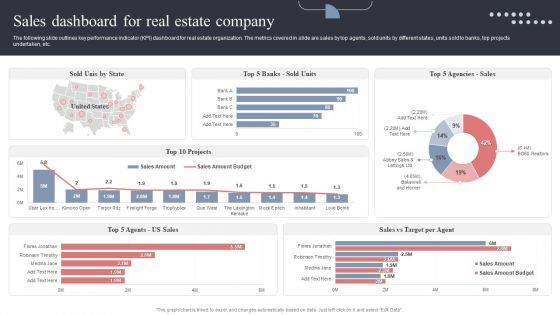
Sales Dashboard For Real Estate Company Topics PDF
The following slide outlines key performance indicator KPI dashboard for real estate organization. The metrics covered in slide are sales by top agents, sold units by different states, units sold to banks, top projects undertaken, etc. This Sales Dashboard For Real Estate Company Topics PDF is perfect for any presentation, be it in front of clients or colleagues. It is a versatile and stylish solution for organizing your meetings. The Sales Dashboard For Real Estate Company Topics PDF features a modern design for your presentation meetings. The adjustable and customizable slides provide unlimited possibilities for acing up your presentation. Slidegeeks has done all the homework before launching the product for you. So, do not wait, grab the presentation templates today
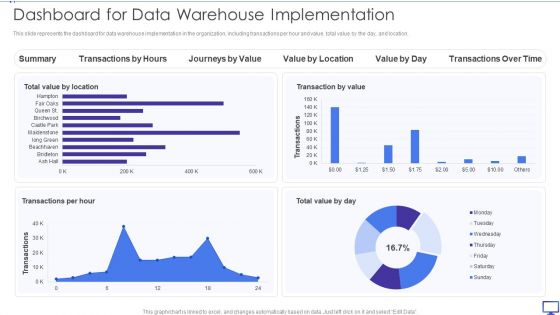
Decision Support System Dashboard For Data Warehouse Implementation Designs PDF
This slide represents the dashboard for data warehouse implementation in the organization, including transactions per hour and value, total value by the day, and location. Deliver an awe inspiring pitch with this creative Decision Support System Dashboard For Data Warehouse Implementation Designs PDF bundle. Topics like Transactions Per Hour, Total Value Day, Transactions Over Time can be discussed with this completely editable template. It is available for immediate download depending on the needs and requirements of the user.
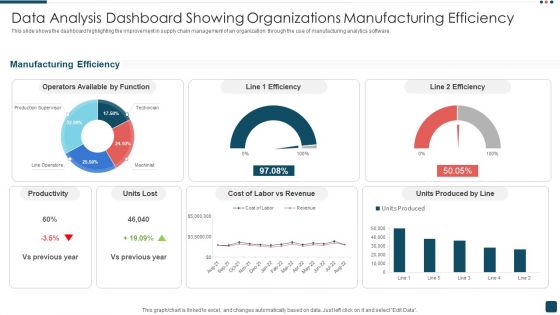
Data Analysis Dashboard Showing Organizations Manufacturing Efficiency Demonstration PDF
This slide shows the dashboard highlighting the improvement in supply chain management of an organization through the use of manufacturing analytics software. Pitch your topic with ease and precision using this Data Analysis Dashboard Showing Organizations Manufacturing Efficiency Demonstration PDF. This layout presents information on Productivity, Revenue, Manufacturing Efficiency. It is also available for immediate download and adjustment. So, changes can be made in the color, design, graphics or any other component to create a unique layout.

Manufacturing Data Analysis Dashboard Of Supply Chain Management Background PDF
This slide shows the dashboard highlighting the improvement in supply chain management of an organization through the use of manufacturing analytics software. Showcasing this set of slides titled Manufacturing Data Analysis Dashboard Of Supply Chain Management Background PDF. The topics addressed in these templates are Shipping Costs, Service, Risk. All the content presented in this PPT design is completely editable. Download it and make adjustments in color, background, font etc. as per your unique business setting.
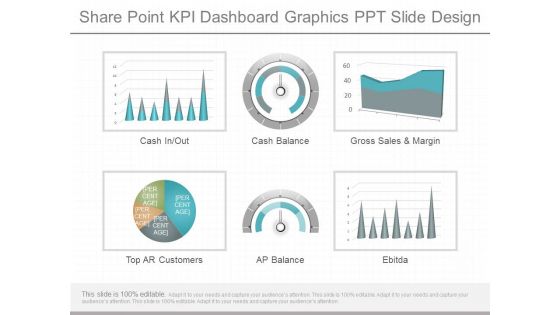
Share Point Kpi Dashboard Graphics Ppt Slide Design
This is a share point kpi dashboard graphics ppt slide design. This is a six stage process. The stages in this process are cash in out, cash balance, gross sales and margin, top ar customers, ap balance, ebitda.
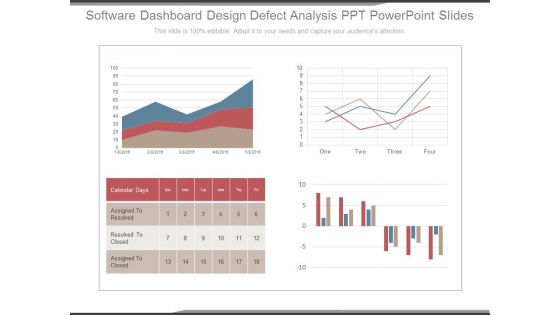
Software Dashboard Design Defect Analysis Ppt Powerpoint Slides
This is a software dashboard design defect analysis ppt powerpoint slides. This is a four stage process. The stages in this process are calendar days, assigned to resolved, resolved to closed, assigned to closed.
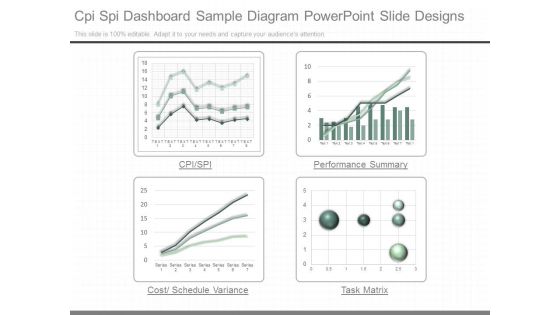
Cpi Spi Dashboard Sample Diagram Powerpoint Slide Designs
This is a cpi spi dashboard sample diagram powerpoint slide designs. This is a four stage process. The stages in this process are cpi spi, performance summary, cost schedule variance, task matrix.

Monthly Social Media Dashboard Ppt PowerPoint Presentation Background Designs
This is a monthly social media dashboard ppt powerpoint presentation background designs. This is a four stage process. The stages in this process are business, finance, marketing, strategy, analysis, success.

Crm Dashboard Project Management Ppt PowerPoint Presentation Professional Background Designs
This is a crm dashboard project management ppt powerpoint presentation professional background designs. This is a two stage process. The stages in this process are total projects, projects on hold, overdue projects, available resources, schedule.
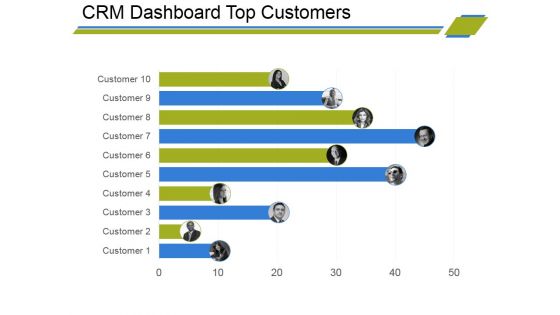
Crm Dashboard Top Customers Ppt PowerPoint Presentation Styles Designs
This is a crm dashboard top customers ppt powerpoint presentation styles designs. This is a ten stage process. The stages in this process are business, customer, finance, bar graph, marketing, strategy, analysis.
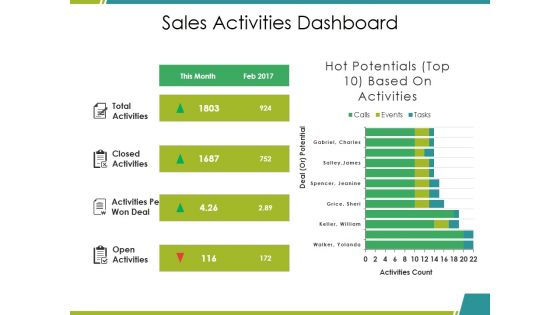
Sales Activities Dashboard Ppt PowerPoint Presentation Slides Designs Download
This is a sales activities dashboard ppt powerpoint presentation slides designs download. This is a four stage process. The stages in this process are total activities, closed activities, activities per won deal, open activities, activities count.

Sales Performance Dashboard Ppt PowerPoint Presentation Show Graphics Design
This is a sales performance dashboard ppt powerpoint presentation show graphics design. This is a two stage process. The stages in this process are sales comparison, sales by product category, rankings, customer satisfaction, revenue.
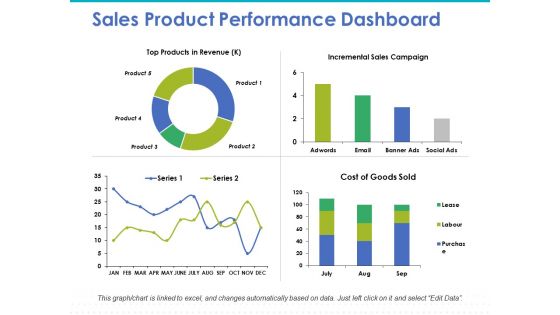
Sales Product Performance Dashboard Ppt PowerPoint Presentation Model Graphics Design
This is a sales product performance dashboard ppt powerpoint presentation model graphics design. This is a four stage process. The stages in this process are top products in revenue, incremental sales, cost of goods.

Project Management Dashboard Planning Ppt PowerPoint Presentation Ideas Graphics Design
This is a project management dashboard planning ppt powerpoint presentation ideas graphics design. This is a four stage process. The stages in this process are business, management, marketing, percentage.
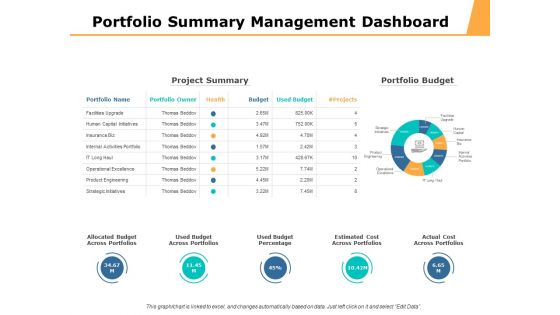
Portfolio Summary Management Dashboard Ppt PowerPoint Presentation File Design Templates
This is a portfolio summary management dashboard ppt powerpoint presentation file design templates. This is a five stage process. The stages in this process are percentage product, business, management, marketing.

Sales Performance Dashboard Marketing Ppt PowerPoint Presentation Slides Graphics Design
This is a sales performance dashboard marketing ppt powerpoint presentation slides graphics design. This is a four stage process. The stages in this process are compare, marketing, business, management, planning.
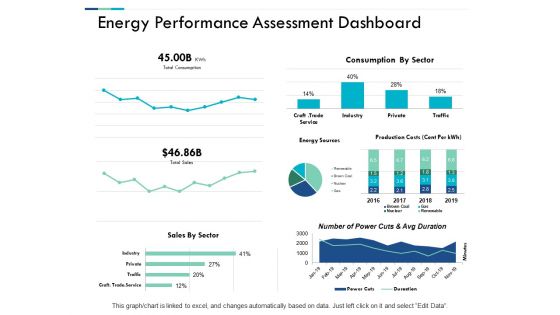
Energy Performance Assessment Dashboard Ppt PowerPoint Presentation Inspiration Background Designs
This is a energy performance assessment dashboard ppt powerpoint presentation inspiration background designs. The topics discussed in this diagram are finance, marketing, management, investment, analysis. This is a completely editable PowerPoint presentation, and is available for immediate download.

B2B Ecommerce Dashboard To Track Website Performance Designs PDF
This slide represents metric dashboard to track and analyze b2b ecommerce website performance. It covers total user visits, sales, average return per user etc. Presenting this PowerPoint presentation, titled B2B Ecommerce Dashboard To Track Website Performance Designs PDF, with topics curated by our researchers after extensive research. This editable presentation is available for immediate download and provides attractive features when used. Download now and captivate your audience. Presenting this B2B Ecommerce Dashboard To Track Website Performance Designs PDF. Our researchers have carefully researched and created these slides with all aspects taken into consideration. This is a completely customizable B2B Ecommerce Dashboard To Track Website Performance Designs PDF that is available for immediate downloading. Download now and make an impact on your audience. Highlight the attractive features available with our PPTs.
Statistical Data Dashboard Icon Depicting Analytical Figures Sample PDF
Persuade your audience using this statistical data dashboard icon depicting analytical figures sample pdf. This PPT design covers four stages, thus making it a great tool to use. It also caters to a variety of topics including statistical data dashboard icon depicting analytical figures. Download this PPT design now to present a convincing pitch that not only emphasizes the topic but also showcases your presentation skills.
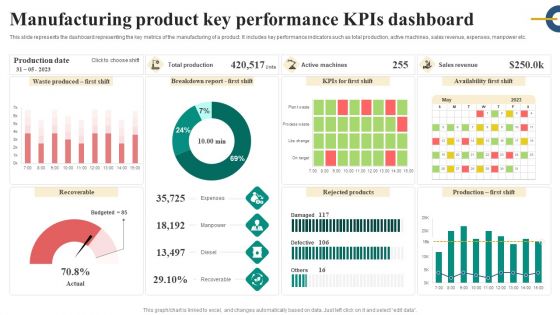
Manufacturing Product Key Performance Kpis Dashboard Inspiration PDF
This slide represents the dashboard representing the key metrics of the manufacturing of a product. It includes key performance indicators such as total production, active machines, sales revenue, expenses, manpower etc. Showcasing this set of slides titled Manufacturing Product Key Performance Kpis Dashboard Inspiration PDF. The topics addressed in these templates are Expenses, Manpower, Diesel, Recoverable. All the content presented in this PPT design is completely editable. Download it and make adjustments in color, background, font etc. as per your unique business setting.

Cart Recovery Dashboard Revenue Ppt Portfolio Design Templates PDF
Measure which email campaigns brought the most recovery, which age group responded the best, and other KPIs via a dashboard. Deliver an awe-inspiring pitch with this creative cart recovery dashboard revenue ppt portfolio design templates pdf bundle. Topics like recovery revenue, recovery rate, revenue per email can be discussed with this completely editable template. It is available for immediate download depending on the needs and requirements of the user.

Capital Investment Options Vendor Compliance Kpi Dashboard Designs PDF
Mentioned slide displays vendor compliance KPI dashboard. KPIs covered are top supplier by partner status, average procurement cycle time and average procurement cycle. Deliver an awe inspiring pitch with this creative Capital Investment Options Vendor Compliance Kpi Dashboard Designs PDF bundle. Topics like Average Procurement, Cycle Time, Confirmation, Order Placement can be discussed with this completely editable template. It is available for immediate download depending on the needs and requirements of the user.
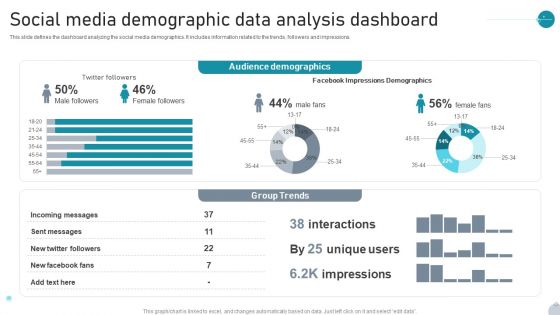
Social Media Demographic Data Analysis Dashboard Infographics PDF
This slide defines the dashboard analyzing the social media demographics. It includes information related to the trends, followers and impressions. Pitch your topic with ease and precision using this Social Media Demographic Data Analysis Dashboard Infographics PDF. This layout presents information on Audience Demographics, Group Trends, Impressions Demographics It is also available for immediate download and adjustment. So, changes can be made in the color, design, graphics or any other component to create a unique layout.

Third Party Vendors Risk Metrics Performance Indicators Dashboard Topics PDF
This slide illustrates graphical representation of risk key performance indicators. It includes third party vendors trust score, impact score and risk score. Pitch your topic with ease and precision using this Third Party Vendors Risk Metrics Performance Indicators Dashboard Topics PDF. This layout presents information on Third Party Vendors Risk Metrics Performance Indicators Dashboard. It is also available for immediate download and adjustment. So, changes can be made in the color, design, graphics or any other component to create a unique layout.
Icon For Risk Metrics Performance Indicators Dashboard Designs PDF
Persuade your audience using this Icon For Risk Metrics Performance Indicators Dashboard Designs PDF. This PPT design covers four stages, thus making it a great tool to use. It also caters to a variety of topics including Icon For Risk Metrics Performance Indicators Dashboard. Download this PPT design now to present a convincing pitch that not only emphasizes the topic but also showcases your presentation skills.
Banking Services Delivery And Management Dashboard Icon Designs PDF
Persuade your audience using this Banking Services Delivery And Management Dashboard Icon Designs PDF. This PPT design covers three stages, thus making it a great tool to use. It also caters to a variety of topics including Banking Services Delivery, Management Dashboard Icon. Download this PPT design now to present a convincing pitch that not only emphasizes the topic but also showcases your presentation skills.

Project Problem And Mitigation Summary Dashboard Designs PDF
The following slide highlights the project issues and their status to mitigate its adverse effect. It constitutes of no. of issues reported, resolved, issue trend, resolve time analysis etc. Showcasing this set of slides titled Project Problem And Mitigation Summary Dashboard Designs PDF. The topics addressed in these templates are Analysis, Project, Mitigation Summary Dashboard. All the content presented in this PPT design is completely editable. Download it and make adjustments in color, background, font etc. as per your unique business setting.
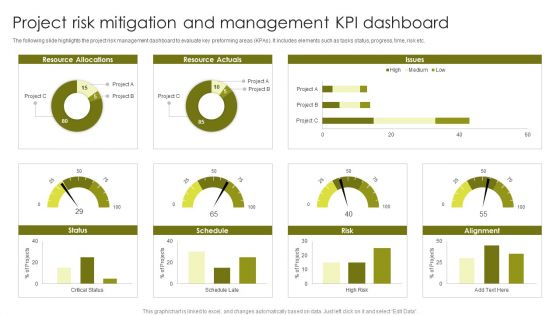
Project Risk Mitigation And Management KPI Dashboard Designs PDF
The following slide highlights the project risk management dashboard to evaluate key preforming areas KPAs. It includes elements such as tasks status, progress, time, risk etc. Pitch your topic with ease and precision using this Project Risk Mitigation And Management KPI Dashboard Designs PDF. This layout presents information on Resource Actuals, Resource Allocations, Risk. It is also available for immediate download and adjustment. So, changes can be made in the color, design, graphics or any other component to create a unique layout.

Financial Budgeting And Assessment Dashboard With Revenue Variance Designs PDF
This slide shows the dashboard representing financial analysis and planning of an organization. It highlights the set revenue targets and actual revenue with the help of graphs. Showcasing this set of slides titled Financial Budgeting And Assessment Dashboard With Revenue Variance Designs PDF. The topics addressed in these templates are YTD Revenue, Revenue Delta, Revenue Variance. All the content presented in this PPT design is completely editable. Download it and make adjustments in color, background, font etc. as per your unique business setting.

 Home
Home