Dashboard Icon
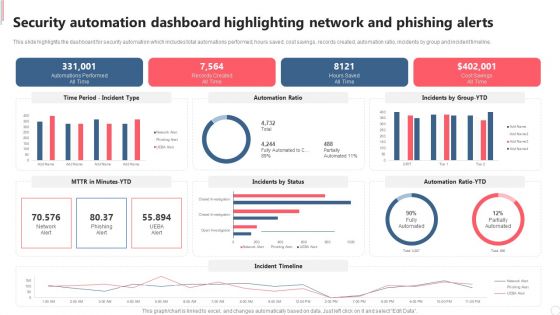
Security Automation Dashboard Highlighting Network And Phishing Alerts Demonstration PDF
This slide highlights the dashboard for security automation which includes total automations performed, hours saved, cost savings, records created, automation ratio, incidents by group and incident timeline. Welcome to our selection of the Security Automation Dashboard Highlighting Network And Phishing Alerts Demonstration PDF. These are designed to help you showcase your creativity and bring your sphere to life. Planning and Innovation are essential for any business that is just starting out. This collection contains the designs that you need for your everyday presentations. All of our PowerPoints are 100 percent editable, so you can customize them to suit your needs. This multi purpose template can be used in various situations. Grab these presentation templates today.

Security Automation Dashboard Highlighting Network And Phishing Alerts Microsoft PDF
This slide highlights the dashboard for security automation which includes total automations performed, hours saved, cost savings, records created, automation ratio, incidents by group and incident timeline. This modern and well arranged Security Automation Dashboard Highlighting Network And Phishing Alerts Microsoft PDF provides lots of creative possibilities. It is very simple to customize and edit with the Powerpoint Software. Just drag and drop your pictures into the shapes. All facets of this template can be edited with Powerpoint no extra software is necessary. Add your own material, put your images in the places assigned for them, adjust the colors, and then you can show your slides to the world, with an animated slide included.

Strategies To Select Effective Price Optimization Dashboard Graphics PDF
This template covers the details of price optimization which focuses on number of visitors, customers, revenues, performance by devices, etc. Here you can discover an assortment of the finest PowerPoint and Google Slides templates. With these templates, you can create presentations for a variety of purposes while simultaneously providing your audience with an eye-catching visual experience. Download Strategies To Select Effective Price Optimization Dashboard Graphics PDF to deliver an impeccable presentation. These templates will make your job of preparing presentations much quicker, yet still, maintain a high level of quality. Slidegeeks has experienced researchers who prepare these templates and write high-quality content for you. Later on, you can personalize the content by editing the Strategies To Select Effective Price Optimization Dashboard Graphics PDF.
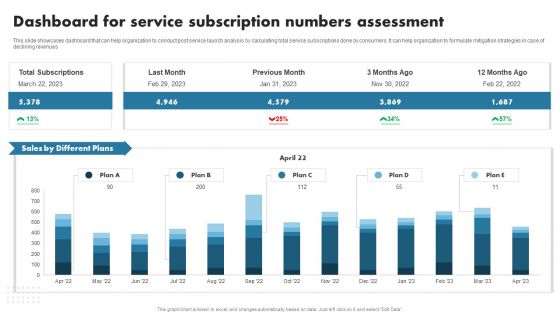
Enhancing Customer Outreach Dashboard For Service Subscription Numbers Template PDF
This slide showcases dashboard that can help organization to conduct post service launch analysis by calculating total service subscriptions done by consumers. It can help organization to formulate mitigation strategies in case of declining revenues. This Enhancing Customer Outreach Dashboard For Service Subscription Numbers Template PDF from Slidegeeks makes it easy to present information on your topic with precision. It provides customization options, so you can make changes to the colors, design, graphics, or any other component to create a unique layout. It is also available for immediate download, so you can begin using it right away. Slidegeeks has done good research to ensure that you have everything you need to make your presentation stand out. Make a name out there for a brilliant performance.
Elastic NLB Network Load Balancers Performance Tracker Dashboard Background PDF
This slide shows the dashboard for tracking the network load balancers performance by covering details of balancer status, balancer session, balancer throughput, etc. Coming up with a presentation necessitates that the majority of the effort goes into the content and the message you intend to convey. The visuals of a PowerPoint presentation can only be effective if it supplements and supports the story that is being told. Keeping this in mind our experts created Elastic NLB Network Load Balancers Performance Tracker Dashboard Background PDF to reduce the time that goes into designing the presentation. This way, you can concentrate on the message while our designers take care of providing you with the right template for the situation.
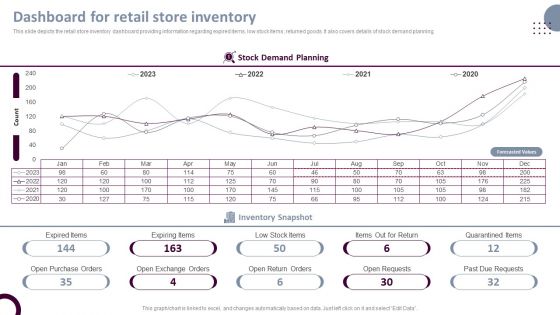
Retail Store Operations Dashboard For Retail Store Inventory Demonstration PDF
This slide depicts the retail store inventory dashboard providing information regarding expired items, low stock items, returned goods. It also covers details of stock demand planning. Are you in need of a template that can accommodate all of your creative concepts This one is crafted professionally and can be altered to fit any style. Use it with Google Slides or PowerPoint. Include striking photographs, symbols, depictions, and other visuals. Fill, move around, or remove text boxes as desired. Test out color palettes and font mixtures. Edit and save your work, or work with colleagues. Download Retail Store Operations Dashboard For Retail Store Inventory Demonstration PDF and observe how to make your presentation outstanding. Give an impeccable presentation to your group and make your presentation unforgettable.

Integration Automation Dashboard For Monthly Procurement Process Automated Introduction PDF
This slide presents a dashboard for monthly procurement activities in an organization. It includes number of suppliers, contract attainted, supplier share, top supplier report, average procurement cycle time, etc. Slidegeeks is here to make your presentations a breeze with Integration Automation Dashboard For Monthly Procurement Process Automated Introduction PDF With our easy-to-use and customizable templates, you can focus on delivering your ideas rather than worrying about formatting. With a variety of designs to choose from, youre sure to find one that suits your needs. And with animations and unique photos, illustrations, and fonts, you can make your presentation pop. So whether youre giving a sales pitch or presenting to the board, make sure to check out Slidegeeks first.

Optimizing Social Networks Social Media Campaign Performance Dashboard Guidelines PDF
This slide shows social media promotional campaign performance dashboard. It provides information about followers, reach, clicks, leads, shares, likes, comments, engagement, etc. Coming up with a presentation necessitates that the majority of the effort goes into the content and the message you intend to convey. The visuals of a PowerPoint presentation can only be effective if it supplements and supports the story that is being told. Keeping this in mind our experts created Optimizing Social Networks Social Media Campaign Performance Dashboard Guidelines PDF to reduce the time that goes into designing the presentation. This way, you can concentrate on the message while our designers take care of providing you with the right template for the situation.
Dashboard For Tracking Brand Awareness Advertisement Campaign Results Designs PDF
This slide showcases dashboard that can help organization to track results of online advertisement campaigns. Its key components ad impressions, click through rate, cost per conversion, revenue per click, impressions, new users and sessions.Are you in need of a template that can accommodate all of your creative concepts This one is crafted professionally and can be altered to fit any style. Use it with Google Slides or PowerPoint. Include striking photographs, symbols, depictions, and other visuals. Fill, move around, or remove text boxes as desired. Test out color palettes and font mixtures. Edit and save your work, or work with colleagues. Download Dashboard For Tracking Brand Awareness Advertisement Campaign Results Designs PDF and observe how to make your presentation outstanding. Give an impeccable presentation to your group and make your presentation unforgettable.
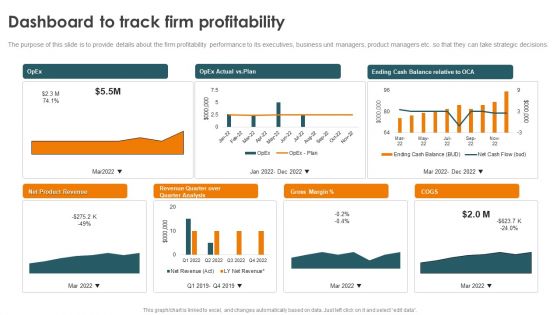
Profitability Modelling Framework Dashboard To Track Firm Profitability Topics PDF
The purpose of this slide is to provide details about the firm profitability performance to its executives, business unit managers, product managers etc. so that they can take strategic decisions. Find highly impressive Profitability Modelling Framework Dashboard To Track Firm Profitability Topics PDF on Slidegeeks to deliver a meaningful presentation. You can save an ample amount of time using these presentation templates. No need to worry to prepare everything from scratch because Slidegeeks experts have already done a huge research and work for you. You need to download Profitability Modelling Framework Dashboard To Track Firm Profitability Topics PDF for your upcoming presentation. All the presentation templates are 100 percent editable and you can change the color and personalize the content accordingly. Download now.
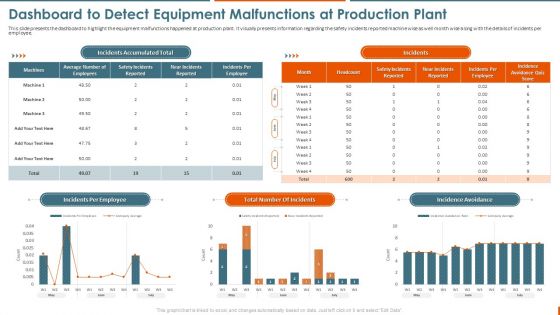
Maintenance Administration Dashboard To Detect Equipment Malfunctions At Guidelines PDF
This slide presents the dashboard to highlight the equipment malfunctions happened at production plant. It visually presents information regarding the safety incidents reported machine wise as well month wise along with the details of incidents per employee. Slidegeeks is one of the best resources for PowerPoint templates. You can download easily and regulate Maintenance Administration Dashboard To Detect Equipment Malfunctions At Guidelines PDF for your personal presentations from our wonderful collection. A few clicks is all it takes to discover and get the most relevant and appropriate templates. Use our Templates to add a unique zing and appeal to your presentation and meetings. All the slides are easy to edit and you can use them even for advertisement purposes.

Improving Technology Based Dashboard Highlighting Candidate Onboarding Tasks Information PDF
This slide showcases dashboard helpful in measuring tasks and progress related to candidate onboarding. It provides information about monthly onboarding, onboarding by department, open tasks, overdue, accounts, human resource, etc. Slidegeeks is here to make your presentations a breeze with Improving Technology Based Dashboard Highlighting Candidate Onboarding Tasks Information PDF With our easy-to-use and customizable templates, you can focus on delivering your ideas rather than worrying about formatting. With a variety of designs to choose from, youre sure to find one that suits your needs. And with animations and unique photos, illustrations, and fonts, you can make your presentation pop. So whether youre giving a sales pitch or presenting to the board, make sure to check out Slidegeeks first.

Dashboard To Analyze Impact Of Warehouse Management System Infographics PDF
This slide covers cost analysis for implementing automation procurement tools in logistics and supply chain management. It involves optimization tools, cost involved on monthly basis and its impact on operations. Get a simple yet stunning designed Dashboard To Analyze Impact Of Warehouse Management System Infographics PDF. It is the best one to establish the tone in your meetings. It is an excellent way to make your presentations highly effective. So, download this PPT today from Slidegeeks and see the positive impacts. Our easy-to-edit Dashboard To Analyze Impact Of Warehouse Management System Infographics PDF can be your go-to option for all upcoming conferences and meetings. So, what are you waiting for. Grab this template today.
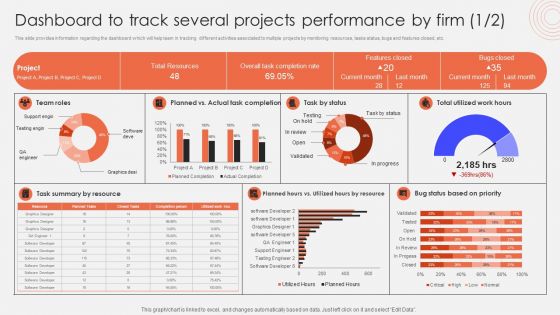
Dashboard To Track Several Projects Performance By Firm Designs PDF
This slide provides information regarding the dashboard which will help team in tracking different activities associated to multiple projects by monitoring resources, tasks status, bugs and features closed, etc. Are you in need of a template that can accommodate all of your creative concepts This one is crafted professionally and can be altered to fit any style. Use it with Google Slides or PowerPoint. Include striking photographs, symbols, depictions, and other visuals. Fill, move around, or remove text boxes as desired. Test out color palettes and font mixtures. Edit and save your work, or work with colleagues. Download Dashboard To Track Several Projects Performance By Firm Designs PDF and observe how to make your presentation outstanding. Give an impeccable presentation to your group and make your presentation unforgettable.
Social Media Marketing Performance Tracking Dashboard Inspiration PDF
Following slide displays KPI dashboard that can be used to monitor the performance of social media marketing campaign. Metrics covered are related to fans number, engagement rate and page impressions.This Social Media Marketing Performance Tracking Dashboard Inspiration PDF from Slidegeeks makes it easy to present information on your topic with precision. It provides customization options, so you can make changes to the colors, design, graphics, or any other component to create a unique layout. It is also available for immediate download, so you can begin using it right away. Slidegeeks has done good research to ensure that you have everything you need to make your presentation stand out. Make a name out there for a brilliant performance.
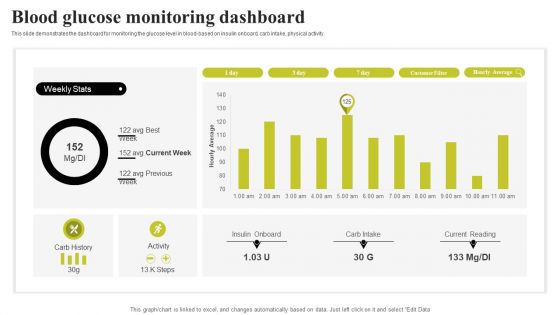
Biochip Technology Blood Glucose Monitoring Dashboard Infographics PDF
This slide demonstrates the dashboard for monitoring the glucose level in blood based on insulin onboard, carb intake, physical activity. Are you in need of a template that can accommodate all of your creative concepts This one is crafted professionally and can be altered to fit any style. Use it with Google Slides or PowerPoint. Include striking photographs, symbols, depictions, and other visuals. Fill, move around, or remove text boxes as desired. Test out color palettes and font mixtures. Edit and save your work, or work with colleagues. Download Biochip Technology Blood Glucose Monitoring Dashboard Infographics PDF and observe how to make your presentation outstanding. Give an impeccable presentation to your group and make your presentation unforgettable.

KPI Dashboard To Monitor Workforce Diversity Portrait PDF
This slide illustrates the KPI dashboard for workforce diversity providing details regarding headcount by seniority, gender and gender. It also provides information regarding monthly median age by gender and women at senior level forecast. Welcome to our selection of the KPI Dashboard To Monitor Workforce Diversity Portrait PDF. These are designed to help you showcase your creativity and bring your sphere to life. Planning and Innovation are essential for any business that is just starting out. This collection contains the designs that you need for your everyday presentations. All of our PowerPoints are 100 percent editable, so you can customize them to suit your needs. This multi purpose template can be used in various situations. Grab these presentation templates today.

Tactical Communication Plan Dashboard Depicting Customer Service Insights Graphics PDF
This slide shows the dashboard that depicts customer service insights which includes number of solved tickets, average resolution and response time, customer feedback, total visitors and chats. Coming up with a presentation necessitates that the majority of the effort goes into the content and the message you intend to convey. The visuals of a PowerPoint presentation can only be effective if it supplements and supports the story that is being told. Keeping this in mind our experts created Tactical Communication Plan Dashboard Depicting Customer Service Insights Graphics PDF to reduce the time that goes into designing the presentation. This way, you can concentrate on the message while our designers take care of providing you with the right template for the situation.

Kpi Dashboard To Measure Talent Performance Brochure PDF
This slide represents dashboard to measure talent performance in organization. It includes talent applicant status, team training methods, talented candidate status, risk for loss of potential talent pool etc. Are you in need of a template that can accommodate all of your creative concepts This one is crafted professionally and can be altered to fit any style. Use it with Google Slides or PowerPoint. Include striking photographs, symbols, depictions, and other visuals. Fill, move around, or remove text boxes as desired. Test out color palettes and font mixtures. Edit and save your work, or work with colleagues. Download Kpi Dashboard To Measure Talent Performance Brochure PDF and observe how to make your presentation outstanding. Give an impeccable presentation to your group and make your presentation unforgettable.
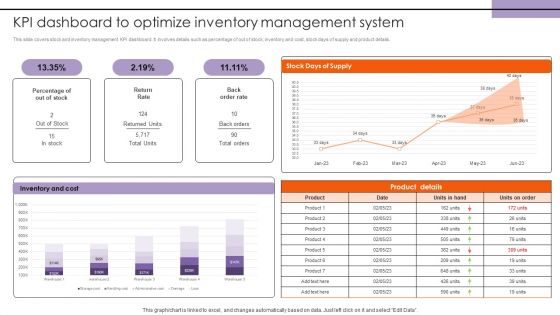
KPI Dashboard To Optimize Inventory Management System Structure PDF
This slide covers stock and inventory management KPI dashboard. It involves details such as percentage of out of stock, inventory and cost, stock days of supply and product details. This KPI Dashboard To Optimize Inventory Management System Structure PDF from Slidegeeks makes it easy to present information on your topic with precision. It provides customization options, so you can make changes to the colors, design, graphics, or any other component to create a unique layout. It is also available for immediate download, so you can begin using it right away. Slidegeeks has done good research to ensure that you have everything you need to make your presentation stand out. Make a name out there for a brilliant performance.
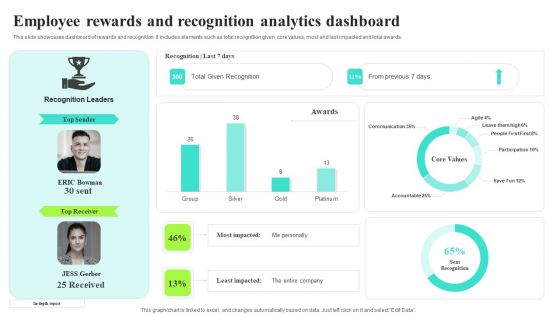
Employee Rewards And Recognition Analytics Dashboard Rules PDF
This slide showcases dashboard of rewards and recognition. It includes elements such as total recognition given, core values, most and last impacted and total awards. Are you in need of a template that can accommodate all of your creative concepts This one is crafted professionally and can be altered to fit any style. Use it with Google Slides or PowerPoint. Include striking photographs, symbols, depictions, and other visuals. Fill, move around, or remove text boxes as desired. Test out color palettes and font mixtures. Edit and save your work, or work with colleagues. Download Employee Rewards And Recognition Analytics Dashboard Rules PDF and observe how to make your presentation outstanding. Give an impeccable presentation to your group and make your presentation unforgettable.
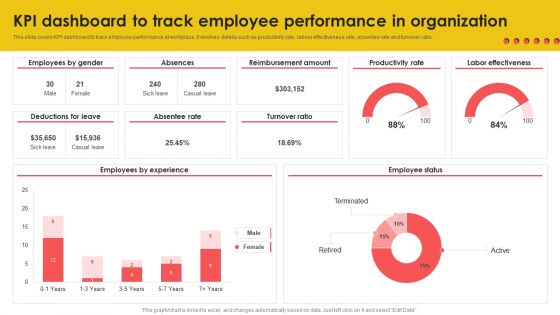
KPI Dashboard To Track Employee Performance In Organization Background PDF
This slide covers KPI dashboard to track employee performance at workplace. It involves details such as productivity rate, labour effectiveness rate, absentee rate and turnover ratio. This KPI Dashboard To Track Employee Performance In Organization Background PDF from Slidegeeks makes it easy to present information on your topic with precision. It provides customization options, so you can make changes to the colors, design, graphics, or any other component to create a unique layout. It is also available for immediate download, so you can begin using it right away. Slidegeeks has done good research to ensure that you have everything you need to make your presentation stand out. Make a name out there for a brilliant performance.

Transaction Monitoring And Approval Management Dashboard Ideas PDF
This slide showcases transaction monitoring and approval management dashboard. It provides details about last transactions, type, standard know your customer KYC, accredited investors, legal entities, etc. Coming up with a presentation necessitates that the majority of the effort goes into the content and the message you intend to convey. The visuals of a PowerPoint presentation can only be effective if it supplements and supports the story that is being told. Keeping this in mind our experts created Transaction Monitoring And Approval Management Dashboard Ideas PDF to reduce the time that goes into designing the presentation. This way, you can concentrate on the message while our designers take care of providing you with the right template for the situation.

Corporate Training Program Dashboard For Training Program Evaluation Summary PDF
This slide showcases dashboard that can help organization to evaluate the training program implemented in organization. Its key components are training cost, number of participants, hours of training, cost per participant and occupancy rate Are you in need of a template that can accommodate all of your creative concepts This one is crafted professionally and can be altered to fit any style. Use it with Google Slides or PowerPoint. Include striking photographs, symbols, depictions, and other visuals. Fill, move around, or remove text boxes as desired. Test out color palettes and font mixtures. Edit and save your work, or work with colleagues. Download Corporate Training Program Dashboard For Training Program Evaluation Summary PDF and observe how to make your presentation outstanding. Give an impeccable presentation to your group and make your presentation unforgettable.

KPI Dashboard To Assess Training Program Effectiveness Background PDF
This slide covers KPI dashboard to assess training program effectiveness. It involves details such as overall responses on monthly basis, employee satisfaction rate, net promoter score and major training courses. This KPI Dashboard To Assess Training Program Effectiveness Background PDF from Slidegeeks makes it easy to present information on your topic with precision. It provides customization options, so you can make changes to the colors, design, graphics, or any other component to create a unique layout. It is also available for immediate download, so you can begin using it right away. Slidegeeks has done good research to ensure that you have everything you need to make your presentation stand out. Make a name out there for a brilliant performance.

Dashboard To Monitor Company Linkedin Page Performance Portrait PDF
This slide covers report to track performance of the companys business profile on LinkedIn. The purpose of this template is to provide an overview to the user to evaluate the pages performance and optimize the profile to improve outcomes. It includes tracking based on followers, CTR, engagement rate on company updates, page impressions, reach, etc. Create an editable Dashboard To Monitor Company Linkedin Page Performance Portrait PDF that communicates your idea and engages your audience. Whether you are presenting a business or an educational presentation, pre designed presentation templates help save time. Dashboard To Monitor Company Linkedin Page Performance Portrait PDF is highly customizable and very easy to edit, covering many different styles from creative to business presentations. Slidegeeks has creative team members who have crafted amazing templates. So, go and get them without any delay.
Tracking Marketing Campaign Performance With Dashboard Analysis Information PDF
This slide provides glimpse about analyzing performance of different marketing campaigns. It includes parameters such as conversion rate percent, Return on Ad Spend ROAS, monthly website traffic in MM, etc. Do you have to make sure that everyone on your team knows about any specific topic I yes, then you should give Tracking Marketing Campaign Performance With Dashboard Analysis Information PDF a try. Our experts have put a lot of knowledge and effort into creating this impeccable Tracking Marketing Campaign Performance With Dashboard Analysis Information PDF. You can use this template for your upcoming presentations, as the slides are perfect to represent even the tiniest detail. You can download these templates from the Slidegeeks website and these are easy to edit. So grab these today.

Dashboard Highlighting Internal Recruitment Sources And Costs Portrait PDF
This slide illustrates dashboard for recruiting employees internally. It provides information about sourcing status, yield ratio, hiring pipeline, positions filled, recruitment costs, hire cost per team, etc. This Dashboard Highlighting Internal Recruitment Sources And Costs Portrait PDF from Slidegeeks makes it easy to present information on your topic with precision. It provides customization options, so you can make changes to the colors, design, graphics, or any other component to create a unique layout. It is also available for immediate download, so you can begin using it right away. Slidegeeks has done good research to ensure that you have everything you need to make your presentation stand out. Make a name out there for a brilliant performance.
Website Performance Tracking And Monitoring Dashboard Inspiration PDF
The following slide showcases a dashboard to track and measure website performance. It includes key elements such as visits, average session duration, bounce rate, page views, goal conversion, visits by week, traffic sources, top channels by conversions, etc. Welcome to our selection of the Website Performance Tracking And Monitoring Dashboard Inspiration PDF. These are designed to help you showcase your creativity and bring your sphere to life. Planning and Innovation are essential for any business that is just starting out. This collection contains the designs that you need for your everyday presentations. All of our PowerPoints are 100 percent editable, so you can customize them to suit your needs. This multi purpose template can be used in various situations. Grab these presentation templates today.

Dashboard For Software Defined Networking SDN Ppt Slides Images PDF
This slide depicts the dashboard for the software-defined network by covering details of bandwidth administrator, traffic quality, active flows, development tools, completed tasks, wide-area network bandwidth, and G drive. Coming up with a presentation necessitates that the majority of the effort goes into the content and the message you intend to convey. The visuals of a PowerPoint presentation can only be effective if it supplements and supports the story that is being told. Keeping this in mind our experts created Dashboard For Software Defined Networking SDN Ppt Slides Images PDF to reduce the time that goes into designing the presentation. This way, you can concentrate on the message while our designers take care of providing you with the right template for the situation.
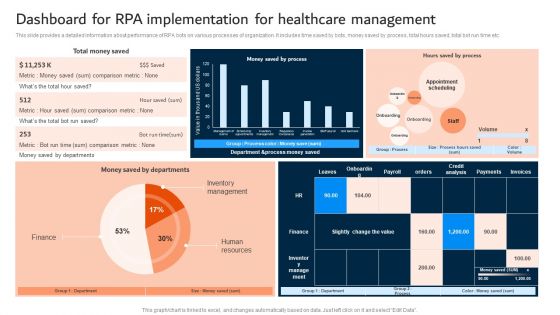
Dashboard For RPA Implementation For Healthcare Management Slides PDF
This slide provides a detailed information about performance of RPA bots on various processes of organization. It includes time saved by bots, money saved by process, total hours saved, total bot run time etc. Formulating a presentation can take up a lot of effort and time, so the content and message should always be the primary focus. The visuals of the PowerPoint can enhance the presenters message, so our Dashboard For RPA Implementation For Healthcare Management Slides PDF was created to help save time. Instead of worrying about the design, the presenter can concentrate on the message while our designers work on creating the ideal templates for whatever situation is needed. Slidegeeks has experts for everything from amazing designs to valuable content, we have put everything into Dashboard For RPA Implementation For Healthcare Management Slides PDF.
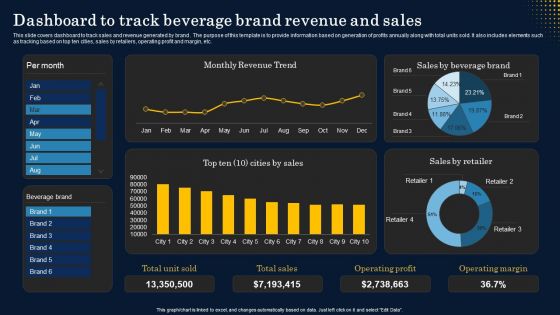
Dashboard To Track Beverage Brand Revenue And Sales Structure PDF
This slide covers dashboard to track sales and revenue generated by brand . The purpose of this template is to provide information based on generation of profits annually along with total units sold. It also includes elements such as tracking based on top ten cities, sales by retailers, operating profit and margin, etc. Are you in need of a template that can accommodate all of your creative concepts This one is crafted professionally and can be altered to fit any style. Use it with Google Slides or PowerPoint. Include striking photographs, symbols, depictions, and other visuals. Fill, move around, or remove text boxes as desired. Test out color palettes and font mixtures. Edit and save your work, or work with colleagues. Download Dashboard To Track Beverage Brand Revenue And Sales Structure PDF and observe how to make your presentation outstanding. Give an impeccable presentation to your group and make your presentation unforgettable.

Employee Retention And Turnover Rates Monitoring Dashboard Professional PDF
This slide showcases a dashboard to supervise and monitor employee retention and turnover score. It includes key components such as active employees, hires, exits, retention rate, turnover rate, etc. Coming up with a presentation necessitates that the majority of the effort goes into the content and the message you intend to convey. The visuals of a PowerPoint presentation can only be effective if it supplements and supports the story that is being told. Keeping this in mind our experts created Employee Retention And Turnover Rates Monitoring Dashboard Professional PDF to reduce the time that goes into designing the presentation. This way, you can concentrate on the message while our designers take care of providing you with the right template for the situation.

Skill Enhancement Plan Dashboard To Track Employee Performance Microsoft PDF
This slide showcases dashboard that can help organization to track on job training program. Its key components are absenteeism rate, overtime hours, training duration and cost and overall labor effectiveness rate. Present like a pro with Skill Enhancement Plan Dashboard To Track Employee Performance Microsoft PDF Create beautiful presentations together with your team, using our easy-to-use presentation slides. Share your ideas in real-time and make changes on the fly by downloading our templates. So whether you are in the office, on the go, or in a remote location, you can stay in sync with your team and present your ideas with confidence. With Slidegeeks presentation got a whole lot easier. Grab these presentations today.
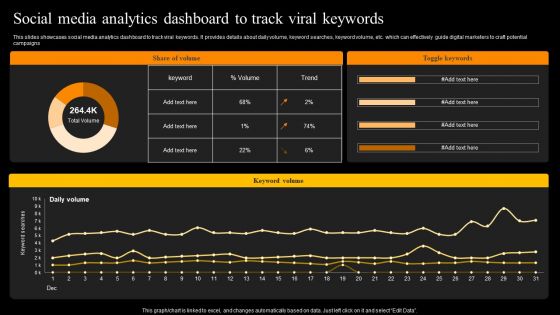
Social Media Analytics Dashboard To Track Viral Keywords Structure PDF
This slides showcases social media analytics dashboard to track viral keywords. It provides details about daily volume, keyword searches, keyword volume, etc. which can effectively guide digital marketers to craft potential campaigns. Slidegeeks is one of the best resources for PowerPoint templates. You can download easily and regulate Social Media Analytics Dashboard To Track Viral Keywords Structure PDF for your personal presentations from our wonderful collection. A few clicks is all it takes to discover and get the most relevant and appropriate templates. Use our Templates to add a unique zing and appeal to your presentation and meetings. All the slides are easy to edit and you can use them even for advertisement purposes.

Customer Relationship Management Practices Monitoring Dashboard Designs PDF
Following slide demonstrates KPI dashboard to track business relationship management practices which can be adopted by companies to increase sales. It includes key points such as contacts, deals, campaigns, CRM activities progress status, lead targets, lead details, etc. Are you in need of a template that can accommodate all of your creative concepts This one is crafted professionally and can be altered to fit any style. Use it with Google Slides or PowerPoint. Include striking photographs, symbols, depictions, and other visuals. Fill, move around, or remove text boxes as desired. Test out color palettes and font mixtures. Edit and save your work, or work with colleagues. Download Customer Relationship Management Practices Monitoring Dashboard Designs PDF and observe how to make your presentation outstanding. Give an impeccable presentation to your group and make your presentation unforgettable.
Cybersecurity Operations Cybersecops Vulnerabilities Tracking Dashboard For Secops Introduction PDF
This slide represents the vulnerabilities tracking dashboard for SecOps. The purpose of this slide is to demonstrate the tracking of vulnerabilities of an organizations assets, services with the most vulnerabilities, mean time to remediate, and the average age of vulnerabilities. This modern and well arranged Cybersecurity Operations Cybersecops Vulnerabilities Tracking Dashboard For Secops Introduction PDF provides lots of creative possibilities. It is very simple to customize and edit with the Powerpoint Software. Just drag and drop your pictures into the shapes. All facets of this template can be edited with Powerpoint no extra software is necessary. Add your own material, put your images in the places assigned for them, adjust the colors, and then you can show your slides to the world, with an animated slide included.
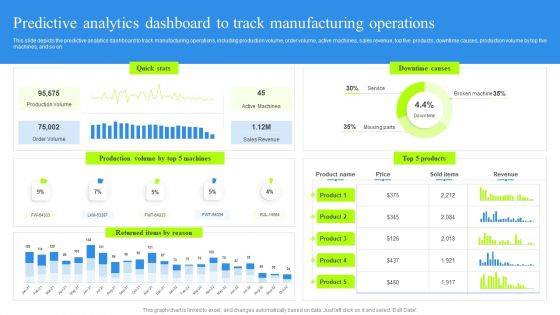
Predictive Analytics Dashboard To Track Manufacturing Operations Rules PDF
This slide depicts the predictive analytics dashboard to track manufacturing operations, including production volume, order volume, active machines, sales revenue, top five products, downtime causes, production volume by top five machines, and so on. Present like a pro with Predictive Analytics Dashboard To Track Manufacturing Operations Rules PDF Create beautiful presentations together with your team, using our easy-to-use presentation slides. Share your ideas in real-time and make changes on the fly by downloading our templates. So whether you are in the office, on the go, or in a remote location, you can stay in sync with your team and present your ideas with confidence. With Slidegeeks presentation got a whole lot easier. Grab these presentations today.
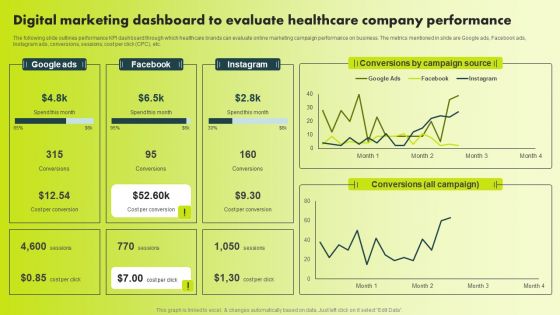
Digital Marketing Dashboard To Evaluate Healthcare Company Performance Template PDF
The following slide outlines performance KPI dashboard through which healthcare brands can evaluate online marketing campaign performance on business. The metrics mentioned in slide are Google ads, Facebook ads, Instagram ads, conversions, sessions, cost per click CPC, etc. Slidegeeks has constructed Digital Marketing Dashboard To Evaluate Healthcare Company Performance Template PDF after conducting extensive research and examination. These presentation templates are constantly being generated and modified based on user preferences and critiques from editors. Here, you will find the most attractive templates for a range of purposes while taking into account ratings and remarks from users regarding the content. This is an excellent jumping-off point to explore our content and will give new users an insight into our top-notch PowerPoint Templates.

Marketing Technology Stack Performance Measurement Dashboard Demonstration PDF
The purpose of the following slide is to display various metrices and key performing indicators to measure the future performance of the marketing technology stack. Deliver and pitch your topic in the best possible manner with this marketing technology stack performance measurement dashboard demonstration pdf. Use them to share invaluable insights on average response time, user satisfaction score, error rate and impress your audience. This template can be altered and modified as per your expectations. So, grab it now.

Organization Cyber Security Dashboard Ppt Show Outfit PDF
This slide covers the cyber security key performance indicators for the organization including application health, device license consumption, data encryption status and many more. Deliver an awe inspiring pitch with this creative organization cyber security dashboard ppt show outfit pdf bundle. Topics like operating systems, license consumption, makes and models, other employees can be discussed with this completely editable template. It is available for immediate download depending on the needs and requirements of the user.

Scrum Kpis Sprint Performance Dashboard Ppt Portfolio Example Introduction PDF
This slide illustrates graphical representation of sprint performance in scrum framework. It includes KPIs like team velocity, past trends of velocity and variance in sprints etc. Showcasing this set of slides titled Scrum Kpis Sprint Performance Dashboard Ppt Portfolio Example Introduction PDF. The topics addressed in these templates are Team Velocity, Past Trends Velocity, Variance Sprint. All the content presented in this PPT design is completely editable. Download it and make adjustments in color, background, font etc. as per your unique business setting.

Social Media Artificial Intelligence Data Visualization Capabilities Dashboard Inspiration PDF
This slide illustrates graphical representation of visualization abilities of artificial intelligence on social media. It includes total impressions, total clicks, performance review etc. Pitch your topic with ease and precision using this Social Media Artificial Intelligence Data Visualization Capabilities Dashboard Inspiration PDF. This layout presents information on Artificial Intelligence, Data Visualization Capabilities. It is also available for immediate download and adjustment. So, changes can be made in the color, design, graphics or any other component to create a unique layout.

Patient Satisfaction Data On Healthcare Management Platform Dashboard Slides PDF
This slide provides glimpse about facts and figures related to patients satisfaction levels on a digital healthcare management platform. It includes patients feedback, patients count, etc. Showcasing this set of slides titled Patient Satisfaction Data On Healthcare Management Platform Dashboard Slides PDF. The topics addressed in these templates are Patients Feedback, Patients Satisfaction, Average Waiting Time. All the content presented in this PPT design is completely editable. Download it and make adjustments in color, background, font etc. as per your unique business setting.

Quality Kpis Dashboard With Project Portfolio Analysis Download PDF
This slide displays project health indicators to review and compare companys performance with quality parameters decided by management. It includes details about project schedule, tasks, budget and resources. Showcasing this set of slides titled Quality Kpis Dashboard With Project Portfolio Analysis Download PDF. The topics addressed in these templates are Schedule, Tasks, Budget, Resources. All the content presented in this PPT design is completely editable. Download it and make adjustments in color, background, font etc. as per your unique business setting.
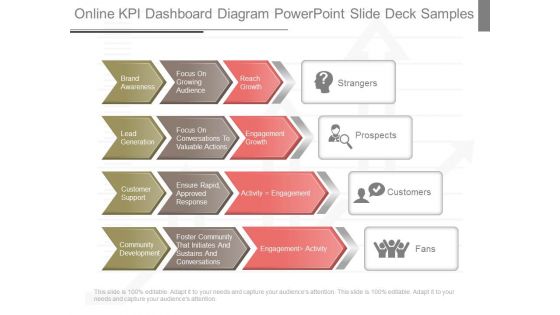
Online Kpi Dashboard Diagram Powerpoint Slide Deck Samples
This is a online kpi dashboard diagram powerpoint slide deck samples. This is a four stage process. The stages in this process are brand awareness, focus on growing audience, reach growth, strangers, lead generation, focus on conversations to valuable actions, engagement growth, customer support, ensure rapid, approved response, activity engagement, prospects, customers, community development, foster community that initiates and sustains and conversations, engagement activity, fans.

Development And Operations KPI Dashboard IT Timeline Diagrams PDF
This is a development and operations kpi dashboard it timeline diagrams pdf template with various stages. Focus and dispense information on five stages using this creative set, that comes with editable features. It contains large content boxes to add your information on topics like timeline, 2016 to 2021. You can also showcase facts, figures, and other relevant content using this PPT layout. Grab it now.
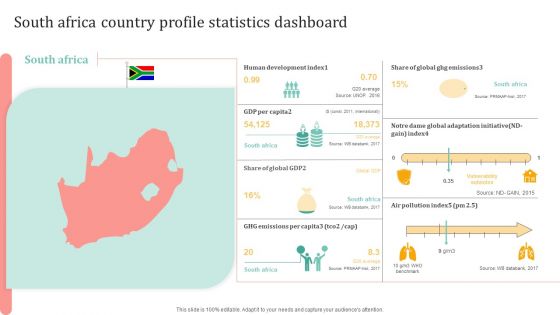
South Africa Country Profile Statistics Dashboard Ppt Infographics Diagrams PDF
Persuade your audience using this South Africa Country Profile Statistics Dashboard Ppt Infographics Diagrams PDF. This PPT design covers one stages, thus making it a great tool to use. It also caters to a variety of topics including Human Development Index, GDP Per Capita, GHG Emissions. Download this PPT design now to present a convincing pitch that not only emphasizes the topic but also showcases your presentation skills.

Consumer Retention Techniques Patient Satisfaction Measurement Dashboard Rules PDF
This graph or chart is linked to excel, and changes automatically based on data. Just left click on it and select Edit Data. Deliver and pitch your topic in the best possible manner with this consumer retention techniques patient satisfaction measurement dashboard rules pdf. Use them to share invaluable insights on average waiting times, lab test turnaround, patient satisfaction, patient falls and impress your audience. This template can be altered and modified as per your expectations. So, grab it now.

Patient Satisfaction Measurement Dashboard Consumer Retention Techniques Summary PDF
This graph or chart is linked to excel, and changes automatically based on data. Just left click on it and select Edit Data. Deliver and pitch your topic in the best possible manner with this patient satisfaction measurement dashboard consumer retention techniques summary pdf. Use them to share invaluable insights on patient reviews left online, patient refferals, satisfaction rate service, percent patients and impress your audience. This template can be altered and modified as per your expectations. So, grab it now.

Finance Metrics Dashboard Illustrating Monthly Gross Profit Formats PDF
This graph or chart is linked to excel, and changes automatically based on data. Just left click on it and select edit data. Showcasing this set of slides titled Finance Metrics Dashboard Illustrating Monthly Gross Profit Formats PDF. The topics addressed in these templates are Profit Metrics Gross, Profit Target Cum, Actual Cum Target. All the content presented in this PPT design is completely editable. Download it and make adjustments in color, background, font etc. as per your unique business setting.

Finance Metrics Dashboard Indicating Portfolio Performance Microsoft PDF
This graph or chart is linked to excel, and changes automatically based on data. Just left click on it and select edit data. Pitch your topic with ease and precision using this Finance Metrics Dashboard Indicating Portfolio Performance Microsoft PDF. This layout presents information on Portfolio Performance Portfolio, Asset Management Manager, Top 10 Assets. It is also available for immediate download and adjustment. So, changes can be made in the color, design, graphics or any other component to create a unique layout.

Finance Metrics Dashboard Indicating Product And Service Revenue Designs PDF
This graph or chart is linked to excel, and changes automatically based on data. Just left click on it and select edit data. Showcasing this set of slides titled Finance Metrics Dashboard Indicating Product And Service Revenue Designs PDF. The topics addressed in these templates are Maintenance Revenue Product, Revenue Product Revenues, Service Revenue Rolling. All the content presented in this PPT design is completely editable. Download it and make adjustments in color, background, font etc. as per your unique business setting.
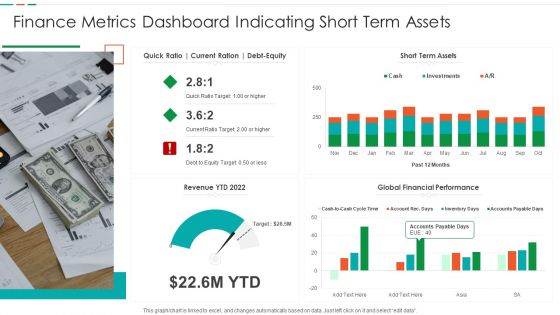
Finance Metrics Dashboard Indicating Short Term Assets Download PDF
This graph or chart is linked to excel, and changes automatically based on data. Just left click on it and select edit data. Pitch your topic with ease and precision using this Finance Metrics Dashboard Indicating Short Term Assets Download PDF. This layout presents information on Short Term Assets, Global Financial Performance, Revenue YTD 2022. It is also available for immediate download and adjustment. So, changes can be made in the color, design, graphics or any other component to create a unique layout.
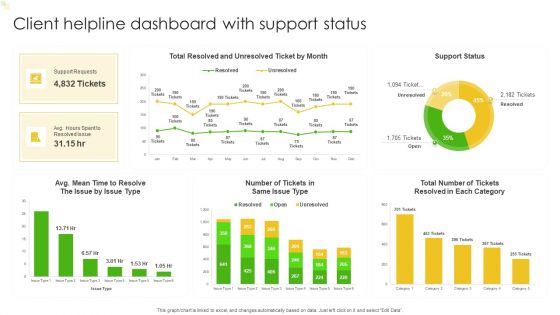
Client Helpline Dashboard With Support Status Ppt Portfolio Rules PDF
This graph or chart is linked to excel, and changes automatically based on data. Just left click on it and select Edit Data. Showcasing this set of slides titled Client Helpline Dashboard With Support Status Ppt Portfolio Rules PDF. The topics addressed in these templates are Total Number, Support Requests, Total Resolved, Support Status. All the content presented in this PPT design is completely editable. Download it and make adjustments in color, background, font etc. as per your unique business setting.

Firm Task Status Dashboard With Milestones Ppt Show Sample PDF
This graph or chart is linked to excel, and changes automatically based on data. Just left click on it and select Edit Data. Showcasing this set of slides titled Firm Task Status Dashboard With Milestones Ppt Show Sample PDF. The topics addressed in these templates are Tasks Completed, Planned, Work Progress, Overall Project ROI. All the content presented in this PPT design is completely editable. Download it and make adjustments in color, background, font etc. as per your unique business setting.

Energy Consumption Statistics Dashboard With Production Costs Slides PDF
This graph or chart is linked to excel, and changes automatically based on data. Just left click on it and select edit data. Showcasing this set of slides titled Energy Consumption Statistics Dashboard With Production Costs Slides PDF. The topics addressed in these templates are Production Cost, Sales Energy, Number Power. All the content presented in this PPT design is completely editable. Download it and make adjustments in color, background, font etc. as per your unique business setting.

Energy Consumption Statistics Dashboard With Sources Overview Template PDF
This graph or chart is linked to excel, and changes automatically based on data. Just left click on it and select edit data. Pitch your topic with ease and precision using this Energy Consumption Statistics Dashboard With Sources Overview Template PDF. This layout presents information on Source, Energy, Consumption. It is also available for immediate download and adjustment. So, changes can be made in the color, design, graphics or any other component to create a unique layout.

Energy Consumption Statistics Dashboard With Yearly Savings Guidelines PDF
This graph or chart is linked to excel, and changes automatically based on data. Just left click on it and select edit data. Showcasing this set of slides titled Energy Consumption Statistics Dashboard With Yearly Savings Guidelines PDF. The topics addressed in these templates are Production Consumption, Energy Savings, Performance Ratio. All the content presented in this PPT design is completely editable. Download it and make adjustments in color, background, font etc. as per your unique business setting.
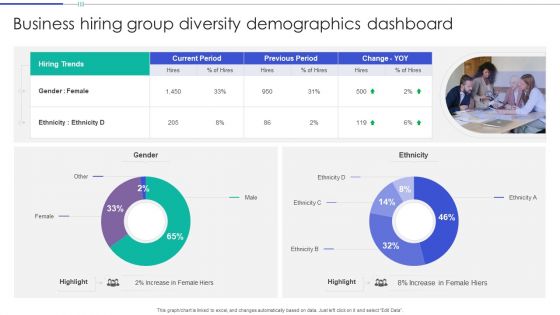
Business Hiring Group Diversity Demographics Dashboard Guidelines PDF
This graph or chart is linked to excel, and changes automatically based on data. Just left click on it and select Edit Data. Showcasing this set of slides titled Business Hiring Group Diversity Demographics Dashboard Guidelines PDF. The topics addressed in these templates are Hiring Trends, Current Period, Previous Period. All the content presented in this PPT design is completely editable. Download it and make adjustments in color, background, font etc. as per your unique business setting.

 Home
Home