Cycle With Icons
Revenue Cycle Vector Icon Ppt PowerPoint Presentation Slides Designs Download
Presenting this set of slides with name revenue cycle vector icon ppt powerpoint presentation slides designs download. The topics discussed in these slide is revenue cycle vector icon. This is a completely editable PowerPoint presentation and is available for immediate download. Download now and impress your audience.

Pdca Cycle Business PowerPoint Presentation
Draft It Out On Our Pdca Cycle Business Powerpoint Presentation Powerpoint Templates. Give The Final Touches With Your Ideas.
Cycle Symbol Circle Time Icon Ppt PowerPoint Presentation Complete Deck
Presenting this set of slides with name cycle symbol circle time icon ppt powerpoint presentation complete deck. The topics discussed in these slides are circle, time icon, road icon, standing bicycle, bicycle icon. This is a completely editable PowerPoint presentation and is available for immediate download. Download now and impress your audience.
Inventory Cycle Counting Ppt PowerPoint Presentation Icon Topics Cpb
Presenting this set of slides with name inventory cycle counting ppt powerpoint presentation icon topics cpb. This is a six stage process. The stages in this process are inventory cycle counting. This is a completely editable PowerPoint presentation and is available for immediate download. Download now and impress your audience.
Working Capital Cycle Ppt PowerPoint Presentation Icon Examples
Presenting this set of slides with name working capital cycle ppt powerpoint presentation icon examples. This is a four stage process. The stages in this process are collection, receivables, purchases, production, customer invoiced. This is a completely editable PowerPoint presentation and is available for immediate download. Download now and impress your audience.
Project Management Cycle Ppt PowerPoint Presentation Icon Topics
Presenting this set of slides with name project management cycle ppt powerpoint presentation icon topics. This is a four stage process. The stages in this process are business, management, planning, strategy, marketing. This is a completely editable PowerPoint presentation and is available for immediate download. Download now and impress your audience.
Ecommerce Payment Processing Cycle Ppt PowerPoint Presentation Icon Portrait
Presenting this set of slides with name ecommerce payment processing cycle ppt powerpoint presentation icon portrait. This is a five stage process. The stages in this process are ecommerce customers, planning, marketing, strategy, management. This is a completely editable PowerPoint presentation and is available for immediate download. Download now and impress your audience.
Digital Cycle Infographic Ppt PowerPoint Presentation Icon Introduction Cpb
Presenting this set of slides with name digital cycle infographic ppt powerpoint presentation icon introduction cpb. This is an editable Powerpoint three stages graphic that deals with topics like digital cycle infographic to help convey your message better graphically. This product is a premium product available for immediate download and is 100 percent editable in Powerpoint. Download this now and use it in your presentations to impress your audience.
Strategic Management Cycle Ppt PowerPoint Presentation Icon Show Cpb
Presenting this set of slides with name strategic management cycle ppt powerpoint presentation icon show cpb. This is an editable Powerpoint three stages graphic that deals with topics like strategic management cycle to help convey your message better graphically. This product is a premium product available for immediate download and is 100 percent editable in Powerpoint. Download this now and use it in your presentations to impress your audience.
Improvement Cycle Kaizen Methodology Ppt PowerPoint Presentation Icon Cpb
Presenting this set of slides with name improvement cycle kaizen methodology ppt powerpoint presentation icon cpb. This is an editable Powerpoint four stages graphic that deals with topics like improvement cycle kaizen methodology to help convey your message better graphically. This product is a premium product available for immediate download and is 100 percent editable in Powerpoint. Download this now and use it in your presentations to impress your audience.
Project Life Cycle Phases Ppt PowerPoint Presentation Icon Gallery Cpb
Presenting this set of slides with name project life cycle phases ppt powerpoint presentation icon gallery cpb. This is an editable Powerpoint three stages graphic that deals with topics like project life cycle phases to help convey your message better graphically. This product is a premium product available for immediate download and is 100 percent editable in Powerpoint. Download this now and use it in your presentations to impress your audience.
Monthly Timeline For Waterfall Model Software Development Life Cycle Icons PDF
This slide showcases the monthly timeline to develop a software project by using waterfall model. It includes phases such as analysis, design, implementation, testing, maintenance etc Slidegeeks is here to make your presentations a breeze with Monthly Timeline For Waterfall Model Software Development Life Cycle Icons PDF With our easy-to-use and customizable templates, you can focus on delivering your ideas rather than worrying about formatting. With a variety of designs to choose from, you are sure to find one that suits your needs. And with animations and unique photos, illustrations, and fonts, you can make your presentation pop. So whether you are giving a sales pitch or presenting to the board, make sure to check out Slidegeeks first
Revenue Cycle Management Deal Executive Team Ppt Icon Template PDF
This is a revenue cycle management deal executive team ppt icon template pdf template with various stages. Focus and dispense information on one stage using this creative set, that comes with editable features. It contains large content boxes to add your information on topics like chief financial officer, executive officer, executive chairman, executive team. You can also showcase facts, figures, and other relevant content using this PPT layout. Grab it now.
Consolidated Cycle Quality Management Cycle And Process Ppt PowerPoint Presentation Icon Model PDF
This slide exhibits integrated quality management cycle and process with strategic process. It includes major elements such as-Insights and knowledge management, Finance and Budget management etc. Showcasing this set of slides titled consolidated cycle quality management cycle and process ppt powerpoint presentation icon model pdf. The topics addressed in these templates are measurement, analysis, improvement process. All the content presented in this PPT design is completely editable. Download it and make adjustments in color, background, font etc. as per your unique business setting.
Optimization Of Product Development Life Cycle Statistical Impact Of Product Marketing Strategy Icons PDF
This slide shows statistical impact of product marketing strategy that covers different parameters such as return on investment, active users, sessions per user, customer satisfaction and complaint score. This is a optimization of product development life cycle statistical impact of product marketing strategy icons pdf template with various stages. Focus and dispense information on four stages using this creative set, that comes with editable features. It contains large content boxes to add your information on topics like return on investment, active users, sessions per user, customer satisfaction, complaint score. You can also showcase facts, figures, and other relevant content using this PPT layout. Grab it now.
Optimization Of Product Development Life Cycle Steps Taken To Mitigate Unexpected Disruptive Event Icons PDF
This slide shows steps taken to mitigate unexpected disruptive event such as plan for facility continuity, assigning crisis team, ensuring customer relationships, etc. This is a optimization of product development life cycle steps taken to mitigate unexpected disruptive event icons pdf template with various stages. Focus and dispense information on four stages using this creative set, that comes with editable features. It contains large content boxes to add your information on topics like plan for facility continuity, assign crisis team, ensure customer relationship, revisit and re monitor plans. You can also showcase facts, figures, and other relevant content using this PPT layout. Grab it now.
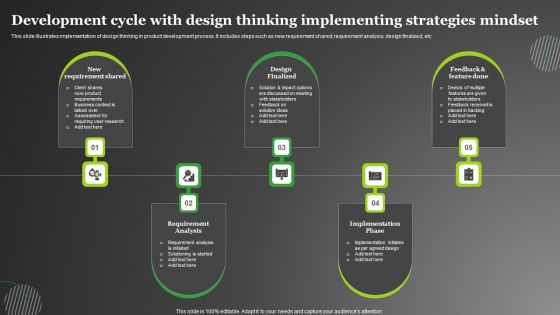
Development Cycle With Design Thinking Implementing Strategies Mindset Clipart PDF
This slide illustrates implementation of design thinking in product development process. It includes steps such as new requirement shared, requirement analysis, design finalized, etc. Persuade your audience using this Development Cycle With Design Thinking Implementing Strategies Mindset Clipart PDF. This PPT design covers five stages, thus making it a great tool to use. It also caters to a variety of topics including New Requirement Shared, Design Finalized, Requirement Analysis. Download this PPT design now to present a convincing pitch that not only emphasizes the topic but also showcases your presentation skills.
Yearly Business Project Planning Life Cycle Icon Download PDF
Pitch your topic with ease and precision using this Yearly Business Project Planning Life Cycle Icon Download PDF. This layout presents information on Yearly Business, Project Planning, Life Cycle Icon. It is also available for immediate download and adjustment. So, changes can be made in the color, design, graphics or any other component to create a unique layout.
Development Life Cycle Vector Icon Ppt PowerPoint Presentation Icon Design Ideas
Presenting this set of slides with name development life cycle vector icon ppt powerpoint presentation icon design ideas. The topics discussed in these slide is development life cycle vector icon. This is a completely editable PowerPoint presentation and is available for immediate download. Download now and impress your audience.

Ppt Templates 3 Phase Cycle Diagram With Arrows PowerPoint Slides
PPT templates 3 Phase Cycle Diagram with Arrows PowerPoint Slides-These high quality powerpoint pre-designed slides and powerpoint templates have been carefully created by our professional team to help you impress your audience. All slides have been created and are 100% editable in powerpoint. Each and every property of any graphic - color, size, orientation, shading, outline etc. can be modified to help you build an effective powerpoint presentation. Any text can be entered at any point in the powerpoint template or slide. Simply DOWNLOAD, TYPE and PRESENT! These PowerPoint presentation slides can be used to represent themes relating to -
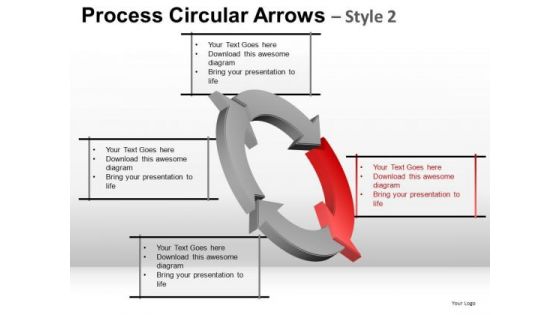
4 Stage Cycle Diagram PowerPoint Slides With Editable Process Arrows
4 Stage Cycle Diagram PowerPoint Slides with Editable Process Arrows-These high quality powerpoint pre-designed slides and powerpoint templates have been carefully created by our professional team to help you impress your audience. All slides have been created and are 100% editable in powerpoint. Each and every property of any graphic - color, size, orientation, shading, outline etc. can be modified to help you build an effective powerpoint presentation. Any text can be entered at any point in the powerpoint template or slide. Simply DOWNLOAD, TYPE and PRESENT! These PowerPoint presentation slides can be used to represent themes relating to -
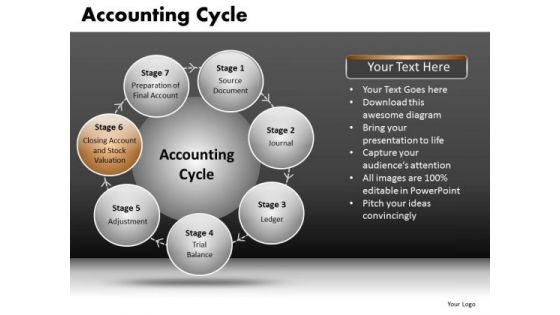
PowerPoint Cycle Diagram With Spherical Text Boxes Ppt Slides
PowerPoint Cycle Diagram with Spherical text Boxes PPT Slides-These high quality powerpoint pre-designed slides and powerpoint templates have been carefully created by our professional team to help you impress your audience. All slides have been created and are 100% editable in powerpoint. Each and every property of any graphic - color, size, orientation, shading, outline etc. can be modified to help you build an effective powerpoint presentation. Any text can be entered at any point in the powerpoint template or slide. Simply DOWNLOAD, TYPE and PRESENT! These PowerPoint presentation slides can be used to represent themes relating to -

Product Development Status Cycle Update Summary PDF
Presenting Product Development Status Cycle Update Summary PDF to dispense important information. This template comprises four stages. It also presents valuable insights into the topics including Product Development Status, Icon With Bulb. This is a completely customizable PowerPoint theme that can be put to use immediately. So, download it and address the topic impactfully.

PowerPoint Designs Cycle Diagram Ppt Template
PowerPoint Designs Cycle Diagram PPT Template-In this cycle diagram, you can explain the main events in the cycle, how they interact, and how the cycle repeats. This Diagram can be used to interact visually and logically with audiences. -PowerPoint Designs Cycle Diagram PPT Template-Cycle, Design, Diagram, Element, Graph, Business, Chart, Circular, Connect, Connection, Puzzle, Round, Solving, Step, Together, Putting, Mystery, Linking, Infographic, Icon,

Strategy Diagram Gearwheels Business Cycle Diagram
Delight Them With Our Strategy Diagram Gearwheels Business Cycle Diagram Powerpoint Templates.

Strategy Diagram Business Growth Business Cycle Diagram
Delight Them With Our Strategy Diagram Business Growth Business Cycle Diagram Powerpoint Templates.

Marketing Diagram Cycle Diagram Strategic Management
Get out of the dock with our Marketing Diagram Cycle Diagram Strategic Management Powerpoint Templates. Your mind will be set free. Play the doctor with our Marketing Diagram Cycle Diagram Strategic Management Powerpoint Templates. Control operations with your ideas.

Business Cycle Diagram Gearwheels Business Diagram
Get Out Of The Dock With Our Business Cycle Diagram Gearwheels Business Diagram Powerpoint Templates. Your Mind Will Be Set Free. Play The Doctor With Our Business Cycle Diagram Gearwheels Business Diagram Powerpoint Templates. Control Operations With Your Ideas.

PowerPoint Template Chart Cycle Process Ppt Theme
PowerPoint Template Chart Cycle Process PPT Theme-Cycle Diagrams are a type of graphics that shows how items are related to one another in a repeating cycle. In a cycle diagram, you can explain the main events in the cycle, how they interact, and how the cycle repeats. These Diagrams can be used to interact visually and logically with audiences. -PowerPoint Template Chart Cycle Process PPT Theme
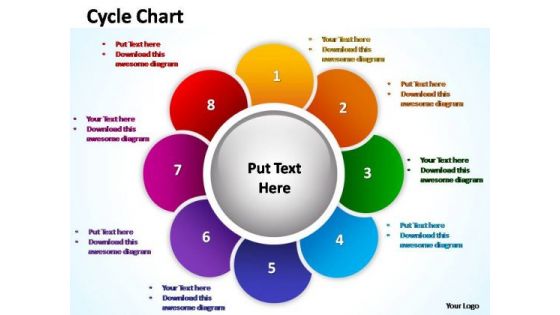
PowerPoint Theme Leadership Cycle Chart Ppt Layout
PowerPoint Theme Leadership Cycle Chart PPT Layout-Cycle Diagrams are a type of graphics that shows how items are related to one another in a repeating cycle. In a cycle diagram, you can explain the main events in the cycle, how they interact, and how the cycle repeats. These Diagrams can be used to interact visually and logically with audiences. -PowerPoint Theme Leadership Cycle Chart PPT Layout

PowerPoint Theme Marketing Cycle Chart Ppt Templates
PowerPoint Theme Marketing Cycle Chart PPT Templates-Cycle Diagrams are a type of graphics that shows how items are related to one another in a repeating cycle. In a cycle diagram, you can explain the main events in the cycle, how they interact, and how the cycle repeats. These Diagrams can be used to interact visually and logically with audiences. -PowerPoint Theme Marketing Cycle Chart PPT Templates
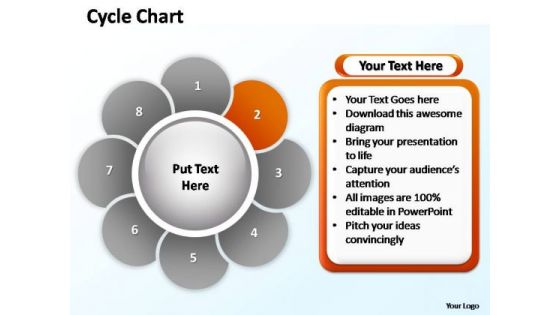
PowerPoint Themes Marketing Cycle Chart Ppt Designs
PowerPoint Themes Marketing Cycle Chart PPT Designs-Cycle Diagrams are a type of graphics that shows how items are related to one another in a repeating cycle. In a cycle diagram, you can explain the main events in the cycle, how they interact, and how the cycle repeats. These Diagrams can be used to interact visually and logically with audiences. -PowerPoint Themes Marketing Cycle Chart PPT Designs
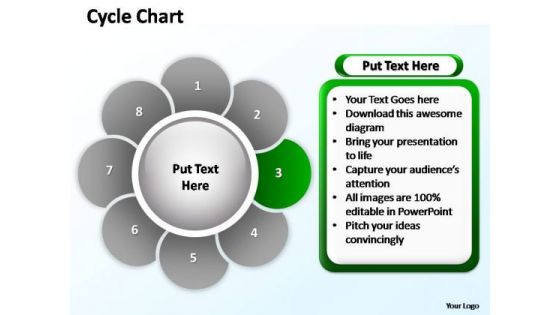
PowerPoint Themes Teamwork Cycle Chart Ppt Template
PowerPoint Themes Teamwork Cycle Chart PPT Template-Cycle Diagrams are a type of graphics that shows how items are related to one another in a repeating cycle. In a cycle diagram, you can explain the main events in the cycle, how they interact, and how the cycle repeats. These Diagrams can be used to interact visually and logically with audiences. -PowerPoint Themes Teamwork Cycle Chart PPT Template

PowerPoint Theme Editable Cycle Chart Ppt Backgrounds
PowerPoint Theme Editable Cycle Chart PPT Backgrounds-Cycle Diagrams are a type of graphics that shows how items are related to one another in a repeating cycle. In a cycle diagram, you can explain the main events in the cycle, how they interact, and how the cycle repeats. These Diagrams can be used to interact visually and logically with audiences. -PowerPoint Theme Editable Cycle Chart PPT Backgrounds

PowerPoint Backgrounds Chart Cycle Process Ppt Themes
PowerPoint Backgrounds Chart Cycle Process PPT Themes-Cycle Diagrams are a type of graphics that shows how items are related to one another in a repeating cycle. In a cycle diagram, you can explain the main events in the cycle, how they interact, and how the cycle repeats. These Diagrams can be used to interact visually and logically with audiences.-PowerPoint Backgrounds Chart Cycle Process PPT Themes
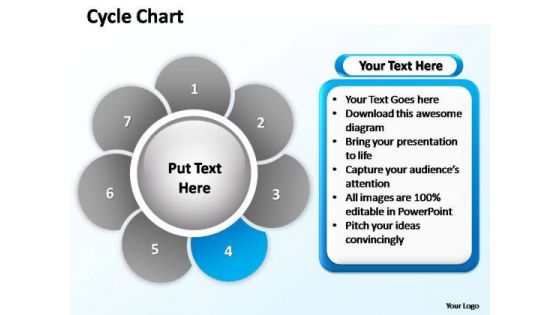
PowerPoint Templates Business Cycle Chart Ppt Themes
Cycle Diagrams are a type of graphics that shows how items are related to one another in a repeating cycle. In a cycle diagram, you can explain the main events in the cycle, how they interact, and how the cycle repeats. These Diagrams can be used to interact visually and logically with audiences.
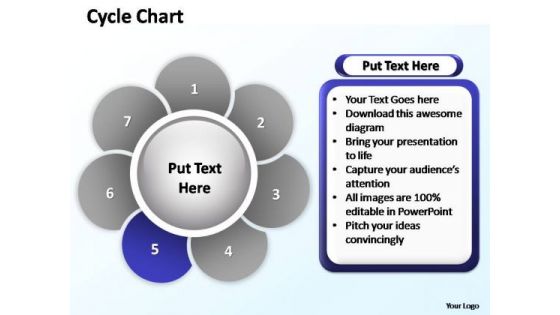
PowerPoint Templates Image Cycle Chart Ppt Themes
Cycle Diagrams are a type of graphics that shows how items are related to one another in a repeating cycle. In a cycle diagram, you can explain the main events in the cycle, how they interact, and how the cycle repeats. These Diagrams can be used to interact visually and logically with audiences.
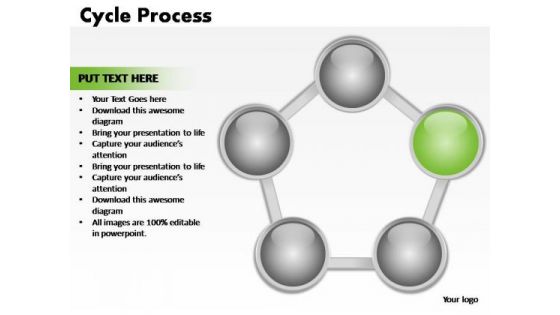
PowerPoint Slide Diagram Cycle Process Ppt Theme
PowerPoint_Slide_Diagram_Cycle_Process_PPT_Theme Business Power Points-Cycle Diagrams are a type of graphics that shows how items are related to one another in a repeating cycle. In a cycle diagram, you can explain the main events in the cycle, how they interact, and how the cycle repeats. These Diagrams can be used to interact visually and logically with audiences. -PowerPoint_Slide_Diagram_Cycle_Process_PPT_Theme Business Power Points
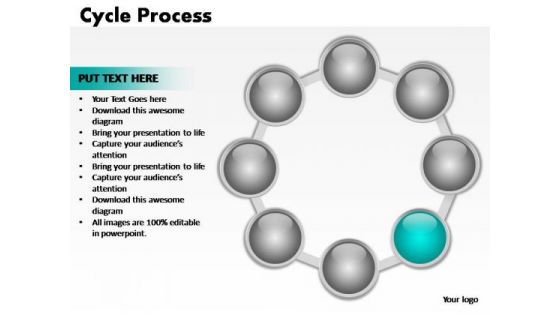
PowerPoint Themes Teamwork Cycle Process Ppt Design
PowerPoint Themes Teamwork Cycle Process PPT Design-Cycle Diagrams are a type of graphics that shows how items are related to one another in a repeating cycle. In a cycle diagram, you can explain the main events in the cycle, how they interact, and how the cycle repeats. These Diagrams can be used to interact visually and logically with audiences. -PowerPoint Themes Teamwork Cycle Process PPT Design
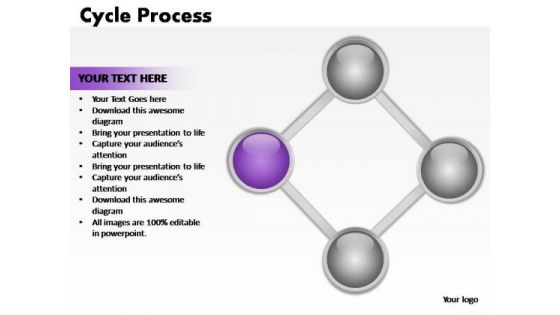
PowerPoint Themes Teamwork Cycle Process Ppt Process
PowerPoint Themes Teamwork Cycle Process PPT Process-Cycle Diagrams are a type of graphics that shows how items are related to one another in a repeating cycle. In a cycle diagram, you can explain the main events in the cycle, how they interact, and how the cycle repeats. These Diagrams can be used to interact visually and logically with audiences. -PowerPoint Themes Teamwork Cycle Process PPT Process

PowerPoint Theme Process Cycle Process Ppt Designs
PowerPoint Theme Process Cycle Process PPT Designs-Cycle Diagrams are a type of graphics that shows how items are related to one another in a repeating cycle. In a cycle diagram, you can explain the main events in the cycle, how they interact, and how the cycle repeats. These Diagrams can be used to interact visually and logically with audiences. -PowerPoint Theme Process Cycle Process PPT Designs
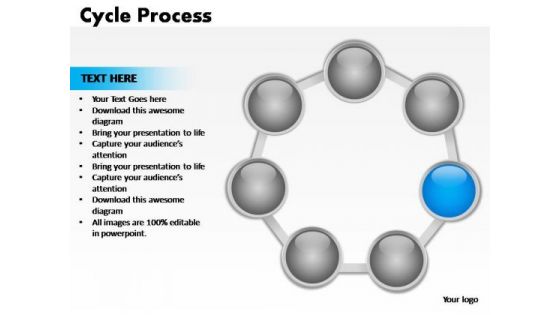
PowerPoint Backgrounds Leadership Cycle Process Ppt Theme
PowerPoint Backgrounds Leadership Cycle Process PPT Theme-Cycle Diagrams are a type of graphics that shows how items are related to one another in a repeating cycle. In a cycle diagram, you can explain the main events in the cycle, how they interact, and how the cycle repeats. These Diagrams can be used to interact visually and logically with audiences.-PowerPoint Backgrounds Leadership Cycle Process PPT Theme
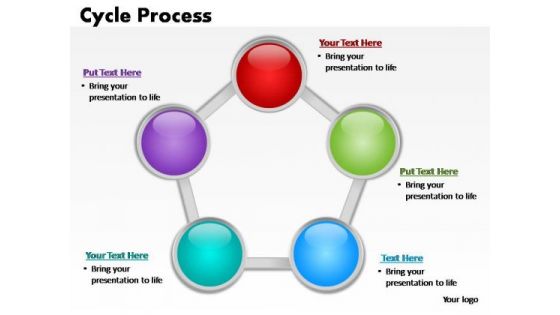
PowerPoint Templates Business Cycle Process Ppt Themes
Cycle Diagrams are a type of graphics that shows how items are related to one another in a repeating cycle. In a cycle diagram, you can explain the main events in the cycle, how they interact, and how the cycle repeats. These Diagrams can be used to interact visually and logically with audiences.
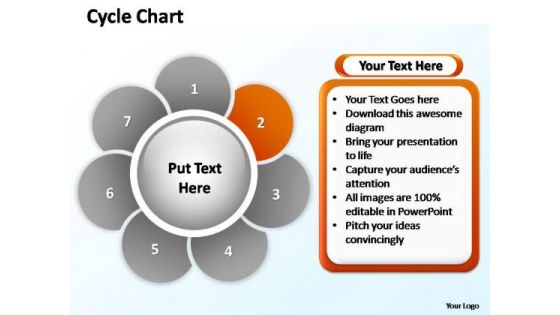
PowerPoint Slides Growth Cycle Chart Ppt Presentation
PowerPoint Slides Growth Cycle Chart PPT Presentation-Cycle Diagrams are a type of graphics that shows how items are related to one another in a repeating cycle. In a cycle diagram, you can explain the main events in the cycle, how they interact, and how the cycle repeats. These Diagrams can be used to interact visually and logically with audiences. -PowerPoint Slides Growth Cycle Chart PPT Presentation
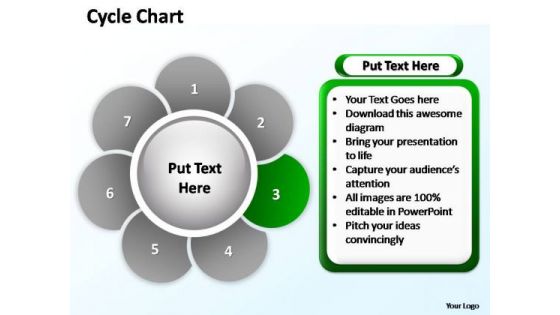
PowerPoint Slides Strategy Cycle Chart Ppt Layouts
PowerPoint Slides Strategy Cycle Chart PPT Layouts-Cycle Diagrams are a type of graphics that shows how items are related to one another in a repeating cycle. In a cycle diagram, you can explain the main events in the cycle, how they interact, and how the cycle repeats. These Diagrams can be used to interact visually and logically with audiences. -PowerPoint Slides Strategy Cycle Chart PPT Layouts
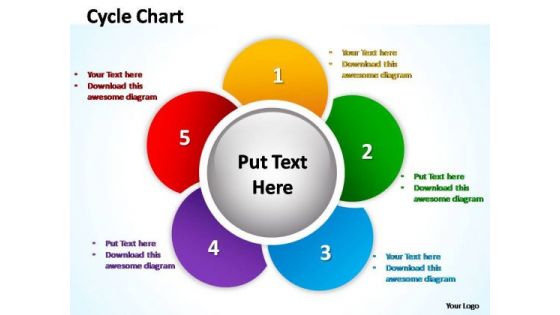
PowerPoint Backgrounds Growth Cycle Chart Ppt Design
PowerPoint Backgrounds Growth Cycle Chart PPT Design-Cycle Diagrams are a type of graphics that shows how items are related to one another in a repeating cycle. In a cycle diagram, you can explain the main events in the cycle, how they interact, and how the cycle repeats. These Diagrams can be used to interact visually and logically with audiences.-PowerPoint Backgrounds Growth Cycle Chart PPT Design

PowerPoint Backgrounds Image Cycle Chart Ppt Slide
PowerPoint Backgrounds Image Cycle Chart PPT Slide-Cycle Diagrams are a type of graphics that shows how items are related to one another in a repeating cycle. In a cycle diagram, you can explain the main events in the cycle, how they interact, and how the cycle repeats. These Diagrams can be used to interact visually and logically with audiences.-PowerPoint Backgrounds Image Cycle Chart PPT Slide
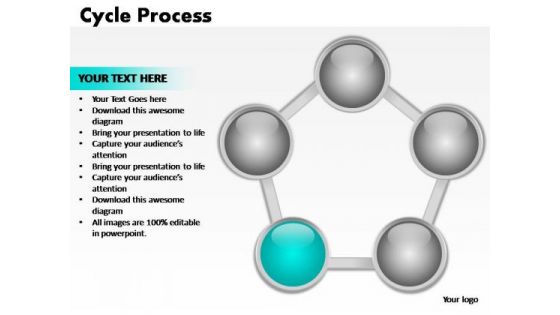
PowerPoint Design Chart Cycle Process Ppt Backgrounds
PowerPoint Design Chart Cycle Process PPT Backgrounds-Cycle Diagrams are a type of graphics that shows how items are related to one another in a repeating cycle. In a cycle diagram, you can explain the main events in the cycle, how they interact, and how the cycle repeats. These Diagrams can be used to interact visually and logically with audiences.-PowerPoint Design Chart Cycle Process PPT Backgrounds
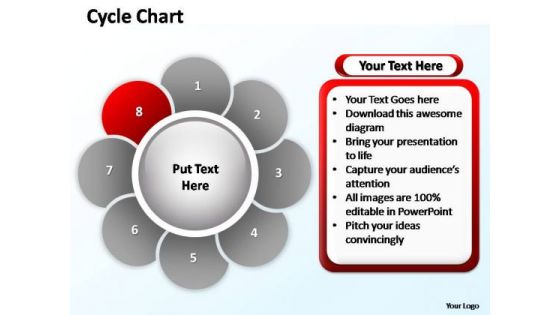
PowerPoint Design Image Cycle Chart Ppt Templates
PowerPoint Design Image Cycle Chart PPT Templates-Cycle Diagrams are a type of graphics that shows how items are related to one another in a repeating cycle. In a cycle diagram, you can explain the main events in the cycle, how they interact, and how the cycle repeats. These Diagrams can be used to interact visually and logically with audiences.-PowerPoint Design Image Cycle Chart PPT Templates
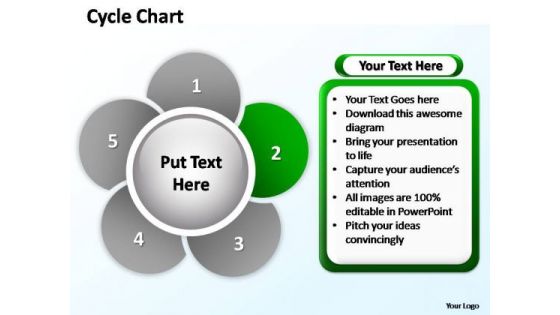
PowerPoint Designs Business Cycle Chart Ppt Slides
PowerPoint Designs Business Cycle Chart PPT Slides-Cycle Diagrams are a type of graphics that shows how items are related to one another in a repeating cycle. In a cycle diagram, you can explain the main events in the cycle, how they interact, and how the cycle repeats. These Diagrams can be used to interact visually and logically with audiences. -PowerPoint Designs Business Cycle Chart PPT Slides
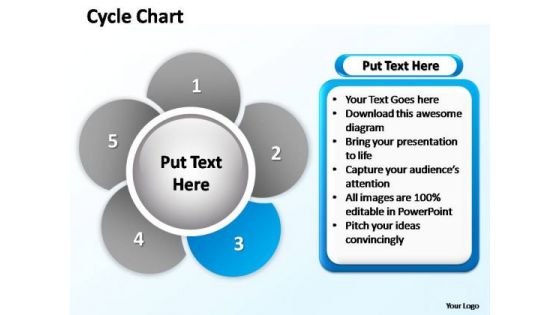
PowerPoint Designs Company Cycle Chart Ppt Process
PowerPoint Designs Company Cycle Chart PPT Process-Cycle Diagrams are a type of graphics that shows how items are related to one another in a repeating cycle. In a cycle diagram, you can explain the main events in the cycle, how they interact, and how the cycle repeats. These Diagrams can be used to interact visually and logically with audiences. -PowerPoint Designs Company Cycle Chart PPT Process

PowerPoint Designs Image Cycle Chart Ppt Layout
PowerPoint Designs Image Cycle Chart PPT Layout-Cycle Diagrams are a type of graphics that shows how items are related to one another in a repeating cycle. In a cycle diagram, you can explain the main events in the cycle, how they interact, and how the cycle repeats. These Diagrams can be used to interact visually and logically with audiences. -PowerPoint Designs Image Cycle Chart PPT Layout

PowerPoint Template Diagram Cycle Process Ppt Presentation
PowerPoint Template Diagram Cycle Process PPT Presentation-Cycle Diagrams are a type of graphics that shows how items are related to one another in a repeating cycle. In a cycle diagram, you can explain the main events in the cycle, how they interact, and how the cycle repeats. These Diagrams can be used to interact visually and logically with audiences. -PowerPoint Template Diagram Cycle Process PPT Presentation

PowerPoint Slide Graphic Cycle Chart Ppt Design
PowerPoint_Slide_Graphic_Cycle_Chart_PPT_Design Business Power Points-Cycle Diagrams are a type of graphics that shows how items are related to one another in a repeating cycle. In a cycle diagram, you can explain the main events in the cycle, how they interact, and how the cycle repeats. These Diagrams can be used to interact visually and logically with audiences. -PowerPoint_Slide_Graphic_Cycle_Chart_PPT_Design Business Power Points

PowerPoint Slide Leadership Cycle Chart Ppt Design
PowerPoint_Slide_Leadership_Cycle_Chart_PPT_Design Business Power Points-Cycle Diagrams are a type of graphics that shows how items are related to one another in a repeating cycle. In a cycle diagram, you can explain the main events in the cycle, how they interact, and how the cycle repeats. These Diagrams can be used to interact visually and logically with audiences. -PowerPoint_Slide_Leadership_Cycle_Chart_PPT_Design Business Power Points
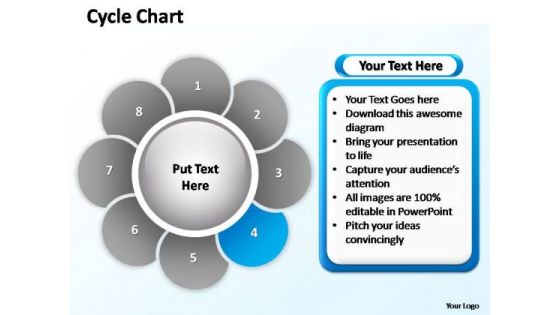
PowerPoint Templates Education Cycle Chart Ppt Designs
Cycle Diagrams are a type of graphics that shows how items are related to one another in a repeating cycle. In a cycle diagram, you can explain the main events in the cycle, how they interact, and how the cycle repeats. These Diagrams can be used to interact visually and logically with audiences.

PowerPoint Templates Success Cycle Chart Ppt Layouts
Cycle Diagrams are a type of graphics that shows how items are related to one another in a repeating cycle. In a cycle diagram, you can explain the main events in the cycle, how they interact, and how the cycle repeats. These Diagrams can be used to interact visually and logically with audiences.
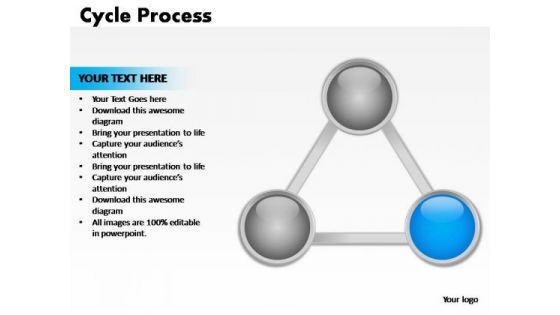
PowerPoint Templates Diagram Cycle Process Ppt Slide
Cycle Diagrams are a type of graphics that shows how items are related to one another in a repeating cycle. In a cycle diagram, you can explain the main events in the cycle, how they interact, and how the cycle repeats. These Diagrams can be used to interact visually and logically with audiences.
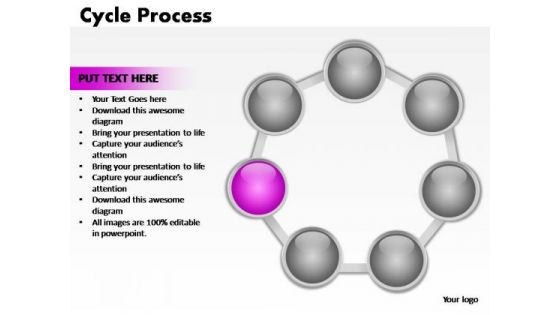
PowerPoint Slides Company Cycle Process Ppt Design
PowerPoint Slides Company Cycle Process PPT Design-Cycle Diagrams are a type of graphics that shows how items are related to one another in a repeating cycle. In a cycle diagram, you can explain the main events in the cycle, how they interact, and how the cycle repeats. These Diagrams can be used to interact visually and logically with audiences. -PowerPoint Slides Company Cycle Process PPT Design

PowerPoint Template Company Cycle Process Ppt Slides
PowerPoint Template Company Cycle Process PPT Slides-Cycle Diagrams are a type of graphics that shows how items are related to one another in a repeating cycle. In a cycle diagram, you can explain the main events in the cycle, how they interact, and how the cycle repeats. These Diagrams can be used to interact visually and logically with audiences. -PowerPoint Template Company Cycle Process PPT Slides

 Home
Home