Customer Performance
Facebook Ad Campaign Performance Tracking Dashboard Microsoft PDF
This slide represents the KPI dashboard to effectively measure and monitor performance of Facebook marketing campaign conducted by the organization to enhance customer engagement. It includes details related to KPIs such as ad impressions, ad reach etc. From laying roadmaps to briefing everything in detail, our templates are perfect for you. You can set the stage with your presentation slides. All you have to do is download these easy-to-edit and customizable templates. Facebook Ad Campaign Performance Tracking Dashboard Microsoft PDF will help you deliver an outstanding performance that everyone would remember and praise you for. Do download this presentation today.
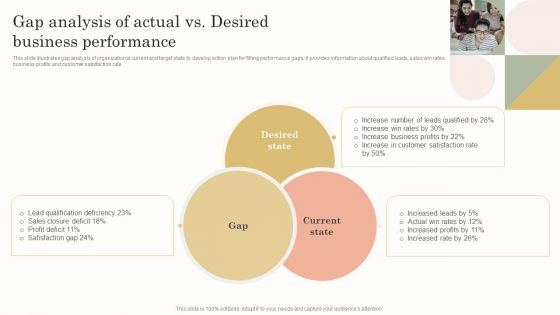
Gap Analysis Of Actual Vs Desired Business Performance Mockup PDF
This slide illustrates gap analysis of organizational current and target state to develop action plan for filling performance gaps. It provides information about qualified leads, sales win rates, business profits and customer satisfaction rate. From laying roadmaps to briefing everything in detail, our templates are perfect for you. You can set the stage with your presentation slides. All you have to do is download these easy to edit and customizable templates. Gap Analysis Of Actual Vs Desired Business Performance Mockup PDF will help you deliver an outstanding performance that everyone would remember and praise you for. Do download this presentation today.
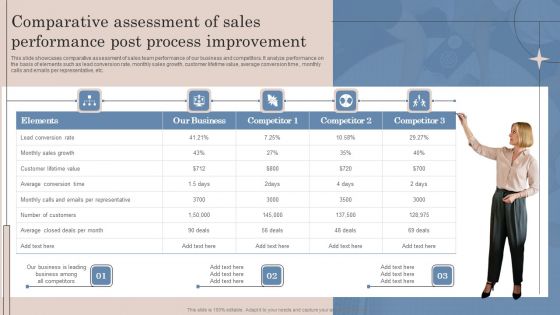
Comparative Assessment Of Sales Performance Post Process Improvement Clipart PDF
This slide showcases comparative assessment of sales team performance of our business and competitors. It analyze performance on the basis of elements such as lead conversion rate, monthly sales growth, customer lifetime value, average conversion time , monthly calls and emails per representative, etc. Find a pre designed and impeccable Comparative Assessment Of Sales Performance Post Process Improvement Clipart PDF. The templates can ace your presentation without additional effort. You can download these easy to edit presentation templates to make your presentation stand out from others. So, what are you waiting for Download the template from Slidegeeks today and give a unique touch to your presentation.
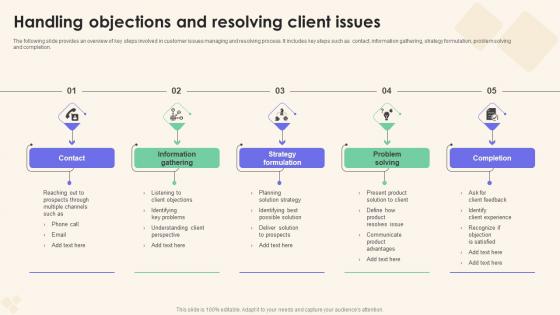
Handling Objections And Resolving Sales Performance Enhancement Download Pdf
The following slide provides an overview of key steps involved in customer issues managing and resolving process. It includes key steps such as contact, information gathering, strategy formulation, problem solving and completion. Whether you have daily or monthly meetings, a brilliant presentation is necessary. Handling Objections And Resolving Sales Performance Enhancement Download Pdf can be your best option for delivering a presentation. Represent everything in detail using Handling Objections And Resolving Sales Performance Enhancement Download Pdf and make yourself stand out in meetings. The template is versatile and follows a structure that will cater to your requirements. All the templates prepared by Slidegeeks are easy to download and edit. Our research experts have taken care of the corporate themes as well. So, give it a try and see the results.
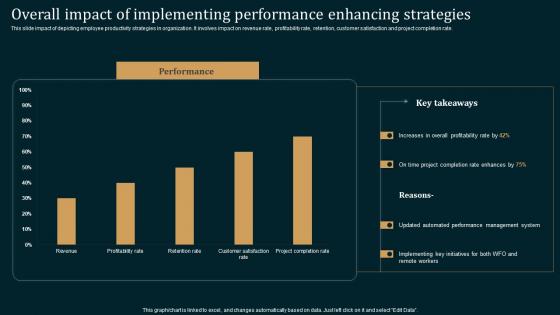
Overall Impact Of Implementing Employee Performance Improvement Strategies Demonstration Pdf
This slide impact of depicting employee productivity strategies in organization. It involves impact on revenue rate, profitability rate, retention, customer satisfaction and project completion rate. Are you searching for a Overall Impact Of Implementing Employee Performance Improvement Strategies Demonstration Pdf that is uncluttered, straightforward, and original Its easy to edit, and you can change the colors to suit your personal or business branding. For a presentation that expresses how much effort you have put in, this template is ideal With all of its features, including tables, diagrams, statistics, and lists, its perfect for a business plan presentation. Make your ideas more appealing with these professional slides. Download Overall Impact Of Implementing Employee Performance Improvement Strategies Demonstration Pdf from Slidegeeks today.

Web Consulting Business Performance Key Statistics Associated With Web Design
Mentioned slide represents key statistics associated with web design. It includes key statistics such as website first impression, web credibility, customer return, bounce rate, unattractive layout and content, etc. Do you have an important presentation coming up Are you looking for something that will make your presentation stand out from the rest Look no further than Web Consulting Business Performance Key Statistics Associated With Web Design. With our professional designs, you can trust that your presentation will pop and make delivering it a smooth process. And with Slidegeeks, you can trust that your presentation will be unique and memorable. So why wait Grab Web Consulting Business Performance Key Statistics Associated With Web Design today and make your presentation stand out from the rest
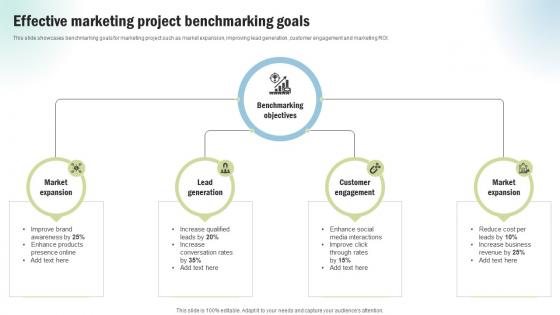
Marketing Project Performance Benchmarking Effective Marketing Project CRP SS V
This slide showcases benchmarking goals for marketing project such as market expansion, improving lead generation, customer engagement and marketing ROI. If you are looking for a format to display your unique thoughts, then the professionally designed Marketing Project Performance Benchmarking Effective Marketing Project CRP SS V is the one for you. You can use it as a Google Slides template or a PowerPoint template. Incorporate impressive visuals, symbols, images, and other charts. Modify or reorganize the text boxes as you desire. Experiment with shade schemes and font pairings. Alter, share or cooperate with other people on your work. Download Marketing Project Performance Benchmarking Effective Marketing Project CRP SS V and find out how to give a successful presentation. Present a perfect display to your team and make your presentation unforgettable.
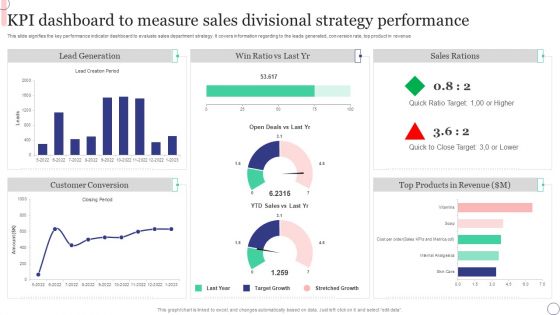
KPI Dashboard To Measure Sales Divisional Strategy Performance Microsoft PDF
This slide signifies the key performance indicator dashboard to evaluate sales department strategy. It covers information regarding to the leads generated, conversion rate, top product in revenue. Pitch your topic with ease and precision using this KPI Dashboard To Measure Sales Divisional Strategy Performance Microsoft PDF. This layout presents information on Sales Rations, Lead Generation, Customer Conversion. It is also available for immediate download and adjustment. So, changes can be made in the color, design, graphics or any other component to create a unique layout.

Web Consulting Business Performance Online Marketing Strategies For Potential
Mentioned slide provides information about various online marketing strategies which can be implemented by business to improve customer services. It includes key strategies such as email marketing, social media marketing, PPC marketing, content marketing, and SEO. Whether you have daily or monthly meetings, a brilliant presentation is necessary. Web Consulting Business Performance Online Marketing Strategies For Potential can be your best option for delivering a presentation. Represent everything in detail using Web Consulting Business Performance Online Marketing Strategies For Potential and make yourself stand out in meetings. The template is versatile and follows a structure that will cater to your requirements. All the templates prepared by Slidegeeks are easy to download and edit. Our research experts have taken care of the corporate themes as well. So, give it a try and see the results.

Positive Impact Of Performance Marketing On Ecommerce Business Graphics PDF
The slide illustrates the positive impact of performance marketing on both consumers and merchants, as these benefits help to ensure a positive market impact and a loyal customer base. The components are benefits, description, and impact. Showcasing this set of slides titled Positive Impact Of Performance Marketing On Ecommerce Business Graphics PDF. The topics addressed in these templates are Data Tracking Analytics, Capturing Vast Audience, Impact. All the content presented in this PPT design is completely editable. Download it and make adjustments in color, background, font etc. as per your unique business setting.
Data Requirements For Analytics Impact On Business Performance Icons PDF
This slide illustrates data requirement analysis impact before and after data collection on business performance. It also includes benefits such as business process improvement, understanding of customer likings and prompt decision making. Showcasing this set of slides titled data requirements for analytics impact on business performance icons pdf. The topics addressed in these templates are goals, business, process. All the content presented in this PPT design is completely editable. Download it and make adjustments in color, background, font etc. as per your unique business setting.
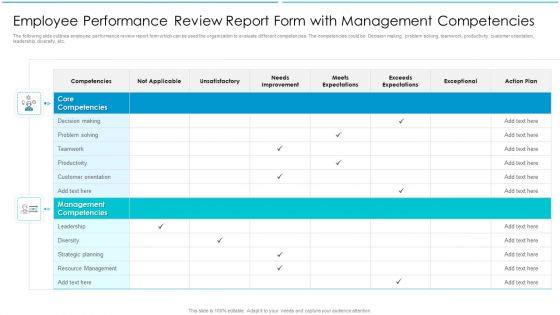
Employee Performance Review Report Form With Management Competencies Clipart PDF
The following slide outlines employee performance review report form which can be used the organization to evaluate different competencies. The competencies could be Decision making, problem solving, teamwork, productivity, customer orientation, leadership, diversity, etc. Pitch your topic with ease and precision using this Employee Performance Review Report Form With Management Competencies Clipart PDF. This layout presents information on Decision Making, Management Competencies, Strategic Planning. It is also available for immediate download and adjustment. So, changes can be made in the color, design, graphics or any other component to create a unique layout.
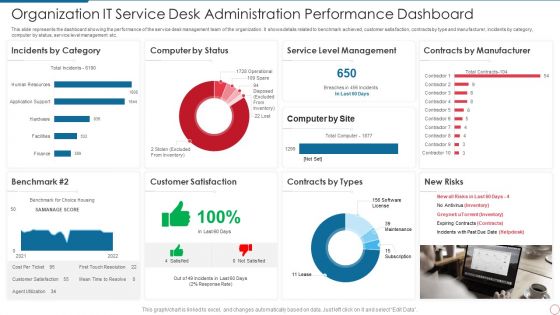
Organization IT Service Desk Administration Performance Dashboard Infographics PDF
This slide represents the dashboard showing the performance of the service desk management team of the organization. It shows details related to benchmark achieved, customer satisfaction, contracts by type and manufacturer, incidents by category, computer by status, service level management etc. Showcasing this set of slides titled Organization IT Service Desk Administration Performance Dashboard Infographics PDF. The topics addressed in these templates are Service, Management, Manufacturer. All the content presented in this PPT design is completely editable. Download it and make adjustments in color, background, font etc. as per your unique business setting.

Corporate Performance Pyramid Showing Internal And External Efficiency Brochure PDF
This slide represents the pyramid showing the performance of a company. It includes details related to corporate vision, divisions, business operating systems and departments . Persuade your audience using this Corporate Performance Pyramid Showing Internal And External Efficiency Brochure PDF. This PPT design covers four stages, thus making it a great tool to use. It also caters to a variety of topics including Flexibility, Customer Satisfaction, Financial. Download this PPT design now to present a convincing pitch that not only emphasizes the topic but also showcases your presentation skills.
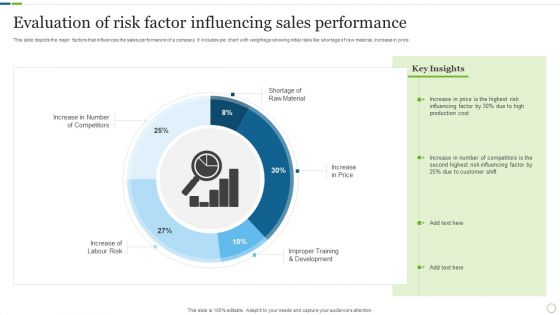
Evaluation Of Risk Factor Influencing Sales Performance Inspiration PDF
This slide depicts the major factors that influences the sales performance of a company. It includes pie chart with weightage showing initial risks like shortage of raw material, increase in price. Pitch your topic with ease and precision using this Evaluation Of Risk Factor Influencing Sales Performance Inspiration PDF. This layout presents information on Production Cost, Customer Shift, Risk Influencing. It is also available for immediate download and adjustment. So, changes can be made in the color, design, graphics or any other component to create a unique layout.

Branch Performance Evaluation Dashboard With Profit And Revenue Diagrams PDF
The slides showcases tips for enhancing branchs workforce performance and efficiency. It covers utilize transaction analysis data, schedule idle time, incent staff for efficiency, get bottom support and use part-time staff.Persuade your audience using this Best Practices To Improve Branch Workforce Performance Evaluation And Efficiency Introduction PDF. This PPT design covers five stages, thus making it a great tool to use. It also caters to a variety of topics including Market Opportunities, Customer Branch, Unnecessary Labor. Download this PPT design now to present a convincing pitch that not only emphasizes the topic but also showcases your presentation skills.
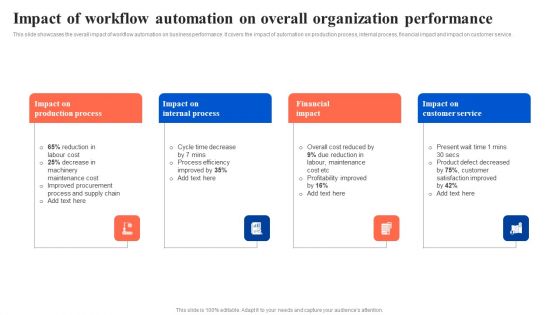
Impact Of Workflow Automation On Overall Organization Performance Portrait PDF
This slide showcases the overall impact of workflow automation on business performance. It covers the impact of automation on production process, internal process, financial impact and impact on customer service. Slidegeeks is one of the best resources for PowerPoint templates. You can download easily and regulate Impact Of Workflow Automation On Overall Organization Performance Portrait PDF for your personal presentations from our wonderful collection. A few clicks is all it takes to discover and get the most relevant and appropriate templates. Use our Templates to add a unique zing and appeal to your presentation and meetings. All the slides are easy to edit and you can use them even for advertisement purposes.
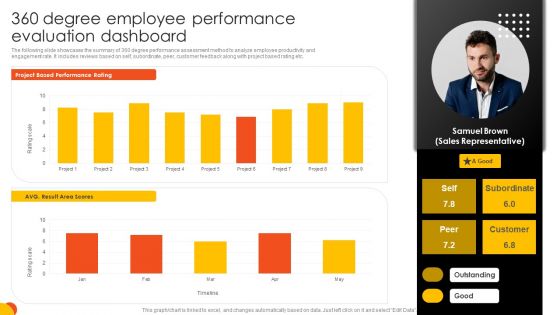
360 Degree Employee Performance Evaluation Dashboard Portrait PDF
The following slide showcases the summary of 360 degree performance assessment method to analyze employee productivity and engagement rate. It includes reviews based on self, subordinate, peer, customer feedback along with project based rating etc. Find a pre designed and impeccable 360 Degree Employee Performance Evaluation Dashboard Portrait PDF. The templates can ace your presentation without additional effort. You can download these easy to edit presentation templates to make your presentation stand out from others. So, what are you waiting for Download the template from Slidegeeks today and give a unique touch to your presentation.

Linkedin Promotional Techniques Impact On Business Performance Slides PDF
Following slide exhibits impact of marketing strategies on business performance to redesign future goals . It includes impacts such as increase market share, revenue growth, customer satisfaction, sales conversion. Showcasing this set of slides titled Linkedin Promotional Techniques Impact On Business Performance Slides PDF. The topics addressed in these templates are Marketing Strategy, Implementing Linkedin, Organisation Revenue. All the content presented in this PPT design is completely editable. Download it and make adjustments in color, background, font etc. as per your unique business setting.
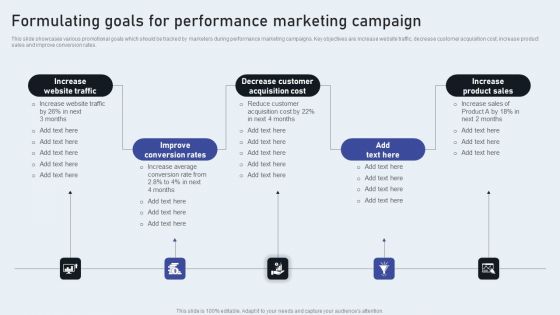
Formulating Goals For Performance Marketing Campaign Microsoft PDF
This slide showcases various promotional goals which should be tracked by marketers during performance marketing campaigns. Key objectives are increase website traffic, decrease customer acquisition cost, increase product sales and improve conversion rates. Find a pre-designed and impeccable Formulating Goals For Performance Marketing Campaign Microsoft PDF. The templates can ace your presentation without additional effort. You can download these easy-to-edit presentation templates to make your presentation stand out from others. So, what are you waiting for Download the template from Slidegeeks today and give a unique touch to your presentation.
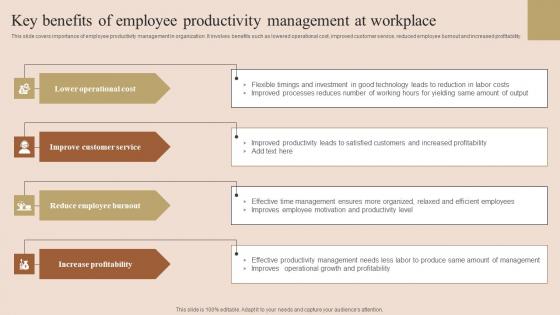
Key Benefits Employee Productivity Employee Performance Improvement Techniques Introduction Pdf
This slide covers importance of employee productivity management in organization. It involves benefits such as lowered operational cost, improved customer service, reduced employee burnout and increased profitability. Coming up with a presentation necessitates that the majority of the effort goes into the content and the message you intend to convey. The visuals of a PowerPoint presentation can only be effective if it supplements and supports the story that is being told. Keeping this in mind our experts created Key Benefits Employee Productivity Employee Performance Improvement Techniques Introduction Pdf to reduce the time that goes into designing the presentation. This way, you can concentrate on the message while our designers take care of providing you with the right template for the situation.
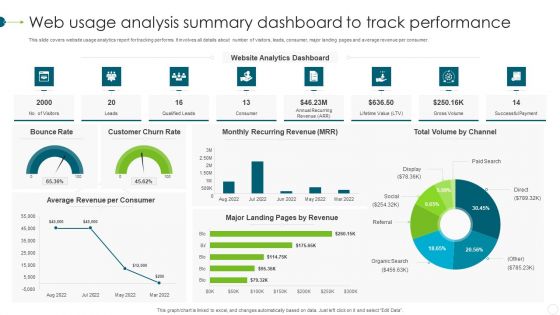
Web Usage Analysis Summary Dashboard To Track Performance Background PDF
This slide covers website usage analytics report for tracking performs. It involves all details about number of visitors, leads, consumer, major landing pages and average revenue per consumer. Showcasing this set of slides titled Web Usage Analysis Summary Dashboard To Track Performance Background PDF. The topics addressed in these templates are Customer Churn Rate, Bounce Rate, Monthly Recurring Revenue. All the content presented in this PPT design is completely editable. Download it and make adjustments in color, background, font etc. as per your unique business setting.

Comparative Assessment Of Sales Performance Post Process Improvement Portrait PDF
This slide showcases comparative assessment of sales team performance of our business and competitors. It analyze performance on the basis of elements such as lead conversion rate, monthly sales growth, customer lifetime value, average conversion time , monthly calls and emails per representative, etc. Crafting an eye catching presentation has never been more straightforward. Let your presentation shine with this tasteful yet straightforward Comparative Assessment Of Sales Performance Post Process Improvement Portrait PDF template. It offers a minimalistic and classy look that is great for making a statement. The colors have been employed intelligently to add a bit of playfulness while still remaining professional. Construct the ideal Comparative Assessment Of Sales Performance Post Process Improvement Portrait PDF that effortlessly grabs the attention of your audience Begin now and be certain to wow your customers.
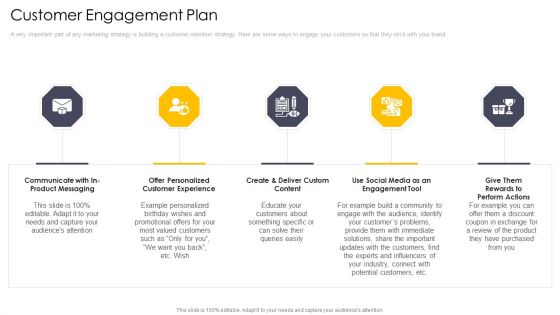
Cross Channel Marketing Communications Initiatives Customer Engagement Plan Diagrams PDF
A very important part of any marketing strategy is building a customer retention strategy. Here are some ways to engage your customers so that they stick with your brand. This is a cross channel marketing communications initiatives customer engagement plan diagrams pdf template with various stages. Focus and dispense information on five stages using this creative set, that comes with editable features. It contains large content boxes to add your information on topics like social media, engagement tool, perform actions, custom content, customer experience. You can also showcase facts, figures, and other relevant content using this PPT layout. Grab it now.

User Behavior Metrics For Content Performance Analysis Pictures PDF
This slide exhibits content metrics based on consumer behavior to understand customer interaction with website. It contains five points page views, average time on page, users, new and returning visitors, bounce rate and pages per session. Persuade your audience using this User Behavior Metrics For Content Performance Analysis Pictures PDF. This PPT design covers Six stages, thus making it a great tool to use. It also caters to a variety of topics including Page Views, New And Returning Visitors. Download this PPT design now to present a convincing pitch that not only emphasizes the topic but also showcases your presentation skills.
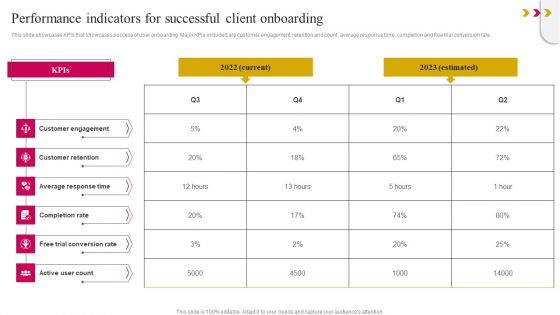
Performance Indicators For Successful Client Onboarding Template PDF
This slide showcases KPIs that showcases success of user onboarding. Major KPIs included are customer engagement, retention and count, average response time, completion and free trial conversion rate. If your project calls for a presentation, then Slidegeeks is your go-to partner because we have professionally designed, easy-to-edit templates that are perfect for any presentation. After downloading, you can easily edit Performance Indicators For Successful Client Onboarding Template PDF and make the changes accordingly. You can rearrange slides or fill them with different images. Check out all the handy templates

Competitive Analysis Of The Product With Performance Metrics Designs PDF
This slide provides competitive analysis of the product with respect to the competitors based on certain paraments like Customer experience, target audience, Competitive Advantage, Support and Delivery etc.Deliver and pitch your topic in the best possible manner with this competitive analysis of the product with performance metrics designs pdf. Use them to share invaluable insights on organic product materials, competitive advantage, online delivery and retail partners and impress your audience. This template can be altered and modified as per your expectations. So, grab it now.
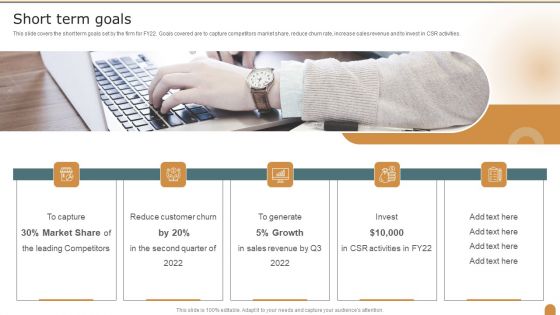
Short Term Goals Company Performance Evaluation Using KPI Themes PDF
This slide covers the short term goals set by the firm for FY22. Goals covered are to capture competitors market share, reduce churn rate, increase sales revenue and to invest in CSR activities. This is a Short Term Goals Company Performance Evaluation Using KPI Themes PDF template with various stages. Focus and dispense information on five stages using this creative set, that comes with editable features. It contains large content boxes to add your information on topics like Market Share, Customer Churn, Revenue. You can also showcase facts, figures, and other relevant content using this PPT layout. Grab it now.

Performance Assessment Dashboard For Social Media Communication Kpis Graphics PDF
This slide showcases dashboard that can help organization to analyzing the reach of their communication KPIs campaigns and customer engagement rates. Its key components are monthly new follows, page likes, page impression by age group, page check ins and total content engagement. Pitch your topic with ease and precision using this Performance Assessment Dashboard For Social Media Communication Kpis Graphics PDF. This layout presents information on Monthly New Follows, Page Check ins, Total Content Engagement. It is also available for immediate download and adjustment. So, changes can be made in the color, design, graphics or any other component to create a unique layout.

Three Employee Performance Measurement For Effective Content Marketing Brochure PDF
This slide shows measurements used for manage content marketing effectiveness that helps to increase brand awareness and customer base. It includes three type of measurements commercial, tactical and brand measurements. Persuade your audience using this Three Employee Performance Measurement For Effective Content Marketing Brochure PDF. This PPT design covers three stages, thus making it a great tool to use. It also caters to a variety of topics including Commercial Measurements, Tactical Measurements, Brand Measurements. Download this PPT design now to present a convincing pitch that not only emphasizes the topic but also showcases your presentation skills.
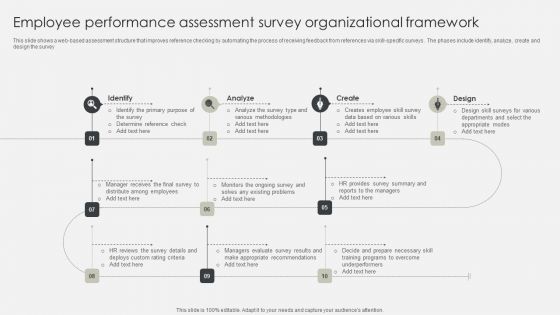
Employee Performance Assessment Survey Organizational Framework Diagrams PDF
This slide depicts the method to provide company leadership with data to compare employee satisfaction against overall employee satisfaction levels and adjust. The key attributes include design survey instrument, deploy survey and analyze survey results. Presenting Employee Performance Assessment Survey Organizational Framework Diagrams PDF to dispense important information. This template comprises three stages. It also presents valuable insights into the topics including Management, Customer Service, Action Plan. This is a completely customizable PowerPoint theme that can be put to use immediately. So, download it and address the topic impactfully.
Introduction To Email Analytics For Tracking Campaign Performance Brochure PDF
This slide covers an email analytics overview to identify how subscribers interact with your email campaigns. It also includes steps to email analytics, such as checking KPIs regularly, reflecting on numbers, refining customer profiles, building better lead generation campaigns, etc. There are so many reasons you need a Introduction To Email Analytics For Tracking Campaign Performance Brochure PDF. The first reason is you can not spend time making everything from scratch, Thus, Slidegeeks has made presentation templates for you too. You can easily download these templates from our website easily.

Content Marketing Strategic Performance Goals Analysis Inspiration PDF
This slide contains content marketing goals with KPIs that help to measure success of end objectives. It includes three major goals conversion, reputation and engagement with indictors such as potential leads, comments, scroll depth, time on page etc. Persuade your audience using this Content Marketing Strategic Performance Goals Analysis Inspiration PDF. This PPT design covers Three stages, thus making it a great tool to use. It also caters to a variety of topics including Customer Engagement, Conversions, Goodwill. Download this PPT design now to present a convincing pitch that not only emphasizes the topic but also showcases your presentation skills.

Effective Product Promotion Strategies To Improve Market Performance Inspiration PDF
This slide shows effective product branding strategies which are adopted to improve brand image, increase market share and customer loyalty. It includes brand extension, line extension, derived branding and individual branding. Persuade your audience using this Effective Product Promotion Strategies To Improve Market Performance Inspiration PDF. This PPT design covers four stages, thus making it a great tool to use. It also caters to a variety of topics including Brand Extension, Derived Branding, Individual Branding. Download this PPT design now to present a convincing pitch that not only emphasizes the topic but also showcases your presentation skills.
Performance Kpi Dashboard For Project Tracking And Control Pictures PDF
This slide covers project monitoring and control dashboard which can be used by PM. It provides information about metrics such as project health, actual budget, at risk project, start and finish date of the project. Showcasing this set of slides titled Performance Kpi Dashboard For Project Tracking And Control Pictures PDF. The topics addressed in these templates are Finance, Customer Support, Business Development. All the content presented in this PPT design is completely editable. Download it and make adjustments in color, background, font etc. as per your unique business setting.

Business Questionnaire Form To Determine Overall Product Performance Survey SS
Following slide demonstrates product feedback survey questionnaire which can be used by business to improve customer satisfaction rate. It includes elements such as product quality, product design, and product features. Showcasing this set of slides titled Business Questionnaire Form To Determine Overall Product Performance Survey SS. The topics addressed in these templates are Product Quality, Product Design, Product Features. All the content presented in this PPT design is completely editable. Download it and make adjustments in color, background, font etc. as per your unique business setting.
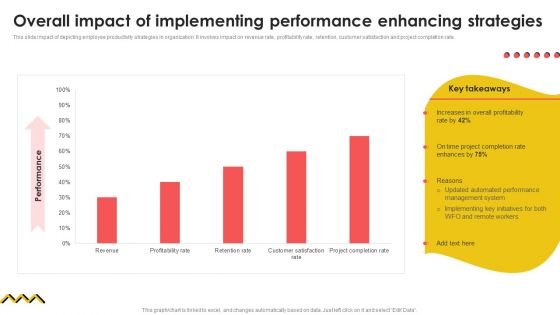
Overall Impact Of Implementing Performance Enhancing Strategies Summary PDF
This slide impact of depicting employee productivity strategies in organization. It involves impact on revenue rate, profitability rate, retention, customer satisfaction and project completion rate. Take your projects to the next level with our ultimate collection of Overall Impact Of Implementing Performance Enhancing Strategies Summary PDF. Slidegeeks has designed a range of layouts that are perfect for representing task or activity duration, keeping track of all your deadlines at a glance. Tailor these designs to your exact needs and give them a truly corporate look with your own brand colors they will make your projects stand out from the rest.

Dashboard To Track Performance Of Digital Loan Applications Pictures PDF
This slide covers dashboard to assess outcomes for loan applications applied by customer through various omnichannel banking services. It includes results based on elements such as debt restructuring, commercial property loans, credit card along with branch based loans, approval rates, etc. Find a pre designed and impeccable Dashboard To Track Performance Of Digital Loan Applications Pictures PDF. The templates can ace your presentation without additional effort. You can download these easy to edit presentation templates to make your presentation stand out from others. So, what are you waiting for Download the template from Slidegeeks today and give a unique touch to your presentation.

KPI Dashboard To Monitor Performance Of Dcaas Pictures PDF
Following slide highlights major benefits of applying data center as a service to business operations which can be used by businesses looking to modernize their IT infrastructure. Major benefits are in terms of scalability, flexibility, cost effectiveness, and security. Pitch your topic with ease and precision using this KPI Dashboard To Monitor Performance Of Dcaas Pictures PDF. This layout presents information on Customer Type, Counts By Model Attributes, Items By Status. It is also available for immediate download and adjustment. So, changes can be made in the color, design, graphics or any other component to create a unique layout.
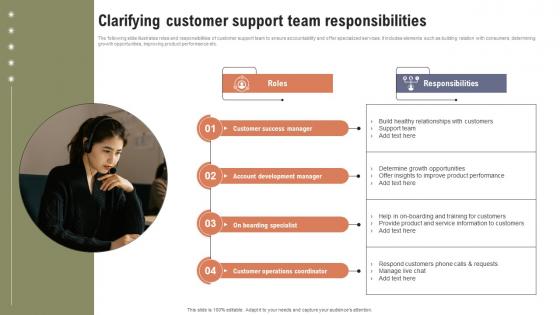
Clarifying Customer Support Team Boosting Customer Retention Rate With Live Chat
The following slide illustrates roles and responsibilities of customer support team to ensure accountability and offer specialized services. It includes elements such as building relation with consumers, determining growth opportunities, improving product performance etc. From laying roadmaps to briefing everything in detail, our templates are perfect for you. You can set the stage with your presentation slides. All you have to do is download these easy-to-edit and customizable templates. Clarifying Customer Support Team Boosting Customer Retention Rate With Live Chat will help you deliver an outstanding performance that everyone would remember and praise you for. Do download this presentation today.

Performance Analysis Of Product Diversification Strategies Summary PDF
The following slide outlines various key performance indicators KPIs that can be used to evaluate the success of product diversification strategies. The key metrics outlined in slide are product revenue, total customers acquired, return on investment ROI, product adoption rate, and customer satisfaction rate. Slidegeeks is one of the best resources for PowerPoint templates. You can download easily and regulate Performance Analysis Of Product Diversification Strategies Summary PDF for your personal presentations from our wonderful collection. A few clicks is all it takes to discover and get the most relevant and appropriate templates. Use our Templates to add a unique zing and appeal to your presentation and meetings. All the slides are easy to edit and you can use them even for advertisement purposes.
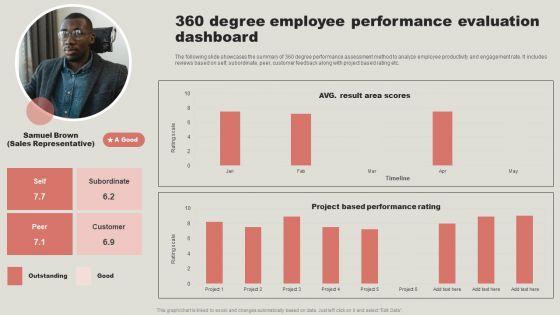
360 Degree Employee Performance Evaluation Dashboard Elements PDF
The following slide showcases the summary of 360 degree performance assessment method to analyze employee productivity and engagement rate. It includes reviews based on self, subordinate, peer, customer feedback along with project based rating etc. Presenting this PowerPoint presentation, titled 360 Degree Employee Performance Evaluation Dashboard Elements PDF, with topics curated by our researchers after extensive research. This editable presentation is available for immediate download and provides attractive features when used. Download now and captivate your audience. Presenting this 360 Degree Employee Performance Evaluation Dashboard Elements PDF. Our researchers have carefully researched and created these slides with all aspects taken into consideration. This is a completely customizable 360 Degree Employee Performance Evaluation Dashboard Elements PDF that is available for immediate downloading. Download now and make an impact on your audience. Highlight the attractive features available with our PPTs.

Comparative Assessment Of Sales Performance Post Process Improvement Inspiration PDF
This slide showcases comparative assessment of sales team performance of our business and competitors. It analyze performance on the basis of elements such as lead conversion rate, monthly sales growth, customer lifetime value, average conversion time , monthly calls and emails per representative, etc. If you are looking for a format to display your unique thoughts, then the professionally designed Comparative Assessment Of Sales Performance Post Process Improvement Inspiration PDF is the one for you. You can use it as a Google Slides template or a PowerPoint template. Incorporate impressive visuals, symbols, images, and other charts. Modify or reorganize the text boxes as you desire. Experiment with shade schemes and font pairings. Alter, share or cooperate with other people on your work. Download Comparative Assessment Of Sales Performance Post Process Improvement Inspiration PDF and find out how to give a successful presentation. Present a perfect display to your team and make your presentation unforgettable.
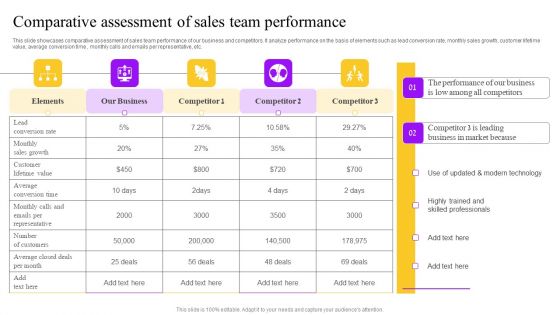
Comparative Assessment Of Sales Team Performance Ppt Pictures Portrait PDF
This slide showcases comparative assessment of sales team performance of our business and competitors. It analyze performance on the basis of elements such as lead conversion rate, monthly sales growth, customer lifetime value, average conversion time , monthly calls and emails per representative, etc. Here you can discover an assortment of the finest PowerPoint and Google Slides templates. With these templates, you can create presentations for a variety of purposes while simultaneously providing your audience with an eye catching visual experience. Download Comparative Assessment Of Sales Team Performance Ppt Pictures Portrait PDF to deliver an impeccable presentation. These templates will make your job of preparing presentations much quicker, yet still, maintain a high level of quality. Slidegeeks has experienced researchers who prepare these templates and write high quality content for you. Later on, you can personalize the content by editing the Comparative Assessment Of Sales Team Performance Ppt Pictures Portrait PDF.
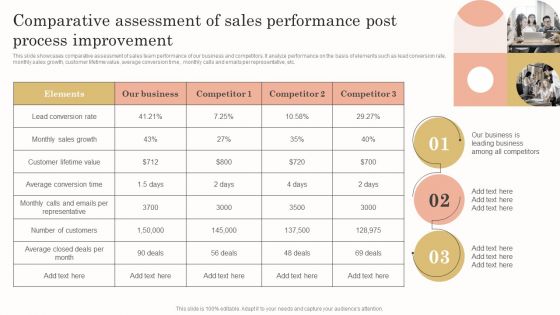
Comparative Assessment Of Sales Performance Post Process Improvement Infographics PDF
This slide showcases comparative assessment of sales team performance of our business and competitors. It analyze performance on the basis of elements such as lead conversion rate, monthly sales growth, customer lifetime value, average conversion time , monthly calls and emails per representative, etc. Want to ace your presentation in front of a live audience Our Comparative Assessment Of Sales Performance Post Process Improvement Infographics PDF can help you do that by engaging all the users towards you. Slidegeeks experts have put their efforts and expertise into creating these impeccable powerpoint presentations so that you can communicate your ideas clearly. Moreover, all the templates are customizable, and easy to edit and downloadable. Use these for both personal and commercial use.
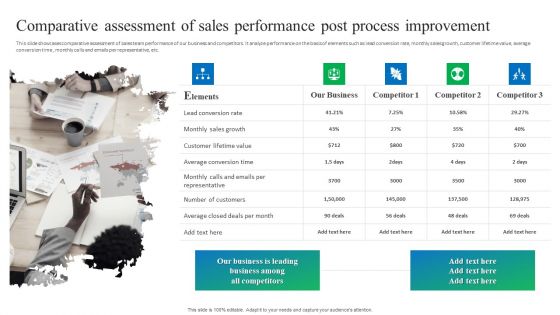
Comparative Assessment Of Sales Performance Post Process Improvement Diagrams PDF
This slide showcases comparative assessment of sales team performance of our business and competitors. It analyze performance on the basis of elements such as lead conversion rate, monthly sales growth, customer lifetime value, average conversion time , monthly calls and emails per representative, etc. Are you in need of a template that can accommodate all of your creative concepts This one is crafted professionally and can be altered to fit any style. Use it with Google Slides or PowerPoint. Include striking photographs, symbols, depictions, and other visuals. Fill, move around, or remove text boxes as desired. Test out color palettes and font mixtures. Edit and save your work, or work with colleagues. Download Comparative Assessment Of Sales Performance Post Process Improvement Diagrams PDF and observe how to make your presentation outstanding. Give an impeccable presentation to your group and make your presentation unforgettable.

Impact Of Workflow Automation On Overall Organization Performance Infographics PDF
This slide showcases the overall impact of workflow automation on business performance. It covers the impact of automation on production process, internal process, financial impact and impact on customer service. Do you have to make sure that everyone on your team knows about any specific topic I yes, then you should give Impact Of Workflow Automation On Overall Organization Performance Infographics PDF a try. Our experts have put a lot of knowledge and effort into creating this impeccable Impact Of Workflow Automation On Overall Organization Performance Infographics PDF. You can use this template for your upcoming presentations, as the slides are perfect to represent even the tiniest detail. You can download these templates from the Slidegeeks website and these are easy to edit. So grab these today.

Comparative Assessment Of Sales Team Performance Information PDF
This slide showcases comparative assessment of sales team performance of our business and competitors. It analyze performance on the basis of elements such as lead conversion rate, monthly sales growth, customer lifetime value, average conversion time , monthly calls and emails per representative, etc. Are you in need of a template that can accommodate all of your creative concepts This one is crafted professionally and can be altered to fit any style. Use it with Google Slides or PowerPoint. Include striking photographs, symbols, depictions, and other visuals. Fill, move around, or remove text boxes as desired. Test out color palettes and font mixtures. Edit and save your work, or work with colleagues. Download Comparative Assessment Of Sales Team Performance Information PDF and observe how to make your presentation outstanding. Give an impeccable presentation to your group and make your presentation unforgettable.

Gap Analysis Of Actual Vs Desired Business Performance Infographics PDF
This slide illustrates gap analysis of organizational current and target state to develop action plan for filling performance gaps. It provides information about qualified leads, sales win rates, business profits and customer satisfaction rate. Do you have to make sure that everyone on your team knows about any specific topic I yes, then you should give Gap Analysis Of Actual Vs Desired Business Performance Infographics PDF a try. Our experts have put a lot of knowledge and effort into creating this impeccable Gap Analysis Of Actual Vs Desired Business Performance Infographics PDF. You can use this template for your upcoming presentations, as the slides are perfect to represent even the tiniest detail. You can download these templates from the Slidegeeks website and these are easy to edit. So grab these today.

Comparative Assessment Of Sales Team Performance Introduction PDF
This slide showcases comparative assessment of sales team performance of our business and competitors. It analyze performance on the basis of elements such as lead conversion rate, monthly sales growth, customer lifetime value, average conversion time , monthly calls and emails per representative, etc. Are you in need of a template that can accommodate all of your creative concepts This one is crafted professionally and can be altered to fit any style. Use it with Google Slides or PowerPoint. Include striking photographs, symbols, depictions, and other visuals. Fill, move around, or remove text boxes as desired. Test out color palettes and font mixtures. Edit and save your work, or work with colleagues. Download Comparative Assessment Of Sales Team Performance Introduction PDF and observe how to make your presentation outstanding. Give an impeccable presentation to your group and make your presentation unforgettable.

Impact Of Workflow Automation On Overall Organization Performance Mockup PDF
This slide showcases the overall impact of workflow automation on business performance. It covers the impact of automation on production process, internal process, financial impact and impact on customer service. Here you can discover an assortment of the finest PowerPoint and Google Slides templates. With these templates, you can create presentations for a variety of purposes while simultaneously providing your audience with an eye catching visual experience. Download Impact Of Workflow Automation On Overall Organization Performance Mockup PDF to deliver an impeccable presentation. These templates will make your job of preparing presentations much quicker, yet still, maintain a high level of quality. Slidegeeks has experienced researchers who prepare these templates and write high quality content for you. Later on, you can personalize the content by editing the Impact Of Workflow Automation On Overall Organization Performance Mockup PDF.
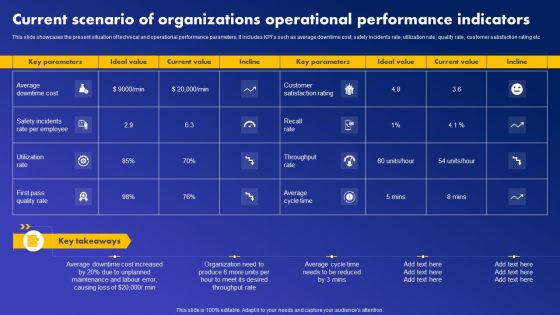
Current Scenario Of Organizations Operational Performance Indicators Professional PDF
This slide showcases the present situation of technical and operational performance parameters. It includes KPIs such as average downtime cost, safety incidents rate, utilization rate, quality rate, customer satisfaction rating etc Whether you have daily or monthly meetings, a brilliant presentation is necessary. Current Scenario Of Organizations Operational Performance Indicators Professional PDF can be your best option for delivering a presentation. Represent everything in detail using Current Scenario Of Organizations Operational Performance Indicators Professional PDF and make yourself stand out in meetings. The template is versatile and follows a structure that will cater to your requirements. All the templates prepared by Slidegeeks are easy to download and edit. Our research experts have taken care of the corporate themes as well. So, give it a try and see the results.

Performance Indicators For Successful Client Onboarding Demonstration PDF

Performance Indicators For Successful Client Onboarding Themes PDF
This slide showcases KPIs that showcases success of user onboarding. Major KPIs included are customer engagement, retention and count, average response time, completion and free trial conversion rate. If you are looking for a format to display your unique thoughts, then the professionally designed Performance Indicators For Successful Client Onboarding Themes PDF is the one for you. You can use it as a Google Slides template or a PowerPoint template. Incorporate impressive visuals, symbols, images, and other charts. Modify or reorganize the text boxes as you desire. Experiment with shade schemes and font pairings. Alter, share or cooperate with other people on your work. Download Performance Indicators For Successful Client Onboarding Themes PDF and find out how to give a successful presentation. Present a perfect display to your team and make your presentation unforgettable.

Key Reasons Behind Poor Supply Chain Performance Download PDF
This slide shows the key reasons behind poor supply chain performance in terms of cash to cash cycle time that are increasing from quarter after quarter and delay in delivering customer orders. Are you in need of a template that can accommodate all of your creative concepts This one is crafted professionally and can be altered to fit any style. Use it with Google Slides or PowerPoint. Include striking photographs, symbols, depictions, and other visuals. Fill, move around, or remove text boxes as desired. Test out color palettes and font mixtures. Edit and save your work, or work with colleagues. Download Key Reasons Behind Poor Supply Chain Performance Download PDF and observe how to make your presentation outstanding. Give an impeccable presentation to your group and make your presentation unforgettable.
Effective Brand Reputation Management Rebranding Performance Tracking Dashboard Summary PDF
This slide provides information regarding promotion plan to optimize overall brands reputation through initiatives such as organizing contest, product giveaways, promotional gifts, customer appreciation, etc. If you are looking for a format to display your unique thoughts, then the professionally designed Effective Brand Reputation Management Rebranding Performance Tracking Dashboard Summary PDF is the one for you. You can use it as a Google Slides template or a PowerPoint template. Incorporate impressive visuals, symbols, images, and other charts. Modify or reorganize the text boxes as you desire. Experiment with shade schemes and font pairings. Alter, share or cooperate with other people on your work. Download Effective Brand Reputation Management Rebranding Performance Tracking Dashboard Summary PDF and find out how to give a successful presentation. Present a perfect display to your team and make your presentation unforgettable.
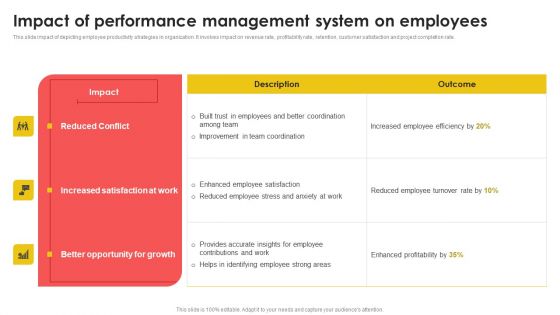
Impact Of Performance Management System On Employees Formats PDF
This slide impact of depicting employee productivity strategies in organization. It involves impact on revenue rate, profitability rate, retention, customer satisfaction and project completion rate. Explore a selection of the finest Impact Of Performance Management System On Employees Formats PDF here. With a plethora of professionally designed and pre made slide templates, you can quickly and easily find the right one for your upcoming presentation. You can use our Impact Of Performance Management System On Employees Formats PDF to effectively convey your message to a wider audience. Slidegeeks has done a lot of research before preparing these presentation templates. The content can be personalized and the slides are highly editable. Grab templates today from Slidegeeks.
Facebook Ad Campaign Performance Tracking Dashboard Ppt Show Picture PDF
This slide represents the KPI dashboard to effectively measure and monitor performance of Facebook marketing campaign conducted by the organization to enhance customer engagement. It includes details related to KPIs such as ad impressions, ad reach etc. Are you in need of a template that can accommodate all of your creative concepts This one is crafted professionally and can be altered to fit any style. Use it with Google Slides or PowerPoint. Include striking photographs, symbols, depictions, and other visuals. Fill, move around, or remove text boxes as desired. Test out color palettes and font mixtures. Edit and save your work, or work with colleagues. Download Facebook Ad Campaign Performance Tracking Dashboard Ppt Show Picture PDF and observe how to make your presentation outstanding. Give an impeccable presentation to your group and make your presentation unforgettable.
Facebook Ad Campaign Performance Tracking Dashboard Ppt Ideas Objects PDF
This slide represents the KPI dashboard to effectively measure and monitor performance of Facebook marketing campaign conducted by the organization to enhance customer engagement. It includes details related to KPIs such as ad impressions, ad reach etc. Are you in need of a template that can accommodate all of your creative concepts This one is crafted professionally and can be altered to fit any style. Use it with Google Slides or PowerPoint. Include striking photographs, symbols, depictions, and other visuals. Fill, move around, or remove text boxes as desired. Test out color palettes and font mixtures. Edit and save your work, or work with colleagues. Download Facebook Ad Campaign Performance Tracking Dashboard Ppt Ideas Objects PDF and observe how to make your presentation outstanding. Give an impeccable presentation to your group and make your presentation unforgettable.
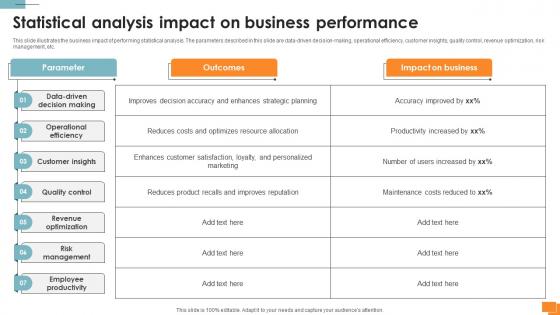
Statistical Tools For Evidence Statistical Analysis Impact On Business Performance
This slide illustrates the business impact of performing statistical analysis. The parameters described in this slide are data-driven decision-making, operational efficiency, customer insights, quality control, revenue optimization, risk management, etc. Do you know about Slidesgeeks Statistical Tools For Evidence Statistical Analysis Impact On Business Performance These are perfect for delivering any kind od presentation. Using it, create PowerPoint presentations that communicate your ideas and engage audiences. Save time and effort by using our pre-designed presentation templates that are perfect for a wide range of topic. Our vast selection of designs covers a range of styles, from creative to business, and are all highly customizable and easy to edit. Download as a PowerPoint template or use them as Google Slides themes.

 Home
Home