Cost Management

Business PowerPoint Template Gantt Chart For Planning And Analysis Ppt Templates
Our Business powerpoint template gantt chart for planning and analysis ppt templates heighten concentration. Your audience will be on the edge. Get an edge with our Competition PowerPoint Templates. They give you advantage plus. Edit your work with our Org Charts PowerPoint Templates. They will help you give the final form.

Unlocking The Potential Of Impact Of Smart Contracts In Gaming BCT SS V
This slide mentions the impact of integrating smart contracts within the blockchain games. It includes enhanced security, decentralized ownership, trustworthy economies and decentralized governance. This slide mentions the impact of integrating smart contracts within the blockchain games. It includes enhanced security, decentralized ownership, trustworthy economies and decentralized governance. Slidegeeks is one of the best resources for PowerPoint templates. You can download easily and regulate Unlocking The Potential Of Impact Of Smart Contracts In Gaming BCT SS V for your personal presentations from our wonderful collection. A few clicks is all it takes to discover and get the most relevant and appropriate templates. Use our Templates to add a unique zing and appeal to your presentation and meetings. All the slides are easy to edit and you can use them even for advertisement purposes.

Business And IT Alignment Model Phase Background PDF
This slide depicts the model phase of business and IT alignment, including identifying resources to offer IT services, mapping IT resources, processes, and assets back to IT services, and prioritizing and planning the resources. Slidegeeks is one of the best resources for PowerPoint templates. You can download easily and regulate Business And IT Alignment Model Phase Background PDF for your personal presentations from our wonderful collection. A few clicks is all it takes to discover and get the most relevant and appropriate templates. Use our Templates to add a unique zing and appeal to your presentation and meetings. All the slides are easy to edit and you can use them even for advertisement purposes.
Multiple Project Workforce Capacity Tracker Sheet Themes PDF
The following slide showcases the staff capacity summary of various projects to trace additional tasks. It includes elements such as project demand, effective and potential work capacity, resource deficiency etc. Persuade your audience using this Multiple Project Workforce Capacity Tracker Sheet Themes PDF. This PPT design covers one stages, thus making it a great tool to use. It also caters to a variety of topics including Demand Estimate, Capacity Summary, Resource Deficiency. Download this PPT design now to present a convincing pitch that not only emphasizes the topic but also showcases your presentation skills.

Tools Of Ability Mapping Used By Companies Clipart Pdf
This slide shows the companies use competency mapping tools. The purpose of this slides ability to effectively bridge skill gaps .It includes various tools such as interview questionnaire, task forces, group work, learning resources,etc. Pitch your topic with ease and precision using this Tools Of Ability Mapping Used By Companies Clipart Pdf This layout presents information on Interview Questionnaire, Learning Resources, Features It is also available for immediate download and adjustment. So, changes can be made in the color, design, graphics or any other component to create a unique layout.
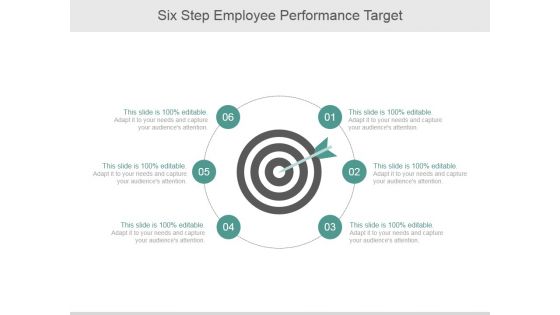
Six Step Employee Performance Target Ppt PowerPoint Presentation Professional
This is a six step employee performance target ppt powerpoint presentation professional. This is a six stage process. The stages in this process are circle, flow, process, strategy, planning, target.

HR Functioning Prior And Current Technology Implementation Diagrams PDF
The slide shows how Human resource role and functions evolved under the influence of new technology. It compares aspects like focus, research, function, skills and technology. Showcasing this set of slides titled HR Functioning Prior And Current Technology Implementation Diagrams PDF. The topics addressed in these templates are Executives Towards, Employee Retention, Developing Strategies. All the content presented in this PPT design is completely editable. Download it and make adjustments in color, background, font etc. as per your unique business setting.

Digital Promotion Techniques For Fashion Industry Rules PDF
Following slide provides information regarding marketing techniques utilized fashion companies to offer great customer experience and gain competitive edge. Execute, insights and resources are the key pillars demonstrated in this slide.Showcasing this set of slides titled Digital Promotion Techniques For Fashion Industry Rules PDF. The topics addressed in these templates are Approaches, Action Plan, Statistics, Impact. All the content presented in this PPT design is completely editable. Download it and make adjustments in color, background, font etc. as per your unique business setting.

Achievements Ppt PowerPoint Presentation Model Ideas
This is a achievements ppt powerpoint presentation model ideas. This is a five stage process. The stages in this process are achievements, strategy, winner, analysis, success, competition.
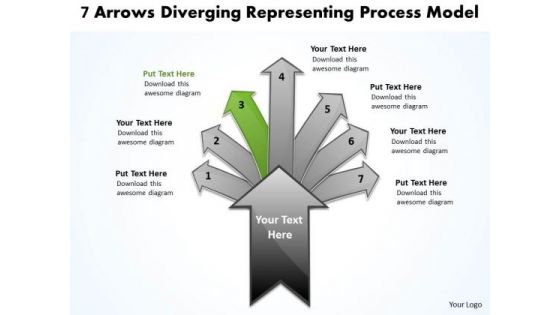
7 Arrows Diverging Representing Process Model Pie Network PowerPoint Templates
We present our 7 arrows diverging representing process model Pie Network PowerPoint templates.Download and present our Sale PowerPoint Templates because you are buzzing with ideas. Download and present our Arrows PowerPoint Templates because there is a very good saying that prevention is better than cure, either way you have a store of knowledge for sure. Use our Process and Flows PowerPoint Templates because you can enlighten your skills with the help of our topical templates. Download our Business PowerPoint Templates because you can gain the success to desired levels in one go. Download our Shapes PowerPoint Templates because you have configured your targets, identified your goals as per priority and importance.Use these PowerPoint slides for presentations relating to Abstract, Arrow, Art, Artistic, Background, Banner, Boost, Box, Business, Clip Art, Color, Colorful, Concept, Cover, Creative, Decide, Decision, Design, Direction, Finance, Futuristic, Graphic, Icon, Idea, Illustration, Increase, Info, Information, Journey, Label, Modern, Path, Pattern, Pop, Print, Process, Sale, Solution, Statistic, Sticker, Stylish, Template. The prominent colors used in the PowerPoint template are Green, Gray, Black. PowerPoint presentation experts tell us our 7 arrows diverging representing process model Pie Network PowerPoint templates are Flirty. People tell us our Business PowerPoint templates and PPT Slides look good visually. People tell us our 7 arrows diverging representing process model Pie Network PowerPoint templates are Swanky. Presenters tell us our Business PowerPoint templates and PPT Slides are Luxurious. Customers tell us our 7 arrows diverging representing process model Pie Network PowerPoint templates are Sparkling. The feedback we get is that our Box PowerPoint templates and PPT Slides are Zippy.

7 Arrows Diverging Representing Process Model Ppt Pie PowerPoint Templates
We present our 7 arrows diverging representing process model ppt Pie PowerPoint templates.Present our Sale PowerPoint Templates because our template will illustrate what you want to say. Download and present our Arrows PowerPoint Templates because you have the ideas to develop the teams vision of where they need to be in the future. Use our Process and Flows PowerPoint Templates because it helps to inject your values into your group and see them bond to achieve success. Download and present our Business PowerPoint Templates because Our PowerPoint Templates and Slides will let you Hit the right notes. Watch your audience start singing to your tune. Present our Shapes PowerPoint Templates because you can Signpost your preferred roadmap to your eager co- travellers and demonstrate clearly how you intend to navigate them towards the desired corporate goal.Use these PowerPoint slides for presentations relating to Abstract, Arrow, Art, Artistic, Background, Banner, Boost, Box, Business, Clip Art, Color, Colorful, Concept, Cover, Creative, Decide, Decision, Design, Direction, Finance, Futuristic, Graphic, Icon, Idea, Illustration, Increase, Info, Information, Journey, Label, Modern, Path, Pattern, Pop, Print, Process, Sale, Solution, Statistic, Sticker, Stylish, Template. The prominent colors used in the PowerPoint template are Blue, Gray, Black. PowerPoint presentation experts tell us our 7 arrows diverging representing process model ppt Pie PowerPoint templates are Upbeat. People tell us our Banner PowerPoint templates and PPT Slides are Fashionable. People tell us our 7 arrows diverging representing process model ppt Pie PowerPoint templates are Fashionable. Presenters tell us our Artistic PowerPoint templates and PPT Slides are Spectacular. Customers tell us our 7 arrows diverging representing process model ppt Pie PowerPoint templates are Energetic. The feedback we get is that our Banner PowerPoint templates and PPT Slides are Cheerful.

Task And Time Monitoring Of Retail Store Launch Rules PDF
This slide covers the various steps of launching a retail store. It includes a Gantt chart showing different tasks performed by different employees and the time taken in weeks to perform each task. Pitch your topic with ease and precision using this task and time monitoring of retail store launch rules pdf. This layout presents information on finance, organize business, plan. It is also available for immediate download and adjustment. So, changes can be made in the color, design, graphics or any other component to create a unique layout.

Data And Analytics Playbook The Escalating Value Of Data And Analytics Formats PDF
This template covers the facts about bigdata, business intelligence and data analytics. It also depicts that enterprise data and analytics solutions will drive growth and revenue, when optimized for different businesses. Presenting Data And Analytics Playbook The Escalating Value Of Data And Analytics Formats PDF to provide visual cues and insights. Share and navigate important information on seven stages that need your due attention. This template can be used to pitch topics like Big Data, Business Intelligence, Finance And Healthcare, Organization. In addtion, this PPT design contains high resolution images, graphics, etc, that are easily editable and available for immediate download.
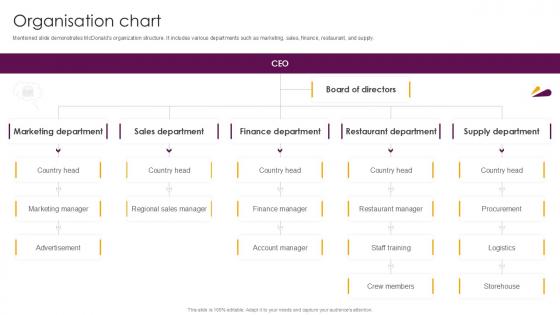
Organisation Chart Food And Beverages Company Profile Ppt Template CP SS V
Mentioned slide demonstrates McDonalds organization structure. It includes various departments such as marketing, sales, finance, restaurant, and supply. This Organisation Chart Food And Beverages Company Profile Ppt Template CP SS V from Slidegeeks makes it easy to present information on your topic with precision. It provides customization options, so you can make changes to the colors, design, graphics, or any other component to create a unique layout. It is also available for immediate download, so you can begin using it right away. Slidegeeks has done good research to ensure that you have everything you need to make your presentation stand out. Make a name out there for a brilliant performance.
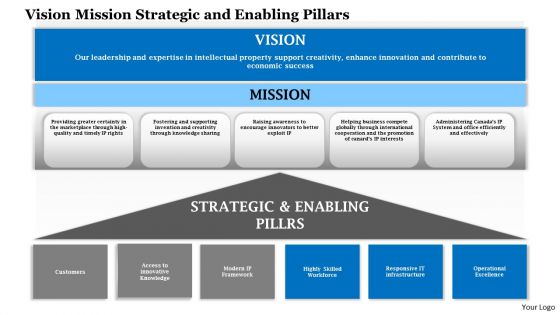
Business Framework Vision Mission Strategic And Enabling Pillars PowerPoint Presentation
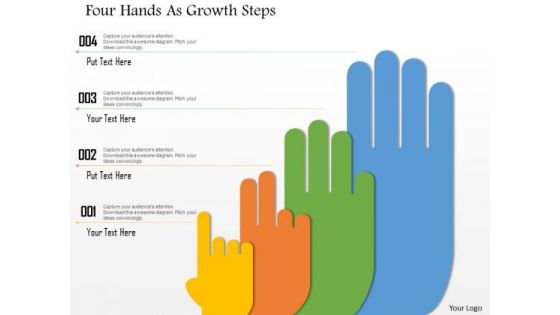
Business Diagram Four Hands As Growth Steps Presentation Template
This business diagram displays four staged hand process diagram. This professional diagram slide helps to display data and process flow. Use this slide for your business and marketing related presentations.
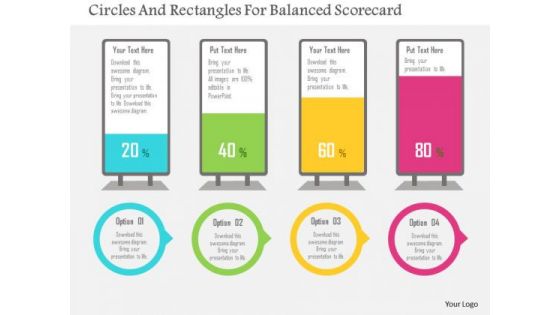
Business Diagram Circles And Rectangles For Balanced Scorecard Presentation Template
This business slide displays diagram of circles and rectangles. It helps to depict workflow or a process. This diagram offers a way for your audience to visually conceptualize the process.

Market Opportunity Analysis Powerpoint Slide Design Ideas
This is a market opportunity analysis powerpoint slide design ideas. This is a five stage process. The stages in this process are market opportunity analysis, market sizing and forecasting, market landscape analysis, trends analysis, market alerts newsletters.
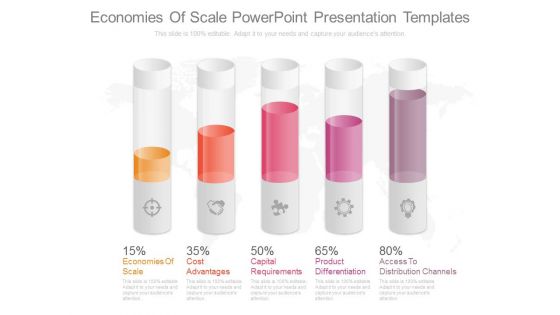
Economies Of Scale Powerpoint Presentation Templates
This is an economies of scale powerpoint presentation templates. This is a five stage process. The stages in this process are economies of scale, economies of scale, capital requirements, product differentiation, access to distribution channels.

World Map Example Ppt
This is a world map example ppt. This is a seven stage process. The stages in this process are north america, south america, arctic ocean, europe, asia, africa, australia.

Develop Knowledge Base Powerpoint Presentation Examples
This is a develop knowledge base powerpoint presentation examples. This is a four stage process. The stages in this process are assign leads, qualified leads, develop knowledge base, provided service.
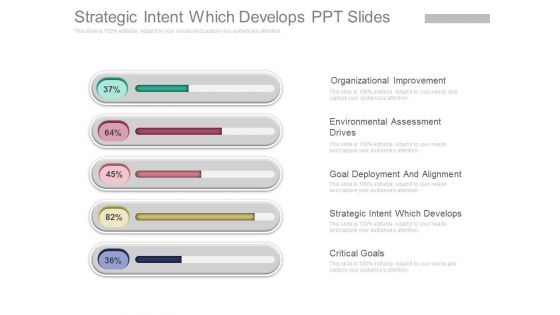
Strategic Intent Which Develops Ppt Slides
This is a strategic intent which develops ppt slides. This is a five stage process. The stages in this process are organizational improvement, environmental assessment drives, goal deployment and alignment, strategic intent which develops, critical goals.
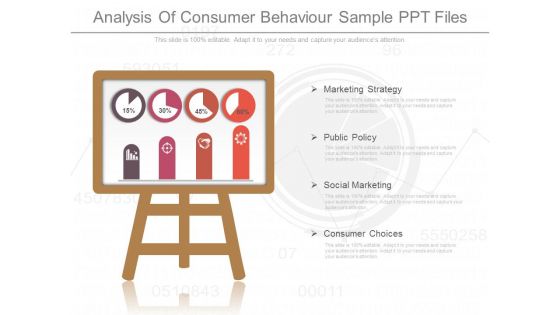
Analysis Of Consumer Behaviour Sample Ppt Files
This is a analysis of consumer behaviour sample ppt files. This is a four stage process. The stages in this process are marketing strategy, public policy, social marketing, consumer choices.
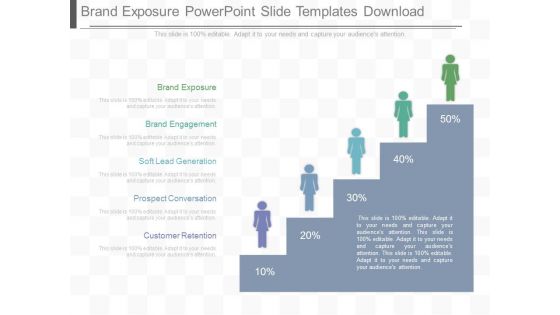
Brand Exposure Powerpoint Slide Templates Download
This is a brand exposure powerpoint slide templates download. This is a five stage process. The stages in this process are brand exposure, brand engagement, soft lead generation, prospect conversation, customer retention.
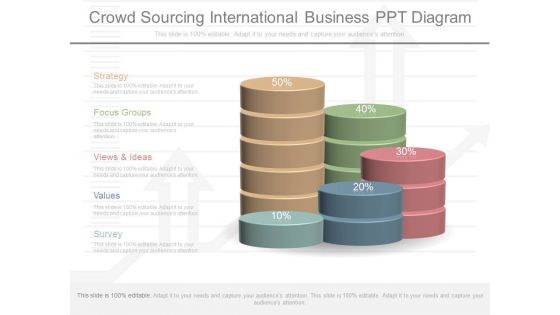
Crowd Sourcing International Business Ppt Diagram
This is a crowd sourcing international business ppt diagram. This is a five stage process. The stages in this process are strategy, focus groups, views and ideas, values, survey.\n\n\n
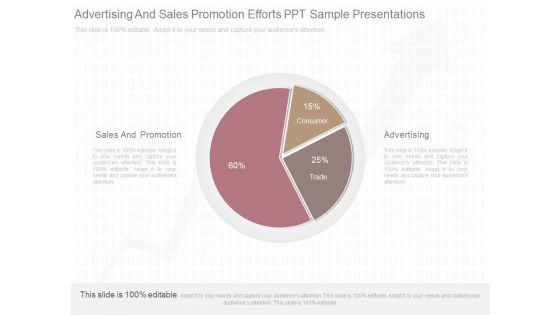
Advertising And Sales Promotion Efforts Ppt Sample Presentations
This is a advertising and sales promotion efforts ppt sample presentations. This is a three stage process. The stages in this process are consumer, trade, sales and promotion, advertising.

Financial Liberalization Growth Diagram Powerpoint Presentation
This is a financial liberalization growth diagram powerpoint presentation. This is a five stage process. The stages in this process are liberalization, pop growth, enrollment, gov gdp, life experience.

Financial Ratio Analysis And Interpretation Powerpoint Slides
This is a financial ratio analysis and interpretation powerpoint slides. This is a five stage process. The stages in this process are dividend policy ratios, profitability ratios, financial leverage ratio, asset turnover ratios, liquidity ratios.
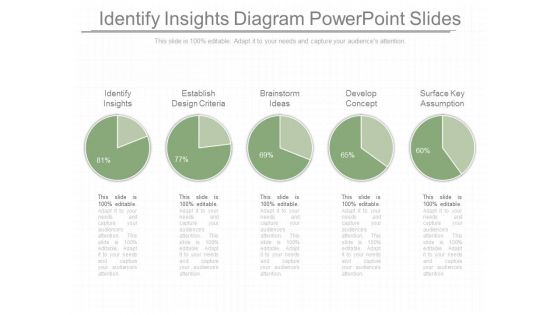
Identify Insights Diagram Powerpoint Slides
This is a identify insights diagram powerpoint slides. This is a five stage process. The stages in this process are identify insights, establish design criteria, brainstorm ideas, develop concept, surface key assumption.
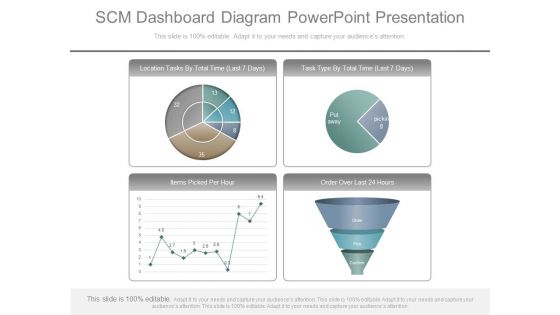
Scm Dashboard Diagram Powerpoint Presentation
This is a scm dashboard diagram powerpoint presentation. This is a four stage process. The stages in this process are location tasks by total time, task type by total time, items picked per hour, order over last.
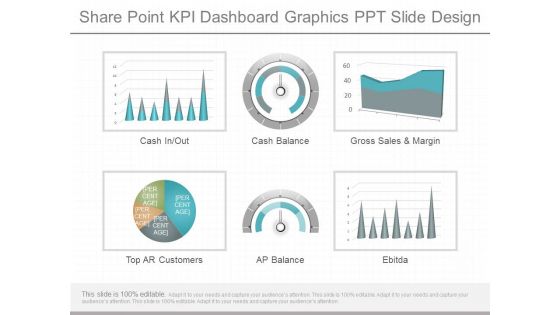
Share Point Kpi Dashboard Graphics Ppt Slide Design
This is a share point kpi dashboard graphics ppt slide design. This is a six stage process. The stages in this process are cash in out, cash balance, gross sales and margin, top ar customers, ap balance, ebitda.
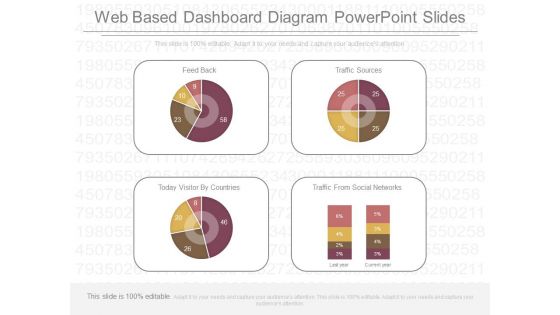
Web Based Dashboard Diagram Powerpoint Slides
This is a web based dashboard diagram powerpoint slides. This is a four stage process. The stages in this process are feed back, traffic sources, today visitor by countries, traffic from social networks.
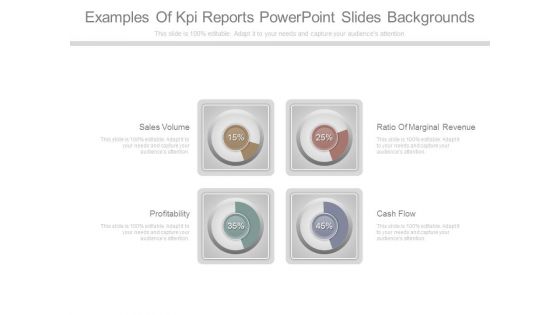
Examples Of Kpi Reports Powerpoint Slides Backgrounds
This is a examples of kpi reports powerpoint slides backgrounds. This is a four stage process. The stages in this process are sales volume, profitability, ratio of marginal revenue, cash flow.

Average Days Sales Outstanding Analysis Ppt Example
This is a average days sales outstanding analysis ppt example. This is a four stage process. The stages in this process are target for week, inventory, sales vs quotes, sales vs quotes.
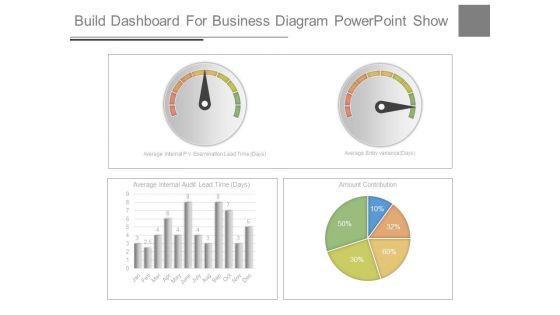
Build Dashboard For Business Diagram Powerpoint Show
This is a build dashboard for business diagram powerpoint show. This is a four stage process. The stages in this process are average internal pv examination lead time, average entry variance, average internal audit lead time, amount contribution.

Business Intelligence Dashboard Design Ppt Powerpoint Topics
This is a business intelligence dashboard design ppt powerpoint topics. This is a four stage process. The stages in this process are sales analysis, sales forecasting, global distribution, sales by region, latin america, north america, eastern europe, western europe.
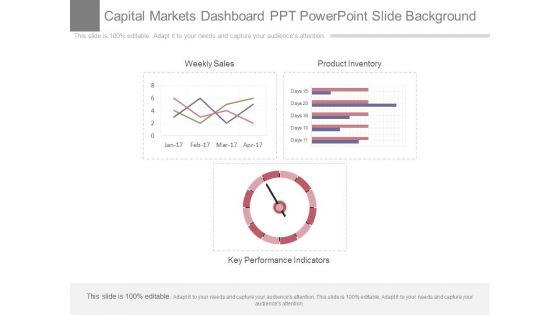
Capital Markets Dashboard Ppt Powerpoint Slide Background
This is a capital markets dashboard ppt powerpoint slide background. This is a three stage process. The stages in this process are weekly sales, product inventory, key performance indicators.
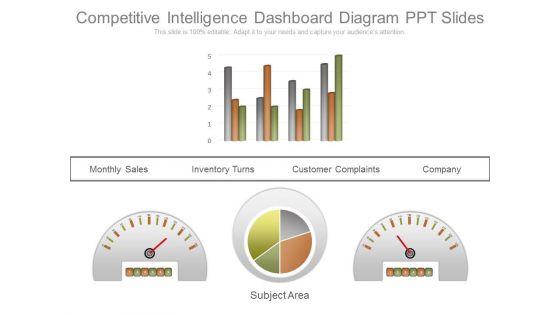
Competitive Intelligence Dashboard Diagram Ppt Slides
This is a competitive intelligence dashboard diagram ppt slides. This is a four stage process. The stages in this process are monthly sales, inventory turns, customer complaints, company, subject area.
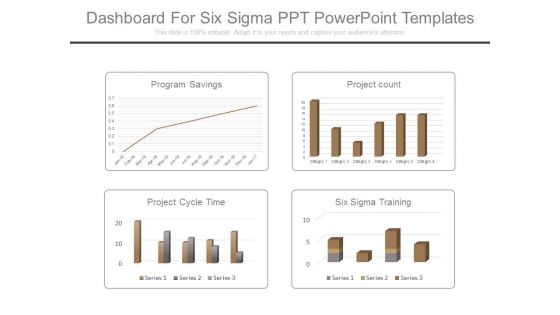
Dashboard For Six Sigma Ppt Powerpoint Templates
This is a dashboard for six sigma ppt powerpoint templates. This is a four stage process. The stages in this process are program savings, project count, project cycle time, six sigma training.

Dashboard Report Ppt Powerpoint Ideas
This is a dashboard report ppt powerpoint ideas. This is a six stage process. The stages in this process are sales vs quotes, target for week, the sales, inventory, revenue.

Dashboards And Kpis Graphics Powerpoint Slides
This is a dashboards and kpis graphics powerpoint slides. This is a two stage process. The stages in this process are dashboard, total sales, channel sales, direct sales, purchase payments.
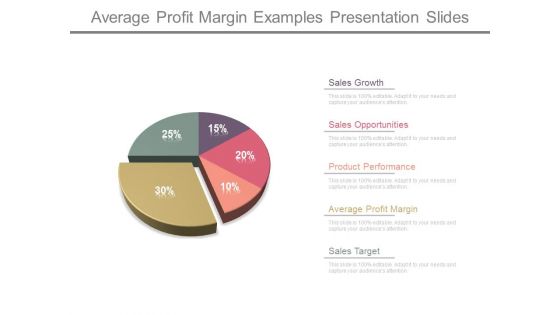
Average Profit Margin Examples Presentation Slides
This is a average profit margin examples presentation slides. This is a five stage process. The stages in this process are sales growth, sales opportunities, product performance, average profit margin, sales target.
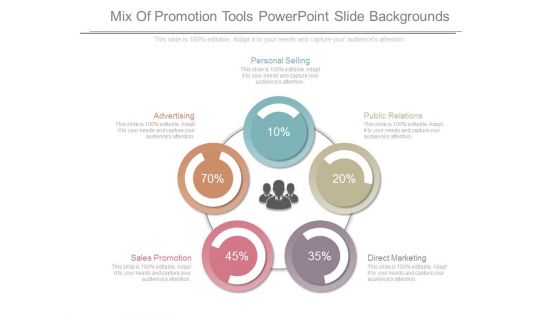
Mix Of Promotion Tools Powerpoint Slide Backgrounds
This is a mix of promotion tools powerpoint slide backgrounds. This is a five stage process. The stages in this process are personal selling, public relations, direct marketing, advertising, sales promotion.

Agile Lean Development Methodologies Diagram Sample Ppt Files
This is a agile lean development methodologies diagram sample ppt files. This is a four stage process. The stages in this process are create flow, brainstorm, design, establish pull.

Lean Strategy Deployment Diagram Powerpoint Guide
This is a lean strategy deployment diagram powerpoint guide. This is a six stage process. The stages in this process are self diagnosis, catch ball, check, lean tools, planning, customer order.
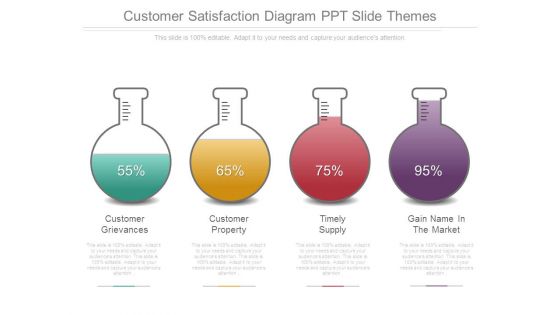
Customer Satisfaction Diagram Ppt Slide Themes
This is a customer satisfaction diagram ppt slide themes. This is a four stage process. The stages in this process are customer grievances, customer property, timely supply, gain name in the market.
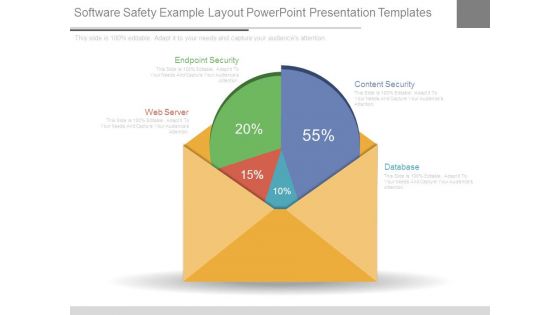
Software Safety Example Layout Powerpoint Presentation Templates
This is a software safety example layout powerpoint presentation templates. This is a four stage process. The stages in this process are web server, endpoint security, content security, database.

Kpi Dashboard Framework Ppt Powerpoint Slide Images
This is a kpi dashboard framework ppt powerpoint slide images. This is a five stage process. The stages in this process are business metrics, customer metrics, operational metrics, channel metrics, marketing metrics.

Kpis And Operations Metrics Presentation Powerpoint Example
This is a kpis and operations metrics presentation powerpoint example. This is a five stage process. The stages in this process are customer class, affiliate, sales by warehouse, warehouse, profit by affiliate.

Consumer Buying Behaviour Powerpoint Slide Presentation Sample
This is a consumer buying behaviour powerpoint slide presentation sample. This is a two stage process. The stages in this process are 7 out of 10 people bought online, now 8 out of 10 buy online.

Competition Competitor Positioning Chart Powerpoint Images
This is a competition competitor positioning chart powerpoint images. This is a four stage process. The stages in this process are gaining market share, losing market share, average market growth, company growth.
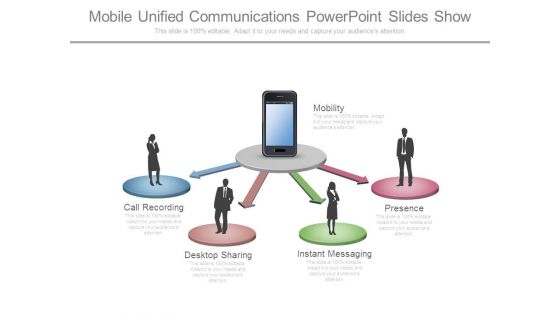
Mobile Unified Communications Powerpoint Slides Show
This is a mobile unified communications powerpoint slides show. This is a five stage process. The stages in this process are mobility, call recording, desktop sharing, instant messaging, presence.

Trend Line Technical Analysis Powerpoint Themes
This is a trend line technical analysis powerpoint themes. This is a five stage process. The stages in this process are complex systems, statistical modeling, uncertainty, lateral thinking, mathematical analysis.
Market Share And Competitor Positioning Graph Ppt Icon
This is a market share and competitor positioning graph ppt icon. This is a four stage process. The stages in this process are average market growth, company growth, gaining market share, losing market share.

Financial Analysis Ratios Ppt Slide Themes
This is a financial analysis ratios ppt slide themes. This is a five stage process. The stages in this process are liquidity ratio, asset turnover ratios, financial leverage ratios, profitability ratios, dividend policy ratios.
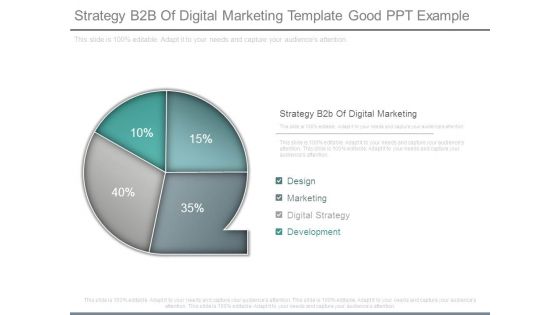
Strategy B2b Of Digital Marketing Template Good Ppt Example
This is a strategy b2b of digital marketing template good ppt example. This is a four stage process. The stages in this process are design, marketing, digital strategy, development.
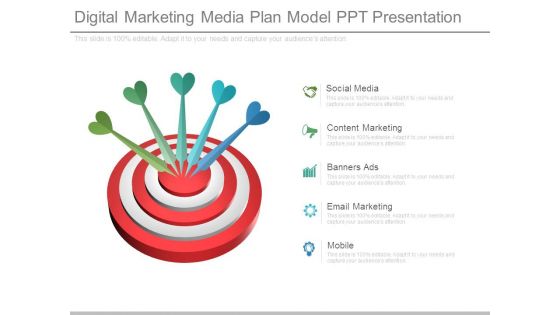
Digital Marketing Media Plan Model Ppt Presentation
This is a digital marketing media plan model ppt presentation. This is a five stage process. The stages in this process are social media, content marketing, banners ads, email marketing, mobile.

Sales And Marketing Plan Gantt Chart Ppt Examples Slides
This is a sales and marketing plan gantt chart ppt examples slides. This is a three stage process. The stages in this process are sales goal, sales actual, banner ads, newspaper, in store marketing.

Kips For Different Focus Areas Presentation Visuals
This is a kips for different focus areas presentation visuals. This is a four stage process. The stages in this process are area of focus, metrics, targets, objectives, invites, vision and strategy, focus.
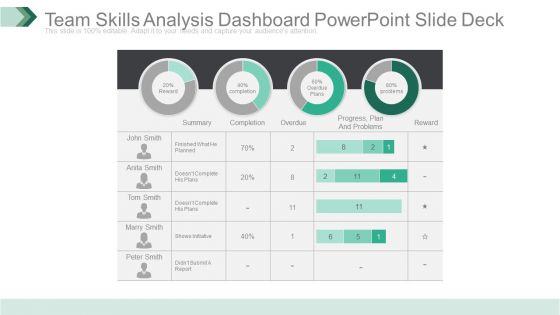
Team Skills Analysis Dashboard Powerpoint Slide Deck
This is a team skills analysis dashboard powerpoint slide deck. This is a four stage process. The stages in this process are reward, summary, completion, overdue, progress plan and problems, problems, reward.

 Home
Home