Continuous Improvement Plan
Pandl Kpis Tabular Form Ppt PowerPoint Presentation Gallery Icon
This is a pandl kpis tabular form ppt powerpoint presentation gallery icon. This is a four stage process. The stages in this process are revenue, cogs, operating profit, net profit.

Revenue Split By Product Segment Template 1 Ppt PowerPoint Presentation Summary Example
This is a revenue split by product segment template 1 ppt powerpoint presentation summary example. This is a four stage process. The stages in this process are bar, business, marketing, finance, analysis.
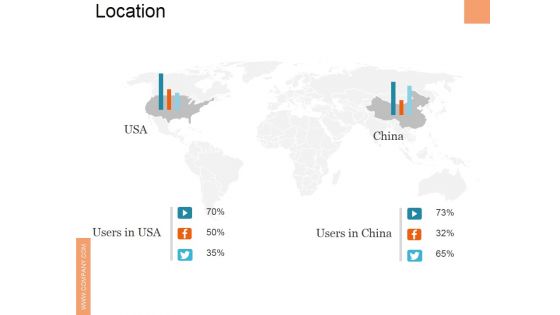
Location Ppt PowerPoint Presentation Styles Outfit
This is a location ppt powerpoint presentation styles outfit. This is a two stage process. The stages in this process are users in usa, users in china, usa, china.
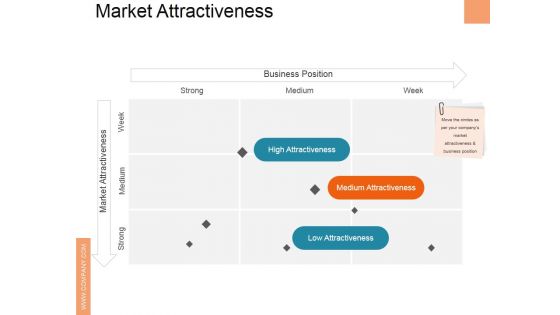
Market Attractiveness Ppt PowerPoint Presentation Pictures Templates
This is a market attractiveness ppt powerpoint presentation pictures templates. This is a three stage process. The stages in this process are business position, market attractiveness, high attractiveness, medium attractiveness, low attractiveness.
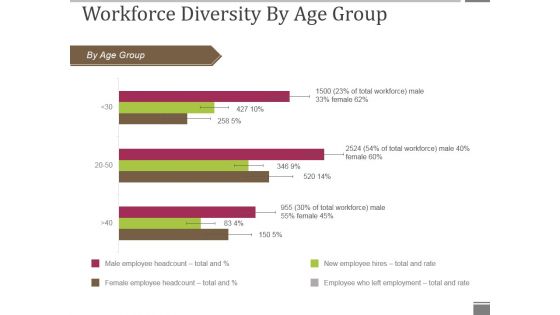
Workforce Diversity By Age Group Ppt PowerPoint Presentation Visual Aids Gallery
This is a workforce diversity by age group ppt powerpoint presentation visual aids gallery. This is a three stage process. The stages in this process are by age group, bar graph, business, marketing, presentation.
Workforce Diversity By Region Ppt PowerPoint Presentation Icon Graphics Pictures
This is a workforce diversity by region ppt powerpoint presentation icon graphics pictures. This is a four stage process. The stages in this process are by region, bar graph, business, presentation, marketing.

Internal Analysis Workforce Trends Ppt PowerPoint Presentation Example
This is a internal analysis workforce trends ppt powerpoint presentation example. This is a four stage process. The stages in this process are workforce trends, business, marketing, bar, finance.
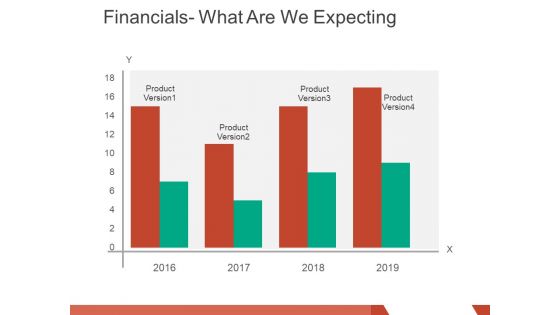
financials what are we expecting ppt powerpoint presentation layouts graphics pictures
This is a financials what are we expecting ppt powerpoint presentation layouts graphics pictures. This is a four stage process. The stages in this process are product version, business, marketing, finance, graph.
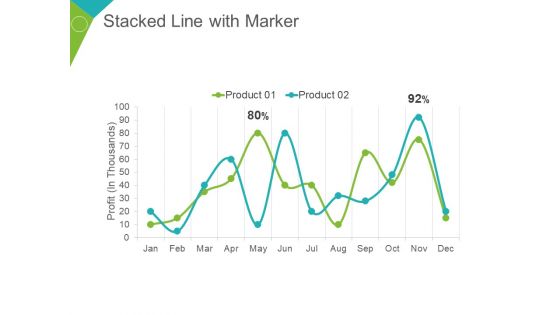
Stacked Line With Marker Ppt PowerPoint Presentation Summary Demonstration
This is a stacked line with marker ppt powerpoint presentation summary demonstration. This is a two stage process. The stages in this process are profit in thousands, product, percentage, finance, business.

Us Vs Competitors Template 2 Ppt PowerPoint Presentation File Show
This is a us vs competitors template 2 ppt powerpoint presentation file show. This is a nine stage process. The stages in this process are competitor, graph, business, marketing, finance.
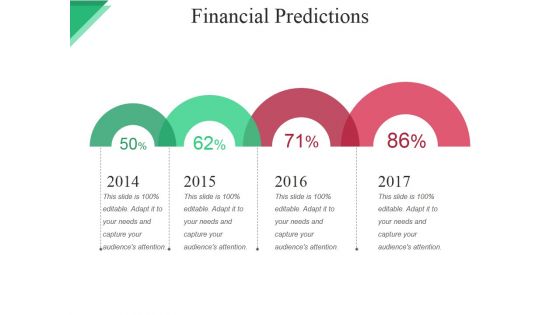
Financial Predictions Ppt PowerPoint Presentation File Clipart Images
This is a financial predictions ppt powerpoint presentation file clipart images. This is a three stage process. The stages in this process are revenue, expense, aggregate net income, monthly breakeven, aggregate breakeven.
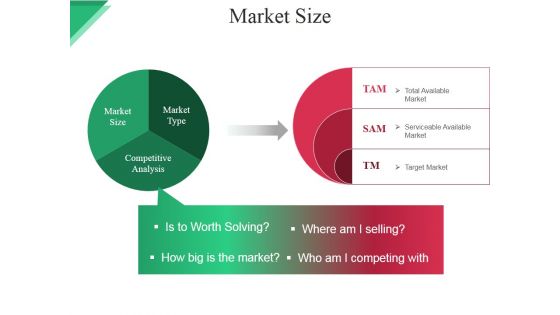
Market Size Ppt PowerPoint Presentation Microsoft
This is a market size ppt powerpoint presentation microsoft. This is a three stage process. The stages in this process are market size, market type, competitive analysis, where am i selling, total available market.
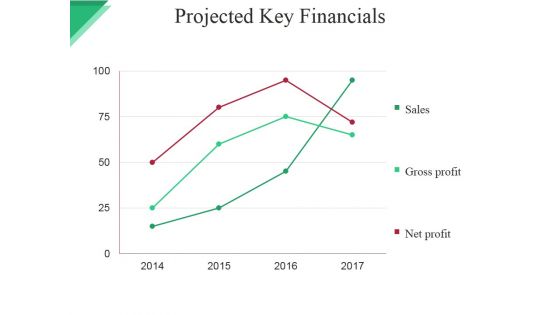
Projected Key Financials Template Ppt PowerPoint Presentation File Graphic Images
This is a projected key financials template ppt powerpoint presentation file graphic images. This is a four stage process. The stages in this process are sales, gross profit, net profit.

Gap Between Current And Required Staff Ppt PowerPoint Presentation Ideas Format Ideas
This is a gap between current and required staff ppt powerpoint presentation ideas format ideas. This is a five stage process. The stages in this process are number of staff, category, current, graph, finance.

Projected Key Financials Template 1 Ppt PowerPoint Presentation Summary Professional
This is a projected key financials template 1 ppt powerpoint presentation summary professional. This is a three stage process. The stages in this process are in dollar, sales, gross profit, net profit, graph, year.
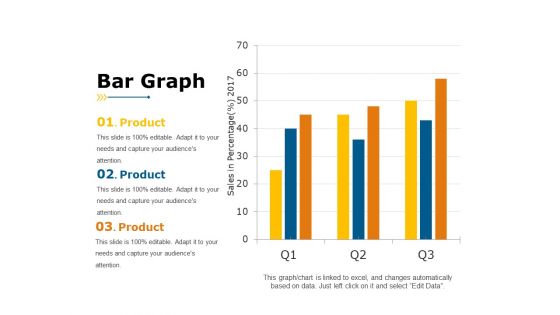
Bar Graph Ppt PowerPoint Presentation Portfolio Example
This is a bar graph ppt powerpoint presentation portfolio example. This is a three stage process. The stages in this process are sales in percentage, year, business, product, business, graph.

Area Stacked Ppt PowerPoint Presentation Diagram Images
This is a area stacked ppt powerpoint presentation diagram images. This is a two stage process. The stages in this process are sales in percentage, product, business, marketing, finance.
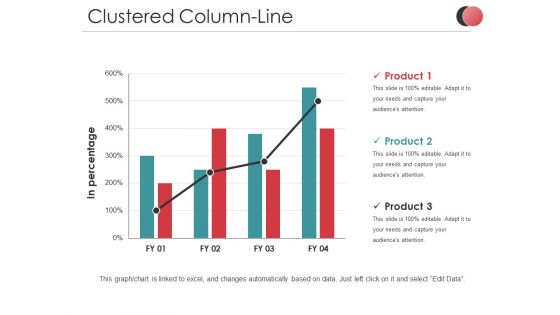
Clustered Column Line Ppt PowerPoint Presentation Infographics Templates
This is a clustered column line ppt powerpoint presentation infographics templates. This is a three stage process. The stages in this process are in percentage, business, marketing, product, finance, graph.
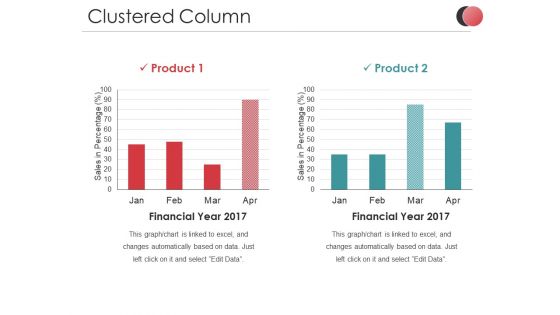
Clustered Column Ppt PowerPoint Presentation Slides Ideas
This is a clustered column ppt powerpoint presentation slides ideas. This is a two stage process. The stages in this process are sales in percentage, business, marketing, finance, graph.
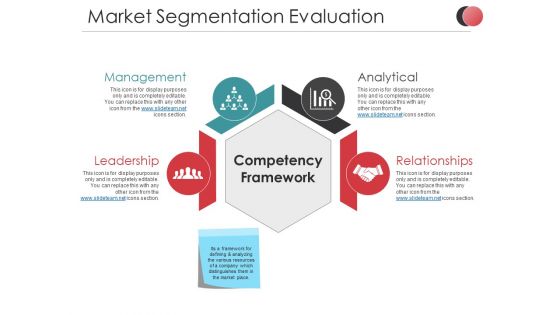
Market Segmentation Evaluation Ppt PowerPoint Presentation Summary Slideshow
This is a market segmentation evaluation ppt powerpoint presentation summary slideshow. This is a two stage process. The stages in this process are net profit, market sales, business, marketing, finance, icons.
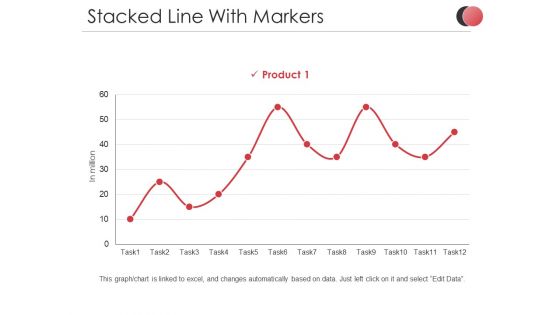
Stacked Line With Markers Ppt PowerPoint Presentation Slides Demonstration
This is a stacked line with markers ppt powerpoint presentation slides demonstration. This is a one stage process. The stages in this process are in million, product, percentage, business, marketing, finance.

Stacked Column Ppt PowerPoint Presentation Infographics Samples
This is a stacked column ppt powerpoint presentation infographics samples. This is a two stage process. The stages in this process are product, sales in percentage, business, marketing, graph.
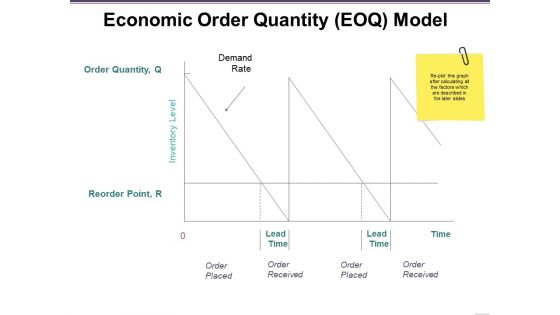
Economic Order Quantity Eoq Model Ppt PowerPoint Presentation Ideas Deck
This is a economic order quantity eoq model ppt powerpoint presentation ideas deck. This is a three stage process. The stages in this process are demand rate, order placed, order received, lead time, time, inventory level.
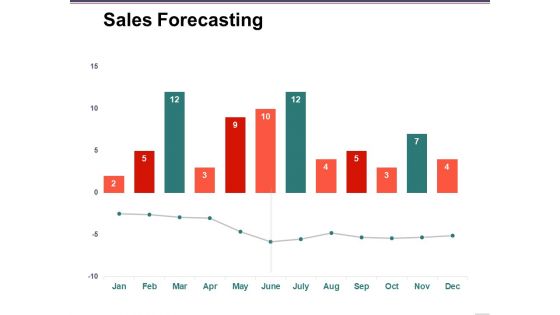
Sales Forecasting Template 2 Ppt PowerPoint Presentation Infographic Template Examples
This is a sales forecasting template 2 ppt powerpoint presentation infographic template examples. This is a two stage process. The stages in this process are forecasting, business, marketing, finance, graph.

Bar Graph Template 2 Ppt PowerPoint Presentation Ideas Files
This is a bar graph template 2 ppt powerpoint presentation ideas files. This is a five stage process. The stages in this process are in percentage, business, marketing, finance, graph.

Clustered Column Ppt PowerPoint Presentation Ideas Graphic Tips
This is a clustered column ppt powerpoint presentation ideas graphic tips. This is a two stage process. The stages in this process are financial year, sales in percentage, product, graph, business.

Stacked Column Ppt PowerPoint Presentation Professional Vector
This is a stacked column ppt powerpoint presentation professional vector. This is a two stage process. The stages in this process are product, sales in percentage, business, marketing, graph.
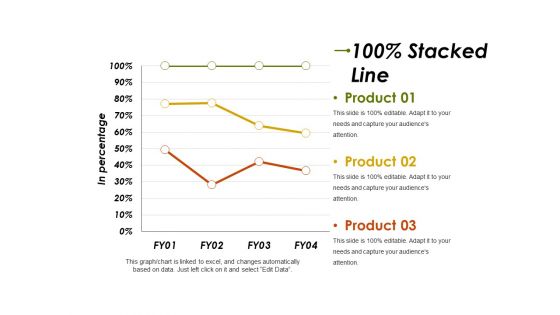
Stacked Line Ppt PowerPoint Presentation Infographic Template Graphics Template
This is a stacked line ppt powerpoint presentation infographic template graphics template. This is a three stage process. The stages in this process are product, in percentage, business, marketing, finance.

Clustered Column Ppt PowerPoint Presentation Portfolio Smartart
This is a clustered column ppt powerpoint presentation portfolio smartart. This is a two stage process. The stages in this process are financial year, product, sales in percentage, finance, business, graph.

Clustered Column Ppt PowerPoint Presentation Pictures Mockup
This is a clustered column ppt powerpoint presentation pictures mockup. This is a two stage process. The stages in this process are product, sales in percentage, financial year, graph, business.
Open High Low Close Ppt PowerPoint Presentation Icon Model
This is a open high low close ppt powerpoint presentation icon model. This is a five stage process. The stages in this process are high, low, product, business, finance.

Bar Graph Ppt PowerPoint Presentation Infographics Graphics Design
This is a bar graph ppt powerpoint presentation infographics graphics design. This is a five stage process. The stages in this process are bar graph, business, years, marketing, management.

Clustered Bar Ppt PowerPoint Presentation Show Slide Portrait
This is a clustered bar ppt powerpoint presentation show slide portrait. This is a four stage process. The stages in this process are product, unit count, graph, business, marketing.

Clustered Column Ppt PowerPoint Presentation Professional Graphic Tips
This is a clustered column ppt powerpoint presentation professional graphic tips. This is a two stage process. The stages in this process are product, profit in percentage, graph, business, marketing.

Clustered Column Ppt PowerPoint Presentation Inspiration Shapes
This is a clustered column ppt powerpoint presentation inspiration shapes. This is a two stage process. The stages in this process are profit in percentage, business, marketing, graph, finance.
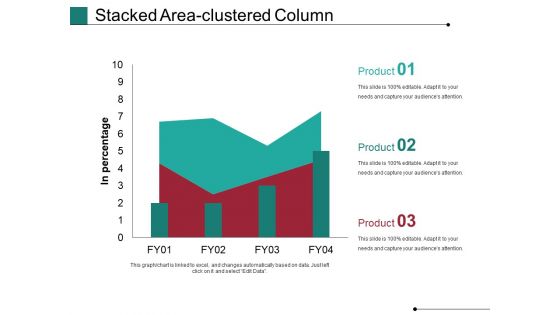
Stacked Area Clustered Column Ppt PowerPoint Presentation Ideas Show
This is a stacked area clustered column ppt powerpoint presentation ideas show. This is a three stage process. The stages in this process are in percentage, business, marketing, finance, graph.
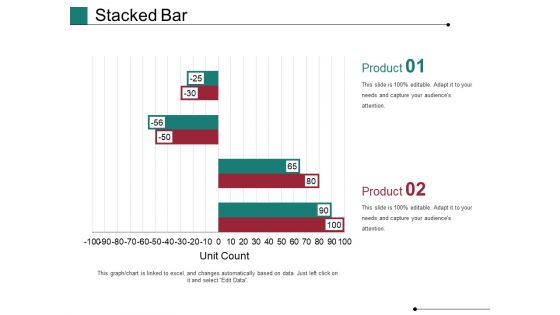
Stacked Bar Template 1 Ppt PowerPoint Presentation Show Slides
This is a stacked bar template 1 ppt powerpoint presentation show slides. This is a two stage process. The stages in this process are Unit Count, Business, Marketing, Graph, Finance.

Stacked Bar Template 2 Ppt PowerPoint Presentation Model Graphic Images
This is a stacked bar template 2 ppt powerpoint presentation model graphic images. This is a two stage process. The stages in this process are business, years, marketing, percentage, finance.

Stacked Bar Ppt PowerPoint Presentation Infographic Template Infographic Template
This is a stacked bar ppt powerpoint presentation infographic template infographic template. This is a four stage process. The stages in this process are business, marketing, finance, slide bar, graph.
Stacked Area Clustered Column Ppt PowerPoint Presentation Icon Aids
This is a stacked area clustered column ppt powerpoint presentation icon aids. This is a three stage process. The stages in this process are business, marketing, finance, bar, graph.
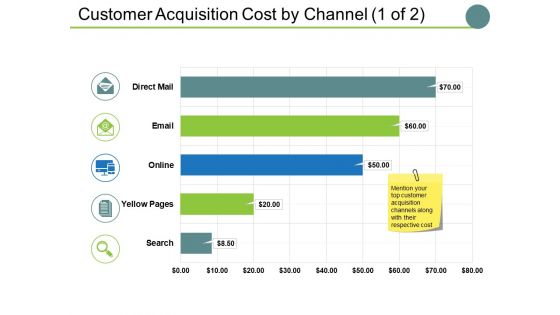
Customer Acquisition Cost By Channel Template 1 Ppt PowerPoint Presentation Portfolio Mockup
This is a customer acquisition cost by channel template 1 ppt powerpoint presentation portfolio mockup. This is a five stage process. The stages in this process are finance, business, graph, online, marketing.
Stacked Line Ppt PowerPoint Presentation Icon Format Ideas
This is a stacked line ppt powerpoint presentation icon format ideas. This is a three stage process. The stages in this process are product, in percentage, stacked line, finance.

Stacked Bar Template 1 Ppt PowerPoint Presentation Gallery Clipart
This is a stacked bar template 1 ppt powerpoint presentation gallery clipart. This is a two stage process. The stages in this process are percentage, graph, business, marketing, finance.

Nurturing Ppt PowerPoint Presentation Summary Brochure
This is a nurturing ppt powerpoint presentation summary brochure. This is a seven stage process. The stages in this process are segmenting lead data, nurturing campaign workflows, targeting by prospect persona, personalizing campaigns, creating relevant content.

Stacked Line With Markers Ppt PowerPoint Presentation Infographic Template Graphics Example
This is a stacked line with markers ppt powerpoint presentation infographic template graphics example. This is a one stage process. The stages in this process are in million, task, product, finance, line graph.
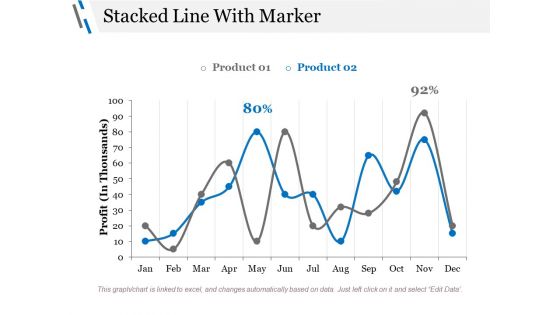
Stacked Line With Marker Ppt PowerPoint Presentation Styles Graphics Design
This is a stacked line with marker ppt powerpoint presentation styles graphics design. This is a three stage process. The stages in this process are profit, business, marketing, finance, percentage.
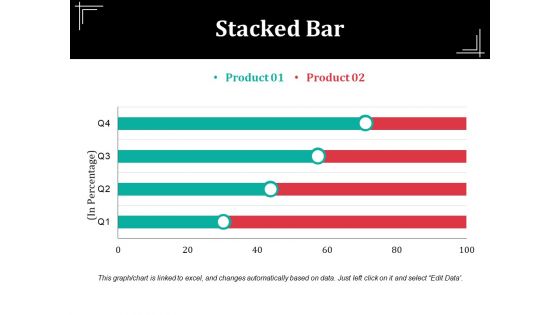
Stacked Bar Template Ppt PowerPoint Presentation Summary Visual Aids
This is a stacked bar template ppt powerpoint presentation summary visual aids. This is a three stage process. The stages in this process are unit count, business, marketing, finance, graph.
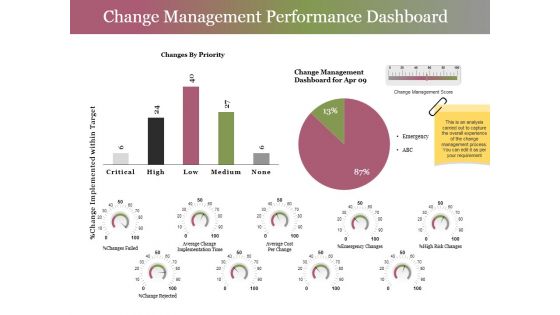
Change Management Performance Dashboard Ppt PowerPoint Presentation Layouts Master Slide
This is a change management performance dashboard ppt powerpoint presentation layouts master slide. This is a three stage process. The stages in this process are critical, high, low, medium, none.

Results Ppt PowerPoint Presentation Summary Inspiration
This is a results ppt powerpoint presentation summary inspiration. This is a seven stage process. The stages in this process are effective leadership at all levels, strong customer focus, commitment to learning and change.
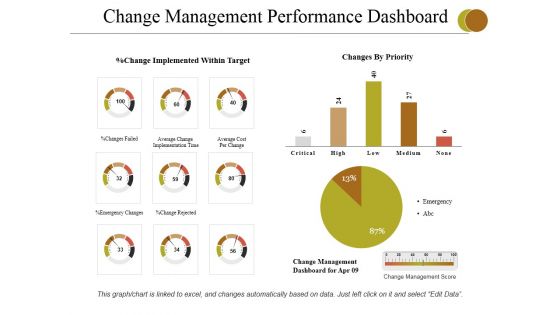
Change Management Performance Dashboard Ppt PowerPoint Presentation Infographics Topics
This is a change management performance dashboard ppt powerpoint presentation infographics topics. This is a Three stage process. The stages in this process are emergency changes, change rejected, changes failed, average cost per change, emergency.

Logo Designing Sources Ppt PowerPoint Presentation Show Themes
This is a logo designing sources ppt powerpoint presentation show themes. This is a five stage process. The stages in this process are self employed, online design firm, local design, others, friends relative.

Change Management Performance Dashboard Ppt PowerPoint Presentation Summary Background Image
This is a change management performance dashboard ppt powerpoint presentation summary background image. This is a three stage process. The stages in this process are high risk changes, average change, implementation time, emergency changes, average cost per change, change rejected.

Define Role Of Leadership In Cm Ppt PowerPoint Presentation Model Example Introduction
This is a define role of leadership in cm ppt powerpoint presentation model example introduction. This is a five stage process. The stages in this process are vision, energizing people, communication, charisma, competence.

Member Profile Ppt PowerPoint Presentation Layouts Styles
This is a member profile ppt powerpoint presentation layouts styles. This is a four stage process. The stages in this process are art director, personal skills, percentage, finance, icons.

Our Market Share Ppt PowerPoint Presentation Portfolio Example Introduction
This is a our market share ppt powerpoint presentation portfolio example introduction. This is a four stage process. The stages in this process are business, marketing, pie, finance, percentage.

Budgeting Template 2 Ppt PowerPoint Presentation Pictures Model
This is a budgeting template 2 ppt powerpoint presentation pictures model. This is a five stage process. The stages in this process are cost item, year, budgeting template, cost, total.
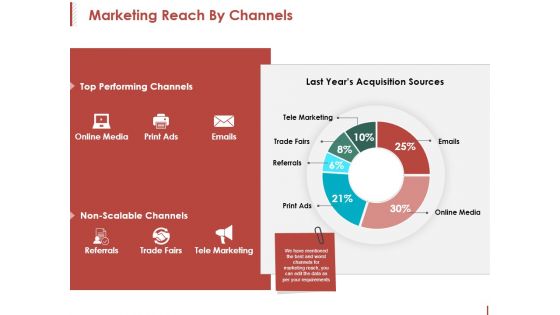
Marketing Reach By Channels Ppt PowerPoint Presentation Pictures Inspiration
This is a marketing reach by channels ppt powerpoint presentation pictures inspiration. This is a six stage process. The stages in this process are tele marketing, trade fairs, referrals, print ads, emails.
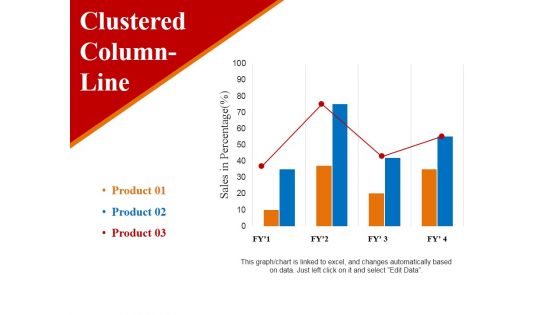
clustered column line ppt powerpoint presentation ideas example
This is a clustered column line ppt powerpoint presentation ideas example. This is a three stage process. The stages in this process are sales in percentage, business, marketing, finance, graph.

Project Management Dashboard Ppt PowerPoint Presentation Portfolio Portrait
This is a project management dashboard ppt powerpoint presentation portfolio portrait. This is a five stage process. The stages in this process are overall task status, assigned to, budget, pending items, business.
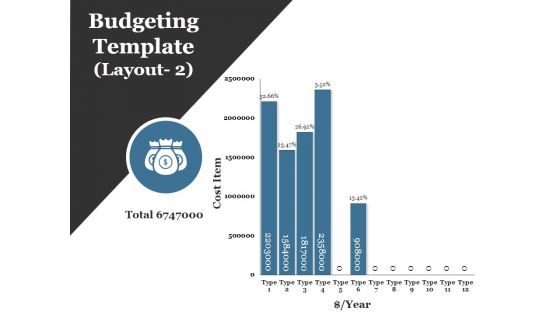
Budgeting Template 3 Ppt PowerPoint Presentation Ideas Graphics Tutorials
This is a budgeting template 3 ppt powerpoint presentation ideas graphics tutorials. This is a five stage process. The stages in this process are cost item, year, total, type, budgeting template.

 Home
Home