Capacity Dashboard

Differentiation Techniques Ways To Surpass Competitors Distribution Channel Effectiveness Measurement Dashboard Ideas PDF
The following slide helps organization in understanding the effect of their differentiation strategy. It highlight essential metrics such as retailer capacity, warehouse capacity etc. Deliver an awe inspiring pitch with this creative Differentiation Techniques Ways To Surpass Competitors Distribution Channel Effectiveness Measurement Dashboard Ideas PDF bundle. Topics like Profitability, Risk, Retailer can be discussed with this completely editable template. It is available for immediate download depending on the needs and requirements of the user.
Data Project Lifecycle Management Dashboard To Ensure Better Decision Making Icons PDF
This slide covers data lifecycle management dashboard to ensure better decision making. It involves details such as capacity based on department, classification of files and email audit.Showcasing this set of slides titled Data Project Lifecycle Management Dashboard To Ensure Better Decision Making Icons PDF. The topics addressed in these templates are Redudant Content, Abandoned Files, Capacity Department. All the content presented in this PPT design is completely editable. Download it and make adjustments in color, background, font etc. as per your unique business setting.
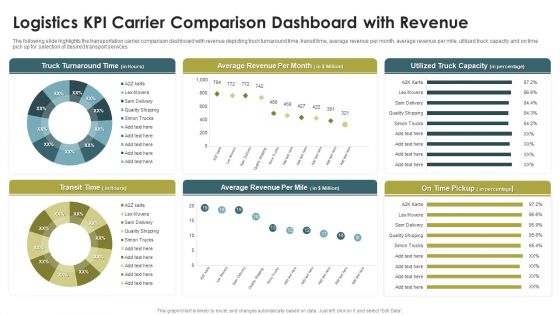
Logistics KPI Carrier Comparison Dashboard With Revenue Ppt Infographics Portfolio PDF
The following slide highlights the transportation carrier comparison dashboard with revenue depicting truck turnaround time, transit time, average revenue per month, average revenue per mile, utilized truck capacity and on time pick up for selection of desired transport services. Pitch your topic with ease and precision using this Logistics KPI Carrier Comparison Dashboard With Revenue Ppt Infographics Portfolio PDF. This layout presents information on Truck Turnaround Time, Average Revenue, Per Month, Transit Time. It is also available for immediate download and adjustment. So, changes can be made in the color, design, graphics or any other component to create a unique layout.

Operational Dashboards Powerpoint Slide Examples
This is a operational dashboards powerpoint slide examples. This is a five stage process. The stages in this process are cost reduction, capacity improvement, flexibility, cycle time reduction, labor productivity.

Analytics Dashboard Measuring Digital Transformation Journey PPT Slide DT SS V
This slide analyses analytics dashboard measuring the effect of adopting digital initiatives on power production efficiency. It includes total capacity, average efficiency of turbines, system frequency and energy production efficiency. Do you have to make sure that everyone on your team knows about any specific topic I yes, then you should give Analytics Dashboard Measuring Digital Transformation Journey PPT Slide DT SS V a try. Our experts have put a lot of knowledge and effort into creating this impeccable Analytics Dashboard Measuring Digital Transformation Journey PPT Slide DT SS V. You can use this template for your upcoming presentations, as the slides are perfect to represent even the tiniest detail. You can download these templates from the Slidegeeks website and these are easy to edit. So grab these today

Customer Attrition Rate Dashboard For IBN Outsourcing Company PPT Template SS
This slide shows a Customer Attrition Rate Dashboard with KPIs such as Company Revenue , Customer Attrition Rate in 2021 , Annual Growth Rate , Average Customer Queue Time , Onboarding Process Effectiveness etc. There are so many reasons you need a Customer Attrition Rate Dashboard For IBN Outsourcing Company PPT Template SS. The first reason is you can not spend time making everything from scratch, Thus, Slidegeeks has made presentation templates for you too. You can easily download these templates from our website easily.
New Hires Data Tracker Dashboard Employee Attraction And Competency Ppt Slide
This slide shows dashboard including date related to new hires for recruitment. It include data related to new hires per month, new hires for various departments and by sources, etc. Coming up with a presentation necessitates that the majority of the effort goes into the content and the message you intend to convey. The visuals of a PowerPoint presentation can only be effective if it supplements and supports the story that is being told. Keeping this in mind our experts created New Hires Data Tracker Dashboard Employee Attraction And Competency Ppt Slide to reduce the time that goes into designing the presentation. This way, you can concentrate on the message while our designers take care of providing you with the right template for the situation.
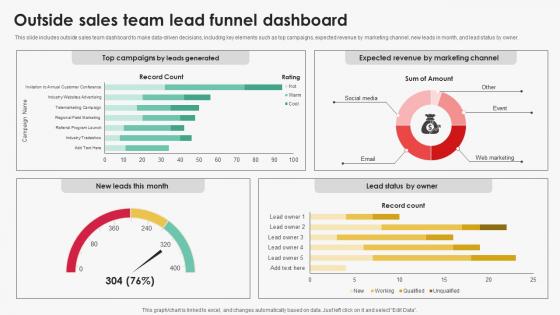
Outside Sales Team Lead Funnel Dashboard Efficient Sales Territory Management To Build SA SS V
This slide includes outside sales team dashboard to make data-driven decisions, including key elements such as top campaigns, expected revenue by marketing channel, new leads in month, and lead status by owner. Retrieve professionally designed Outside Sales Team Lead Funnel Dashboard Efficient Sales Territory Management To Build SA SS V to effectively convey your message and captivate your listeners. Save time by selecting pre-made slideshows that are appropriate for various topics, from business to educational purposes. These themes come in many different styles, from creative to corporate, and all of them are easily adjustable and can be edited quickly. Access them as PowerPoint templates or as Google Slides themes. You do not have to go on a hunt for the perfect presentation because Slidegeeks got you covered from everywhere.
Administering Logistics Activities In SCM Supply Chain Activity Tracking Dashboard Elements PDF
This slide shows the dashboard that depicts supply chain management which includes retailer and warehouse capacity, delivery status from supplier to warehouse, time to reach there, etc. Deliver and pitch your topic in the best possible manner with this Administering Logistics Activities In SCM Supply Chain Activity Tracking Dashboard Elements PDF. Use them to share invaluable insights on Warehouse Capacity, Profitability, Sustainability and impress your audience. This template can be altered and modified as per your expectations. So, grab it now.
Developing Excellence In Logistics Operations Supply Chain Activity Tracking Dashboard Elements PDF
This slide shows the dashboard that depicts supply chain management which includes retailer and warehouse capacity, delivery status from supplier to warehouse, time to reach there, etc.Deliver and pitch your topic in the best possible manner with this Developing Excellence In Logistics Operations Supply Chain Activity Tracking Dashboard Elements PDF Use them to share invaluable insights on Reach Warehouse, Warehouse Capacity, Supplier To Warehouse and impress your audience. This template can be altered and modified as per your expectations. So, grab it now.

Actual And Planned Partner Executive Performance Dashboard Ppt Show Outline PDF
This slide covers the partner executive dashboard that focuses on revenues, pipeline, capability scoreboard, along with actual and planned values quarterly. Deliver an awe inspiring pitch with this creative actual and planned partner executive performance dashboard ppt show outline pdf bundle. Topics like actual and planned partner executive performance dashboard can be discussed with this completely editable template. It is available for immediate download depending on the needs and requirements of the user.
Automating Supply Chain Dashboard For Tracking Impact Of Supply Chain Automation Pictures PDF
This slide covers the dashboard for back-end tracking of overall impact automation. It include KPIs such as retailer capacity, warehouse capacity, truck efficiency, time to reach warehouse, sustainability, etc. Deliver and pitch your topic in the best possible manner with this Automating Supply Chain Dashboard For Tracking Impact Of Supply Chain Automation Pictures PDF. Use them to share invaluable insights on Supply Chain Manager, Warehouse Manager, Truck Driver and impress your audience. This template can be altered and modified as per your expectations. So, grab it now.
Streamlining Operations With Supply Chain Automation Dashboard For Tracking Impact Of Supply Chain Automation Slides PDF
This slide covers the dashboard for back end tracking of overall impact automation. It include KPIs such as retailer capacity, warehouse capacity, truck efficiency, time to reach warehouse, sustainability, etc. There are so many reasons you need a Streamlining Operations With Supply Chain Automation Dashboard For Tracking Impact Of Supply Chain Automation Slides PDF. The first reason is you can not spend time making everything from scratch, Thus, Slidegeeks has made presentation templates for you too. You can easily download these templates from our website easily.
Optimizing Logistics Management Process Supply Chain Activity Tracking Dashboard Introduction PDF
This slide shows the dashboard that depicts supply chain management which includes retailer and warehouse capacity, delivery status from supplier to warehouse, time to reach there, etc. Deliver an awe inspiring pitch with this creative optimizing logistics management process supply chain activity tracking dashboard introduction pdf bundle. Topics like supply chain activity tracking dashboard can be discussed with this completely editable template. It is available for immediate download depending on the needs and requirements of the user.
Unlocking Potential IoTs Application Dashboard For Tracking IoT Devices Performance IoT SS V
This slide provides a dashboard for monitoring IoT devices that enhance agricultural practices. It incorporates IoT sensors to measure water tank capacity, Live crop monitoring, temperature and humidity measurements, control sprinklers, etc. Make sure to capture your audiences attention in your business displays with our gratis customizable Unlocking Potential IoTs Application Dashboard For Tracking IoT Devices Performance IoT SS V. These are great for business strategies, office conferences, capital raising or task suggestions. If you desire to acquire more customers for your tech business and ensure they stay satisfied, create your own sales presentation with these plain slides.
Continual Improvement Procedure In Supply Chain Supply Chain Activity Tracking Dashboard Background PDF
This slide shows the dashboard that depicts supply chain management which includes retailer and warehouse capacity, delivery status from supplier to warehouse, time to reach there, etc.Deliver and pitch your topic in the best possible manner with this Continual Improvement Procedure In Supply Chain Supply Chain Activity Tracking Dashboard Background PDF. Use them to share invaluable insights on Segregating Products, Ensuring Optimized, Additional Responsibilities and impress your audience. This template can be altered and modified as per your expectations. So, grab it now.
Integrating AI To Enhance Dashboard For Tracking Impact Of Supply Chain Automation Themes PDF
This slide covers the dashboard for back-end tracking of overall impact automation. It include KPIs such as retailer capacity, warehouse capacity, truck efficiency, time to reach warehouse, sustainability, etc. Do you have an important presentation coming up Are you looking for something that will make your presentation stand out from the rest Look no further than Integrating AI To Enhance Dashboard For Tracking Impact Of Supply Chain Automation Themes PDF. With our professional designs, you can trust that your presentation will pop and make delivering it a smooth process. And with Slidegeeks, you can trust that your presentation will be unique and memorable. So why wait Grab Integrating AI To Enhance Dashboard For Tracking Impact Of Supply Chain Automation Themes PDF today and make your presentation stand out from the rest.
Automating Supply Chain Dashboard For Tracking Impact Of Transport Automation Themes PDF
This slide covers the dashboard for tracking vehicle efficiency after transport automation. It include KPIs such as truck turnaround time, average revenue per hour, truckload capacity, transit time, on-time pickup, and average revenue per mile. Deliver an awe inspiring pitch with this creative Automating Supply Chain Dashboard For Tracking Impact Of Transport Automation Themes PDF bundle. Topics like Average Revenue, Per Mile, Truck Turnaround can be discussed with this completely editable template. It is available for immediate download depending on the needs and requirements of the user.
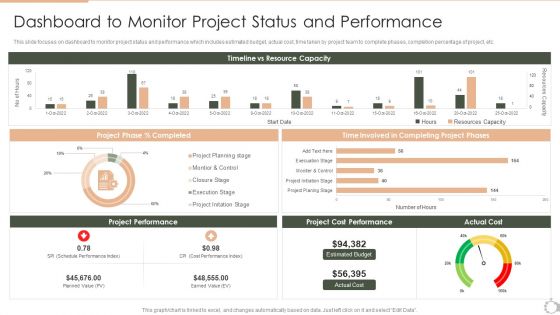
Techniques For Timely Project Dashboard To Monitor Project Status And Performance Microsoft PDF
This slide focuses on dashboard to monitor project status and performance which includes estimated budget, actual cost, time taken by project team to complete phases, completion percentage of project, etc. Deliver and pitch your topic in the best possible manner with this Techniques For Timely Project Dashboard To Monitor Project Status And Performance Microsoft PDF. Use them to share invaluable insights on Timeline vs, Resource Capacity, Project Phase, Time Involved and impress your audience. This template can be altered and modified as per your expectations. So, grab it now.
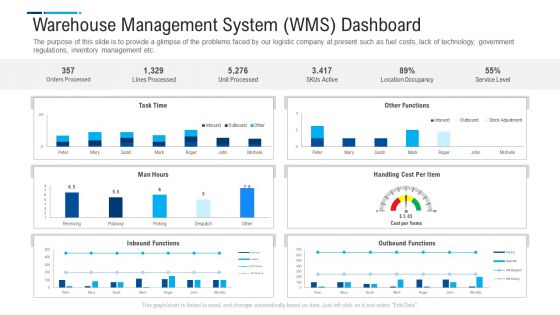
Internal And External Logistics Management Procedure Warehouse Management System WMS Dashboard Grid Slides PDF
The purpose of this slide is to provide a glimpse of the problems faced by our logistic company at present such as fuel costs, lack of technology, government regulations, inventory management etc. Deliver an awe inspiring pitch with this creative internal and external logistics management procedure warehouse management system wms dashboard grid slides pdf bundle. Topics like order status graph, warehouse capacity, transactions today can be discussed with this completely editable template. It is available for immediate download depending on the needs and requirements of the user.
Dashboard For Tracking Impact Of Transport Automation Optimizing Automated Supply Chain And Logistics Inspiration PDF
This slide covers the dashboard for tracking vehicle efficiency after transport automation. It include KPIs such as truck turnaround time, average revenue per hour, truckload capacity, transit time, on-time pickup, and average revenue per mile. Whether you have daily or monthly meetings, a brilliant presentation is necessary. Dashboard For Tracking Impact Of Transport Automation Optimizing Automated Supply Chain And Logistics Inspiration PDF can be your best option for delivering a presentation. Represent everything in detail using Dashboard For Tracking Impact Of Transport Automation Optimizing Automated Supply Chain And Logistics Inspiration PDF and make yourself stand out in meetings. The template is versatile and follows a structure that will cater to your requirements. All the templates prepared by Slidegeeks are easy to download and edit. Our research experts have taken care of the corporate themes as well. So, give it a try and see the results.
Integrating AI To Enhance Dashboard For Tracking Impact Of Transport Automation Template PDF
This slide covers the dashboard for tracking vehicle efficiency after transport automation. It include KPIs such as truck turnaround time, average revenue per hour, truckload capacity, transit time, on-time pickup, and average revenue per mile. Whether you have daily or monthly meetings, a brilliant presentation is necessary. Integrating AI To Enhance Dashboard For Tracking Impact Of Transport Automation Template PDF can be your best option for delivering a presentation. Represent everything in detail using Integrating AI To Enhance Dashboard For Tracking Impact Of Transport Automation Template PDF and make yourself stand out in meetings. The template is versatile and follows a structure that will cater to your requirements. All the templates prepared by Slidegeeks are easy to download and edit. Our research experts have taken care of the corporate themes as well. So, give it a try and see the results.
Streamlining Operations With Supply Chain Automation Dashboard For Tracking Impact Of Transport Automation Demonstration PDF
This slide covers the dashboard for tracking vehicle efficiency after transport automation. It include KPIs such as truck turnaround time, average revenue per hour, truckload capacity, transit time, on-time pickup, and average revenue per mile. Do you have to make sure that everyone on your team knows about any specific topic I yes, then you should give Streamlining Operations With Supply Chain Automation Dashboard For Tracking Impact Of Transport Automation Demonstration PDF a try. Our experts have put a lot of knowledge and effort into creating this impeccable Streamlining Operations With Supply Chain Automation Dashboard For Tracking Impact Of Transport Automation Demonstration PDF. You can use this template for your upcoming presentations, as the slides are perfect to represent even the tiniest detail. You can download these templates from the Slidegeeks website and these are easy to edit. So grab these today.
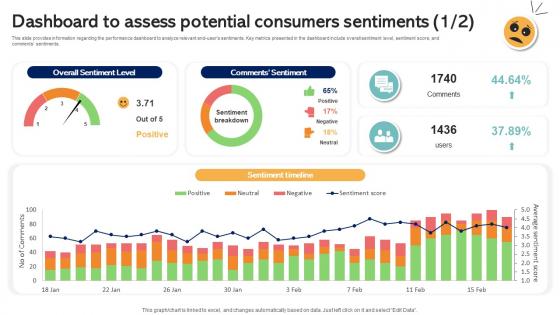
Dashboard To Assess Potential Consumers Sentiments Emotionally Intelligent Insights Leveraging AI SS V
This slide provides information regarding the performance dashboard to analyze relevant end-users sentiments. Key metrics presented in the dashboard include overall sentiment level, sentiment score, and comments sentiments. Do you have an important presentation coming up Are you looking for something that will make your presentation stand out from the rest Look no further than Dashboard To Assess Potential Consumers Sentiments Emotionally Intelligent Insights Leveraging AI SS V. With our professional designs, you can trust that your presentation will pop and make delivering it a smooth process. And with Slidegeeks, you can trust that your presentation will be unique and memorable. So why wait Grab Dashboard To Assess Potential Consumers Sentiments Emotionally Intelligent Insights Leveraging AI SS V today and make your presentation stand out from the rest
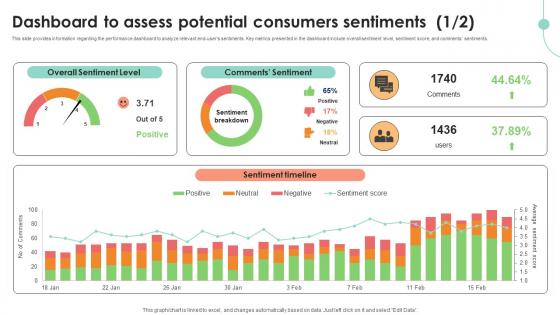
Dashboard To Assess Potential Consumers Decoding User Emotions In Depth Exploration AI SS V
This slide provides information regarding the performance dashboard to analyze relevant end-users sentiments. Key metrics presented in the dashboard include overall sentiment level, sentiment score, and comments sentiments. Do you have an important presentation coming up Are you looking for something that will make your presentation stand out from the rest Look no further than Dashboard To Assess Potential Consumers Decoding User Emotions In Depth Exploration AI SS V. With our professional designs, you can trust that your presentation will pop and make delivering it a smooth process. And with Slidegeeks, you can trust that your presentation will be unique and memorable. So why wait Grab Dashboard To Assess Potential Consumers Decoding User Emotions In Depth Exploration AI SS V today and make your presentation stand out from the rest
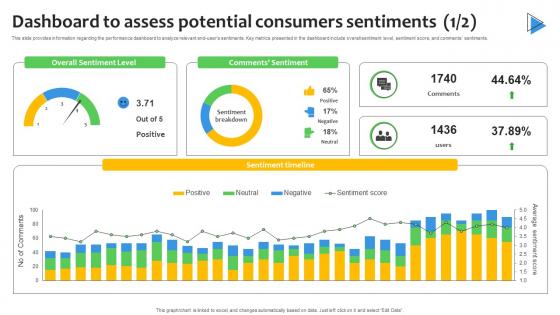
Dashboard To Assess Potential Consumers Sentiment Analysis Demystified Understanding AI SS V
This slide provides information regarding the performance dashboard to analyze relevant end-users sentiments. Key metrics presented in the dashboard include overall sentiment level, sentiment score, and comments sentiments. Do you have an important presentation coming up Are you looking for something that will make your presentation stand out from the rest Look no further than Dashboard To Assess Potential Consumers Sentiment Analysis Demystified Understanding AI SS V. With our professional designs, you can trust that your presentation will pop and make delivering it a smooth process. And with Slidegeeks, you can trust that your presentation will be unique and memorable. So why wait Grab Dashboard To Assess Potential Consumers Sentiment Analysis Demystified Understanding AI SS V today and make your presentation stand out from the rest
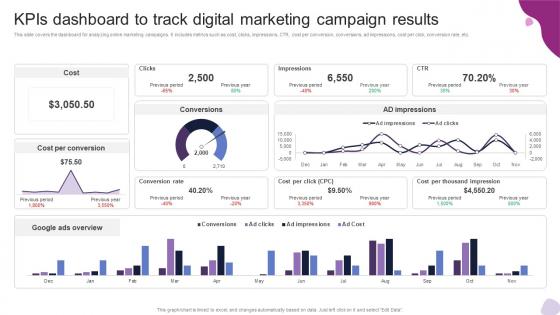
Kpis Dashboard To Track Digital Marketing Campaign Powerful Marketing Techniques Strategy SS V
This slide covers the dashboard for analyzing online marketing campaigns. It includes metrics such as cost, clicks, impressions, CTR, cost per conversion, conversions, ad impressions, cost per click, conversion rate, etc. Take your projects to the next level with our ultimate collection of Kpis Dashboard To Track Digital Marketing Campaign Powerful Marketing Techniques Strategy SS V. Slidegeeks has designed a range of layouts that are perfect for representing task or activity duration, keeping track of all your deadlines at a glance. Tailor these designs to your exact needs and give them a truly corporate look with your own brand colors they will make your projects stand out from the rest

Power Management Dashboard With Energy Consumption AIOT Applications For Various Industries IoT SS V
The purpose of this slide is to showcase power management dashboard which covers various metrics. The metrics mentioned in slide are average power by device, energy consumption, voltage and frequency by various devices, etc. Do you have to make sure that everyone on your team knows about any specific topic I yes, then you should give Power Management Dashboard With Energy Consumption AIOT Applications For Various Industries IoT SS V a try. Our experts have put a lot of knowledge and effort into creating this impeccable Power Management Dashboard With Energy Consumption AIOT Applications For Various Industries IoT SS V. You can use this template for your upcoming presentations, as the slides are perfect to represent even the tiniest detail. You can download these templates from the Slidegeeks website and these are easy to edit. So grab these today

Integrating AI With IoT Power Management Dashboard With Energy Consumption IoT SS V
The purpose of this slide is to showcase power management dashboard which covers various metrics. The metrics mentioned in slide are average power by device, energy consumption, voltage and frequency by various devices, etc. Want to ace your presentation in front of a live audience Our Integrating AI With IoT Power Management Dashboard With Energy Consumption IoT SS V can help you do that by engaging all the users towards you. Slidegeeks experts have put their efforts and expertise into creating these impeccable powerpoint presentations so that you can communicate your ideas clearly. Moreover, all the templates are customizable, and easy-to-edit and downloadable. Use these for both personal and commercial use.
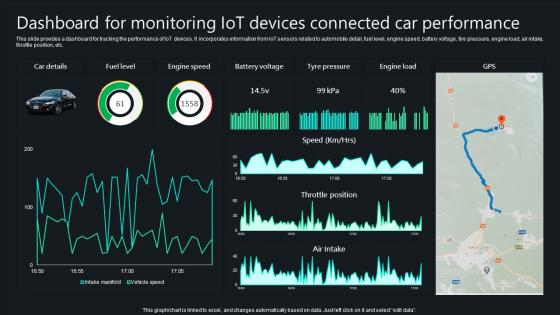
Unlocking Potential IoTs Application Dashboard For Monitoring IoT Devices Connected Car IoT SS V
This slide provides a dashboard for tracking the performance of IoT devices. It incorporates information from IoT sensors related to automobile detail, fuel level, engine speed, battery voltage, tire pressure, engine load, air intake, throttle position, etc. Crafting an eye-catching presentation has never been more straightforward. Let your presentation shine with this tasteful yet straightforward Unlocking Potential IoTs Application Dashboard For Monitoring IoT Devices Connected Car IoT SS V template. It offers a minimalistic and classy look that is great for making a statement. The colors have been employed intelligently to add a bit of playfulness while still remaining professional. Construct the ideal Unlocking Potential IoTs Application Dashboard For Monitoring IoT Devices Connected Car IoT SS V that effortlessly grabs the attention of your audience Begin now and be certain to wow your customers

KPI Dashboard To Assess Supplier Executing Effective Quality Enhancement Structure Pdf
This slide covers KPI dashboard to analyze supplier quality. It involves details such as suppliers with most and least complaints, defects and late deliveries trend analysis. Create an editable KPI Dashboard To Assess Supplier Executing Effective Quality Enhancement Structure Pdf that communicates your idea and engages your audience. Whether you are presenting a business or an educational presentation, pre designed presentation templates help save time. KPI Dashboard To Assess Supplier Executing Effective Quality Enhancement Structure Pdf is highly customizable and very easy to edit, covering many different styles from creative to business presentations. Slidegeeks has creative team members who have crafted amazing templates. So, go and get them without any delay.
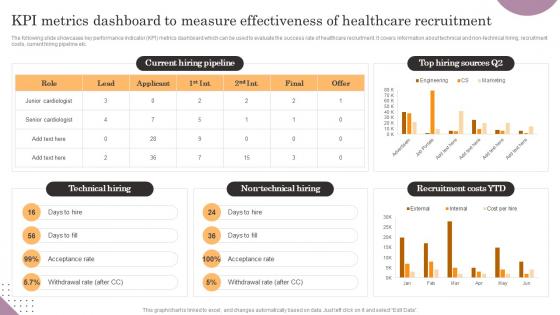
KPI Metrics Dashboard To Measure Effectiveness Of General Management Information Pdf
The following slide showcases key performance indicator KPI metrics dashboard which can be used to evaluate the success rate of healthcare recruitment. It covers information about technical and non-technical hiring, recruitment costs, current hiring pipeline etc. Presenting this PowerPoint presentation, titled KPI Metrics Dashboard To Measure Effectiveness Of General Management Information Pdf, with topics curated by our researchers after extensive research. This editable presentation is available for immediate download and provides attractive features when used. Download now and captivate your audience. Presenting this KPI Metrics Dashboard To Measure Effectiveness Of General Management Information Pdf. Our researchers have carefully researched and created these slides with all aspects taken into consideration. This is a completely customizable KPI Metrics Dashboard To Measure Effectiveness Of General Management Information Pdf that is available for immediate downloading. Download now and make an impact on your audience. Highlight the attractive features available with our PPTs.
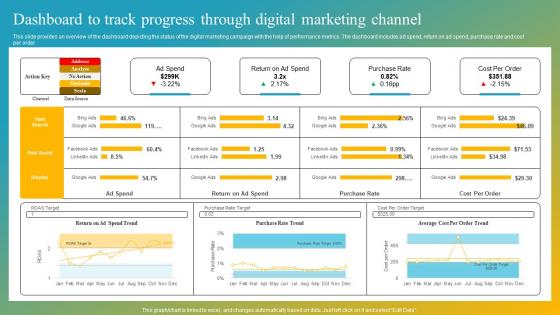
Effective Customer Engagement With Direct Response Dashboard To Track Progress Professional Pdf
This slide provides an overview of the dashboard depicting the status of the digital marketing campaign with the help of performance metrics. The dashboard includes ad spend, return on ad spend, purchase rate and cost per order. Crafting an eye-catching presentation has never been more straightforward. Let your presentation shine with this tasteful yet straightforward Effective Customer Engagement With Direct Response Dashboard To Track Progress Professional Pdf template. It offers a minimalistic and classy look that is great for making a statement. The colors have been employed intelligently to add a bit of playfulness while still remaining professional. Construct the ideal Effective Customer Engagement With Direct Response Dashboard To Track Progress Professional Pdf that effortlessly grabs the attention of your audience. Begin now and be certain to wow your customers.

Blueprint For Effective Real Dashboard To Measure Effectiveness Of Real Estate Strategy SS V
This slide covers dashboard to evaluate effectiveness of real estate business based on SEO performance. The purpose of this template is to provide an overview on elements such keyword ideas, global volume, traffic potential, etc. If you are looking for a format to display your unique thoughts, then the professionally designed Blueprint For Effective Real Dashboard To Measure Effectiveness Of Real Estate Strategy SS V is the one for you. You can use it as a Google Slides template or a PowerPoint template. Incorporate impressive visuals, symbols, images, and other charts. Modify or reorganize the text boxes as you desire. Experiment with shade schemes and font pairings. Alter, share or cooperate with other people on your work. Download Blueprint For Effective Real Dashboard To Measure Effectiveness Of Real Estate Strategy SS V and find out how to give a successful presentation. Present a perfect display to your team and make your presentation unforgettable.
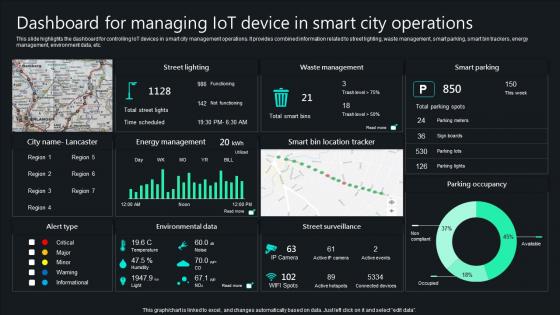
Unlocking Potential IoTs Application Dashboard For Managing IoT Device In Smart City Operations IoT SS V
This slide highlights the dashboard for controlling IoT devices in smart city management operations. It provides combined information related to street lighting, waste management, smart parking, smart bin trackers, energy management, environment data, etc. Are you in need of a template that can accommodate all of your creative concepts This one is crafted professionally and can be altered to fit any style. Use it with Google Slides or PowerPoint. Include striking photographs, symbols, depictions, and other visuals. Fill, move around, or remove text boxes as desired. Test out color palettes and font mixtures. Edit and save your work, or work with colleagues. Download Unlocking Potential IoTs Application Dashboard For Managing IoT Device In Smart City Operations IoT SS V and observe how to make your presentation outstanding. Give an impeccable presentation to your group and make your presentation unforgettable.
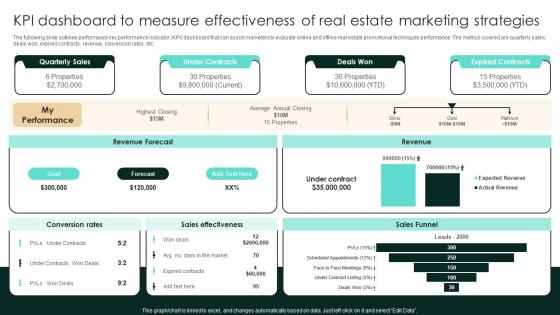
KPI Dashboard To Measure Effectiveness Of Real Estate Marketing Strategic Real Estate Structure Pdf
The following slide outlines performance key performance indicator KPI dashboard that can assist marketers to evaluate online and offline real estate promotional techniques performance. The metrics covered are quarterly sales, deals won, expired contracts, revenue, conversion rates, etc. Here you can discover an assortment of the finest PowerPoint and Google Slides templates. With these templates, you can create presentations for a variety of purposes while simultaneously providing your audience with an eye-catching visual experience. Download KPI Dashboard To Measure Effectiveness Of Real Estate Marketing Strategic Real Estate Structure Pdf to deliver an impeccable presentation. These templates will make your job of preparing presentations much quicker, yet still, maintain a high level of quality. Slidegeeks has experienced researchers who prepare these templates and write high-quality content for you. Later on, you can personalize the content by editing the KPI Dashboard To Measure Effectiveness Of Real Estate Marketing Strategic Real Estate Structure Pdf
Analytics Dashboard Tracking Effective Digital Transformation Journey PPT Presentation DT SS V
This slide represents an analytics dashboard for effective energy monitoring and management. It tracks KPIs such as energy production, solar energy production, savings, energy produced, carbon savings, and financial savings. Get a simple yet stunning designed Analytics Dashboard Tracking Effective Digital Transformation Journey PPT Presentation DT SS V. It is the best one to establish the tone in your meetings. It is an excellent way to make your presentations highly effective. So, download this PPT today from Slidegeeks and see the positive impacts. Our easy-to-edit Analytics Dashboard Tracking Effective Digital Transformation Journey PPT Presentation DT SS V can be your go-to option for all upcoming conferences and meetings. So, what are you waiting for Grab this template today.

Dashboard To Track Binary Multi Level Effective Network Marketing Promotion Tactics Infographics Pdf
This slide represents metric dashboard that helps marketers in tracking and managing binary network marketing. It covers KPIs such as network bonus, expenditure, profit etc. Here you can discover an assortment of the finest PowerPoint and Google Slides templates. With these templates, you can create presentations for a variety of purposes while simultaneously providing your audience with an eye catching visual experience. Download Dashboard To Track Binary Multi Level Effective Network Marketing Promotion Tactics Infographics Pdf to deliver an impeccable presentation. These templates will make your job of preparing presentations much quicker, yet still, maintain a high level of quality. Slidegeeks has experienced researchers who prepare these templates and write high quality content for you. Later on, you can personalize the content by editing the Dashboard To Track Binary Multi Level Effective Network Marketing Promotion Tactics Infographics Pdf.

Dashboard To Evaluate Actual Vs Budgeted Results Effective And Efficient Tools To Develop Fin SS V
This slide shows dashboard which can be used by business organizations or budgeting managers to compare and highlight actual and budgeted performance. It includes KPIs such as revenue, gross margin, EBITDA, etc. Find highly impressive Dashboard To Evaluate Actual Vs Budgeted Results Effective And Efficient Tools To Develop Fin SS V on Slidegeeks to deliver a meaningful presentation. You can save an ample amount of time using these presentation templates. No need to worry to prepare everything from scratch because Slidegeeks experts have already done a huge research and work for you. You need to download Dashboard To Evaluate Actual Vs Budgeted Results Effective And Efficient Tools To Develop Fin SS V for your upcoming presentation. All the presentation templates are 100 percent editable and you can change the color and personalize the content accordingly. Download now

Dashboard To Evaluate Actual Strategies To Develop Effective Ppt PowerPoint Fin SS V
This slide shows dashboard which can be used by business organizations or budgeting managers to compare and highlight actual and budgeted performance. It includes KPIs such as revenue, gross margin, EBITDA, etc. Find highly impressive Dashboard To Evaluate Actual Strategies To Develop Effective Ppt PowerPoint Fin SS V on Slidegeeks to deliver a meaningful presentation. You can save an ample amount of time using these presentation templates. No need to worry to prepare everything from scratch because Slidegeeks experts have already done a huge research and work for you. You need to download Dashboard To Evaluate Actual Strategies To Develop Effective Ppt PowerPoint Fin SS V for your upcoming presentation. All the presentation templates are 100 percent editable and you can change the color and personalize the content accordingly. Download now

KPI Dashboard To Assess Training Program Effectiveness Proven Techniques For Enhancing Summary Pdf
This slide covers KPI dashboard to assess training program effectiveness. It involves details such as overall responses on monthly basis, employee satisfaction rate, net promoter score and major training courses. Do you have an important presentation coming up Are you looking for something that will make your presentation stand out from the rest Look no further than KPI Dashboard To Assess Training Program Effectiveness Proven Techniques For Enhancing Summary Pdf. With our professional designs, you can trust that your presentation will pop and make delivering it a smooth process. And with Slidegeeks, you can trust that your presentation will be unique and memorable. So why wait Grab KPI Dashboard To Assess Training Program Effectiveness Proven Techniques For Enhancing Summary Pdf today and make your presentation stand out from the rest.

Network Marketing Software Dashboard Effective Network Marketing Promotion Tactics Themes Pdf
This slide represents metric dashboard for multi level marketing software that helps marketers to track and monitor network participants progress. It covers details regarding training, sales etc. If you are looking for a format to display your unique thoughts, then the professionally designed Network Marketing Software Dashboard Effective Network Marketing Promotion Tactics Themes Pdf is the one for you. You can use it as a Google Slides template or a PowerPoint template. Incorporate impressive visuals, symbols, images, and other charts. Modify or reorganize the text boxes as you desire. Experiment with shade schemes and font pairings. Alter, share or cooperate with other people on your work. Download Network Marketing Software Dashboard Effective Network Marketing Promotion Tactics Themes Pdf and find out how to give a successful presentation. Present a perfect display to your team and make your presentation unforgettable.
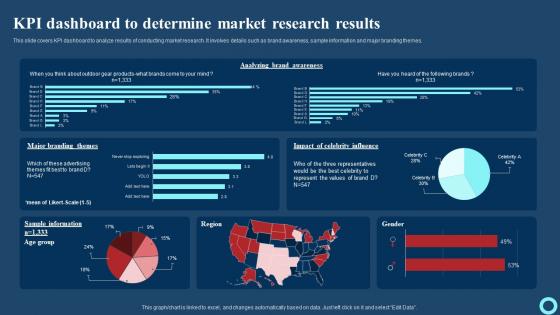
KPI Dashboard To Determine Market Research Results Effective Strategies To Enhance Structure Pdf
This slide covers KPI dashboard to analyze results of conducting market research. It involves details such as brand awareness, sample information and major branding themes. Do you have an important presentation coming up Are you looking for something that will make your presentation stand out from the rest Look no further than KPI Dashboard To Determine Market Research Results Effective Strategies To Enhance Structure Pdf With our professional designs, you can trust that your presentation will pop and make delivering it a smooth process. And with Slidegeeks, you can trust that your presentation will be unique and memorable. So why wait Grab KPI Dashboard To Determine Market Research Results Effective Strategies To Enhance Structure Pdf today and make your presentation stand out from the rest.
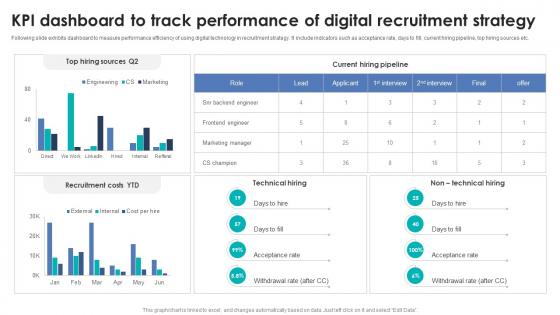
Integrating Automation For Effective Business Kpi Dashboard To Track Performance Of Digital
Following slide exhibits dashboard to measure performance efficiency of using digital technology in recruitment strategy. It include indicators such as acceptance rate, days to fill, current hiring pipeline, top hiring sources etc. Crafting an eye-catching presentation has never been more straightforward. Let your presentation shine with this tasteful yet straightforward Integrating Automation For Effective Business Kpi Dashboard To Track Performance Of Digital template. It offers a minimalistic and classy look that is great for making a statement. The colors have been employed intelligently to add a bit of playfulness while still remaining professional. Construct the ideal Integrating Automation For Effective Business Kpi Dashboard To Track Performance Of Digital that effortlessly grabs the attention of your audience Begin now and be certain to wow your customers
How To Create Cost Effective Dashboard For Tracking Facebook Post Strategy SS V
The following slide outlines dashboard through which advertisers can manage Facebook post performance and optimize their marketing strategy. Information covered in this slide is related to key metrics such as impressions per post, engagement rate, click-through rate CTR, likes, etc. Do you have an important presentation coming up Are you looking for something that will make your presentation stand out from the rest Look no further than How To Create Cost Effective Dashboard For Tracking Facebook Post Strategy SS V. With our professional designs, you can trust that your presentation will pop and make delivering it a smooth process. And with Slidegeeks, you can trust that your presentation will be unique and memorable. So why wait Grab How To Create Cost Effective Dashboard For Tracking Facebook Post Strategy SS V today and make your presentation stand out from the rest

Marketing Strategies For Effective KPI Dashboard To Assess Retail Sales Performance
This slide covers KPI dashboard to analyze sales performance of retail store. It involves details such as total sales revenue, number of customers, average transaction price and average unit per customer. This Marketing Strategies For Effective KPI Dashboard To Assess Retail Sales Performance is perfect for any presentation, be it in front of clients or colleagues. It is a versatile and stylish solution for organizing your meetings. The Marketing Strategies For Effective KPI Dashboard To Assess Retail Sales Performance features a modern design for your presentation meetings. The adjustable and customizable slides provide unlimited possibilities for acing up your presentation. Slidegeeks has done all the homework before launching the product for you. So, do not wait, grab the presentation templates today

Marketing Analytics Dashboard To Evaluate Social Effective GTM Techniques Structure PDF
The following slide showcases performance key performance indicator KPI dashboard through which marketing team can measure social media campaign performance. The KPIs highlighted are YouTube channel views, Facebook daily reach, LinkedIn clicks and likes, etc. The best PPT templates are a great way to save time, energy, and resources. Slidegeeks have 100 percent editable powerpoint slides making them incredibly versatile. With these quality presentation templates, you can create a captivating and memorable presentation by combining visually appealing slides and effectively communicating your message. Download Marketing Analytics Dashboard To Evaluate Social Effective GTM Techniques For Startup Business Elements PDF from Slidegeeks and deliver a wonderful presentation.

Marketing Analytics Dashboard To Evaluate Social Effective Startup Promotion Structure Rules Pdf
The following slide showcases performance key performance indicator KPI dashboard through which marketing team can measure social media campaign performance. The KPIs highlighted are YouTube channel views, Facebook daily reach, LinkedIn clicks and likes, etc. The best PPT templates are a great way to save time, energy, and resources. Slidegeeks have 100 percent editable powerpoint slides making them incredibly versatile. With these quality presentation templates, you can create a captivating and memorable presentation by combining visually appealing slides and effectively communicating your message. Download Marketing Analytics Dashboard To Evaluate Social Effective Startup Promotion Structure Rules Pdf from Slidegeeks and deliver a wonderful presentation.
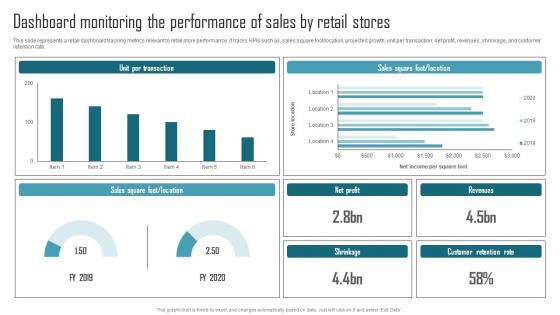
Effective Product Adaptation Dashboard Monitoring The Performance Of Sales By Retail Stores Designs PDF
This slide represents a retail dashboard tracking metrics relevant to retail store performance. It tracks KPIs such as, sales square footlocation, projected growth, unit per transaction, net profit, revenues, shrinkage, and customer retention rate. If your project calls for a presentation, then Slidegeeks is your go-to partner because we have professionally designed, easy-to-edit templates that are perfect for any presentation. After downloading, you can easily edit Effective Product Adaptation Dashboard Monitoring The Performance Of Sales By Retail Stores Designs PDF and make the changes accordingly. You can rearrange slides or fill them with different images. Check out all the handy templates

How To Create Cost Effective Facebook Ads Dashboard With Campaign Strategy SS V
The following slide outlines comprehensive dashboard through which advertisers can monitor Facebook ads performance. The KPIs outlined in slide are ad spend, conversions, cost per conversion, cost per action, brand impressions, clicks, etc. If your project calls for a presentation, then Slidegeeks is your go-to partner because we have professionally designed, easy-to-edit templates that are perfect for any presentation. After downloading, you can easily edit How To Create Cost Effective Facebook Ads Dashboard With Campaign Strategy SS V and make the changes accordingly. You can rearrange slides or fill them with different images. Check out all the handy templates
Effective Product Adaptation Dashboard Tracking Influencer Marketing Campaign Performance Diagrams PDF
If you are looking for a format to display your unique thoughts, then the professionally designed Effective Product Adaptation Dashboard Tracking Influencer Marketing Campaign Performance Diagrams PDF is the one for you. You can use it as a Google Slides template or a PowerPoint template. Incorporate impressive visuals, symbols, images, and other charts. Modify or reorganize the text boxes as you desire. Experiment with shade schemes and font pairings. Alter, share or cooperate with other people on your work. Download Effective Product Adaptation Dashboard Tracking Influencer Marketing Campaign Performance Diagrams PDF and find out how to give a successful presentation. Present a perfect display to your team and make your presentation unforgettable.
Activity Tracking Dashboard For Umbrella Brand Effective Brand Maintenance Slides Pdf
This slide provides information regarding activities tracking dashboard for umbrella brand in terms of customer retention, market share, etc. Boost your pitch with our creative Activity Tracking Dashboard For Umbrella Brand Effective Brand Maintenance Slides Pdf Deliver an awe-inspiring pitch that will mesmerize everyone. Using these presentation templates you will surely catch everyones attention. You can browse the ppts collection on our website. We have researchers who are experts at creating the right content for the templates. So you do not have to invest time in any additional work. Just grab the template now and use them.
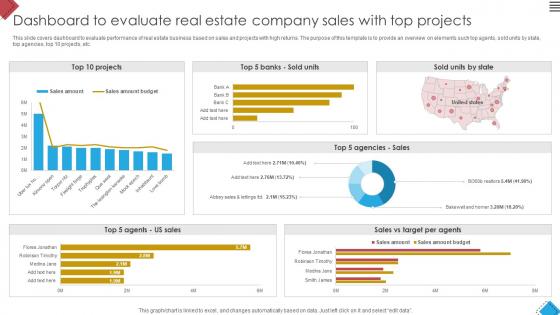
Blueprint For Effective Real Dashboard To Evaluate Real Estate Company Sales Strategy SS V
This slide covers dashboard to evaluate performance of real estate business based on sales and projects with high returns. The purpose of this template is to provide an overview on elements such top agents, sold units by state, top agencies, top 10 projects, etc. If your project calls for a presentation, then Slidegeeks is your go-to partner because we have professionally designed, easy-to-edit templates that are perfect for any presentation. After downloading, you can easily edit Blueprint For Effective Real Dashboard To Evaluate Real Estate Company Sales Strategy SS V and make the changes accordingly. You can rearrange slides or fill them with different images. Check out all the handy templates

Marketing Strategies For Effective Retail KPI Dashboard To Track Visitors Count
This slide covers retail dashboard to track number of visitors to assess retail store performance. It involves details such as total revenue generated by different stores, sales and gross profit by product category and average basket value. Want to ace your presentation in front of a live audience Our Marketing Strategies For Effective Retail KPI Dashboard To Track Visitors Count can help you do that by engaging all the users towards you. Slidegeeks experts have put their efforts and expertise into creating these impeccable powerpoint presentations so that you can communicate your ideas clearly. Moreover, all the templates are customizable, and easy-to-edit and downloadable. Use these for both personal and commercial use.
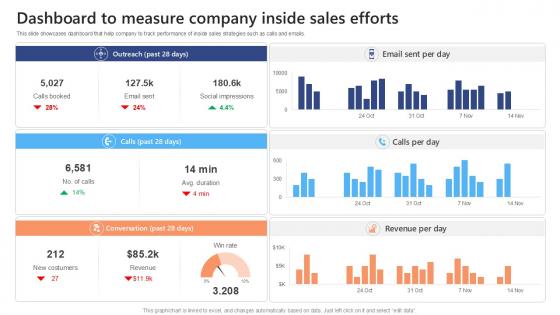
Dashboard To Measure Company Effective Strategies To Succeed At Virtual Ppt Template SA SS V
This slide showcases dashboard that help company to track performance of inside sales strategies such as calls and emails. If your project calls for a presentation, then Slidegeeks is your go-to partner because we have professionally designed, easy-to-edit templates that are perfect for any presentation. After downloading, you can easily edit Dashboard To Measure Company Effective Strategies To Succeed At Virtual Ppt Template SA SS V and make the changes accordingly. You can rearrange slides or fill them with different images. Check out all the handy templates
Capability Icon With Employees And Performance Dashboard Ppt PowerPoint Presentation Icon Model PDF
Presenting capability icon with employees and performance dashboard ppt powerpoint presentation icon model pdf to dispense important information. This template comprises two stages. It also presents valuable insights into the topics including capability icon with employees and performance dashboard. This is a completely customizable PowerPoint theme that can be put to use immediately. So, download it and address the topic impactfully.
Dashboard For Tracking Impact Of Warehouse Leveraging Logistics Automation Information Pdf
This slide covers the dashboard with after automation warehouse overview. It include KPIs such as autonomous robots status, robotic arms status, battery level, performance, time to return, etc.Get a simple yet stunning designed Dashboard For Tracking Impact Of Warehouse Leveraging Logistics Automation Information Pdf. It is the best one to establish the tone in your meetings. It is an excellent way to make your presentations highly effective. So, download this PPT today from Slidegeeks and see the positive impacts. Our easy-to-edit Dashboard For Tracking Impact Of Warehouse Leveraging Logistics Automation Information Pdf can be your go-to option for all upcoming conferences and meetings. So, what are you waiting for Grab this template today.

Building Innovation Capabilities And USP Detection Sales Dashboard Ppt Diagram Templates PDF
Show your highlights of sale through our dashboard. Deliver an awe-inspiring pitch with this creative building innovation capabilities and usp detection sales dashboard ppt diagram templates pdf bundle. Topics like top products revenue, product sale comparison, incremental sales campaign can be discussed with this completely editable template. It is available for immediate download depending on the needs and requirements of the user.

Dashboard For Monthly Earnings And Loss Summary With Net Revenue Background Pdf
This slide displays a dashboard to effectively visualize major profitability indicators and communicate crucial information to upper management of the company. It includes details such as cost of goods sold, earnings before interest and taxes, interest expense, etc. Pitch your topic with ease and precision using this Dashboard For Monthly Earnings And Loss Summary With Net Revenue Background Pdf. This layout presents information on Dashboard For Monthly Earnings, Loss Summary, Net Revenue. It is also available for immediate download and adjustment. So, changes can be made in the color, design, graphics or any other component to create a unique layout.
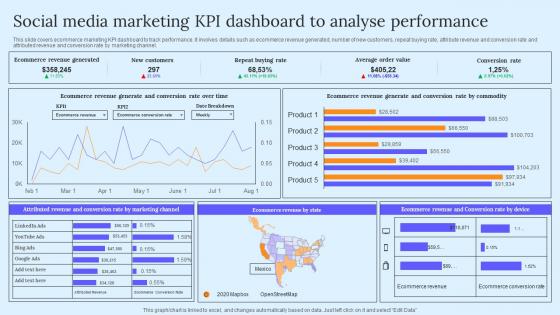
Social Media Marketing KPI Dashboard B2B Marketing Techniques To Attract Potential Pictures Pdf
This slide covers ecommerce marketing KPI dashboard to track performance. It involves details such as ecommerce revenue generated, number of new customers, repeat buying rate, attribute revenue and conversion rate and attributed revenue and conversion rate by marketing channel. Do you have an important presentation coming up Are you looking for something that will make your presentation stand out from the rest Look no further than Social Media Marketing KPI Dashboard B2B Marketing Techniques To Attract Potential Pictures Pdf. With our professional designs, you can trust that your presentation will pop and make delivering it a smooth process. And with Slidegeeks, you can trust that your presentation will be unique and memorable. So why wait Grab Social Media Marketing KPI Dashboard B2B Marketing Techniques To Attract Potential Pictures Pdf today and make your presentation stand out from the rest

 Home
Home