Call Center Kpi

IT Consolidation Post Mergers And Acquisition Customer Service KPI Dashboard Brochure PDF
This slide illustrates customer service dashboard covering informational stats about NPS score, growth rate, customer distribution, top customer locations, inbound leads and revenue by type. Deliver an awe inspiring pitch with this creative IT Consolidation Post Mergers And Acquisition Customer Service KPI Dashboard Brochure PDF bundle. Topics like Customer Locations, Growth Rate, Standard Customers, Net Income, Projection can be discussed with this completely editable template. It is available for immediate download depending on the needs and requirements of the user.
Providing Efficient Client Services Kpi Dashboard For Tracking Customer Retention Diagrams PDF
This slide covers the dashboard for analyzing customer loyalty with metrics such as NPS, loyal customer rate, premium users, CLV, customer churn, revenue churn, net retention, MRR growth, etc. Take your projects to the next level with our ultimate collection of Providing Efficient Client Services Kpi Dashboard For Tracking Customer Retention Diagrams PDF. Slidegeeks has designed a range of layouts that are perfect for representing task or activity duration, keeping track of all your deadlines at a glance. Tailor these designs to your exact needs and give them a truly corporate look with your own brand colors they will make your projects stand out from the rest.
KPI Dashboards Per Industry Market Research Customer Satisfaction Dashboard Ppt PowerPoint Presentation Icon Outfit PDF
Deliver and pitch your topic in the best possible manner with this kpi dashboards per industry market research customer satisfaction dashboard ppt powerpoint presentation icon outfit pdf. Use them to share invaluable insights on quality, pricing, design, service, net promoter score, customer effort score, nps and ces development month and impress your audience. This template can be altered and modified as per your expectations. So, grab it now.
Online Customer Interaction KPI Dashboard For Tracking Consumer Journey Touchpoints Information PDF
This slide covers a touchpoint dashboard with different customer journey stages. It also includes a detailed evaluation of each stage on the basis of experience, importance, etc. Deliver and pitch your topic in the best possible manner with this Online Customer Interaction KPI Dashboard For Tracking Consumer Journey Touchpoints Information PDF. Use them to share invaluable insights on Consumer Journey, Purchasing, Consumer Service and impress your audience. This template can be altered and modified as per your expectations. So, grab it now.

KPI Dashboard To Measure Effective Information Technology Service Excellence Information PDF
This slide signifies the key performance indicator dashboard on using effective information technology services to increase business growth. It includes tickets by status, satisfaction rate, customer and category with SLA violation. Showcasing this set of slides titled KPI Dashboard To Measure Effective Information Technology Service Excellence Information PDF. The topics addressed in these templates are Satisfication Rate, Tickets Status, Service Desk. All the content presented in this PPT design is completely editable. Download it and make adjustments in color, background, font etc. as per your unique business setting.
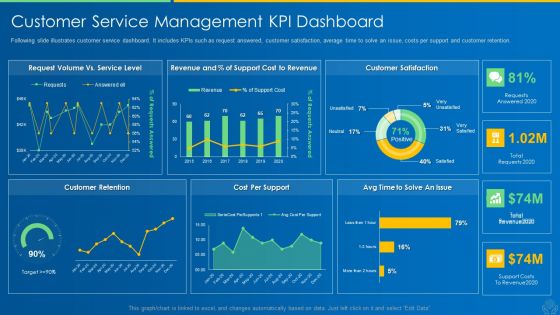
AI And ML Driving Monetary Value For Organization Customer Service Management Kpi Dashboard Formats PDF
Following slide illustrates customer service dashboard. It includes KPIs such as request answered, customer satisfaction, average time to solve an issue, costs per support and customer retention. Deliver and pitch your topic in the best possible manner with this ai and ml driving monetary value for organization customer service management kpi dashboard formats pdf. Use them to share invaluable insights on customer retention, cost per support, customer satisfaction, cost to revenue and impress your audience. This template can be altered and modified as per your expectations. So, grab it now.

AI And ML Driving Monetary Value For Organization KPI Dashboard To Monitor Business Performance Graphics PDF
Following slide shows business performance dashboard. It covers KPIs such as revenue generated, projected revenue, marketing expenses, satisfaction rate and tickets volume by priority. Deliver and pitch your topic in the best possible manner with this ai and ml driving monetary value for organization kpi dashboard to monitor business performance graphics pdf. Use them to share invaluable insights on business offerings, current impact, product innovations, customer service and impress your audience. This template can be altered and modified as per your expectations. So, grab it now.

Sustainability Calculation With KPI Customer Service Dashboard Revenue Ideas PDF Graphics PDF
Following slide illustrates customer service dashboard covering details such as request answered, total requests, total revenue and support cost revenue. It also includes customer satisfaction score, customer retention in a 12 months format. Deliver and pitch your topic in the best possible manner with this sustainability calculation with kpi customer service dashboard microsoft pdf. Use them to share invaluable insights on customer satisfaction, revenue, customer retention and impress your audience. This template can be altered and modified as per your expectations. So, grab it now.

Client Achievements Playbook Customer Success KPI Dashboard To Measure Support Brochure PDF
Mentioned slide showcases customer success dashboard that company is currently using to measure its support team performance. KPIs covered in the dashboard are health score, retention cost, churn rate etc. Deliver an awe inspiring pitch with this creative client achievements playbook customer success kpi dashboard to measure support brochure pdf bundle. Topics like customer retention cost, current health score, customer churn rate, customer accounts, customer health can be discussed with this completely editable template. It is available for immediate download depending on the needs and requirements of the user.

Guide To Client Success Customer Success KPI Dashboard To Measure Support Team Performance Topics PDF
Mentioned slide showcases customer success dashboard that company is currently using to measure its support team performance. Kpis covered in the dashboard are health score, retention cost, churn rate etc. Deliver an awe inspiring pitch with this creative Guide To Client Success Customer Success KPI Dashboard To Measure Support Team Performance Topics PDF bundle. Topics like Customer Churn Rate, Customer Retention Cost, Revenue can be discussed with this completely editable template. It is available for immediate download depending on the needs and requirements of the user.
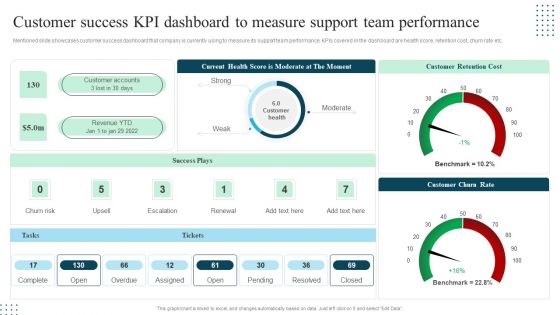
Client Success Playbook Customer Success KPI Dashboard To Measure Support Team Background PDF
Mentioned slide showcases customer success dashboard that company is currently using to measure its support team performance. KPIs covered in the dashboard are health score, retention cost, churn rate etc. Deliver an awe inspiring pitch with this creative Client Success Playbook Customer Success KPI Dashboard To Measure Support Team Background PDF bundle. Topics like Customer Retention Cost, Customer Churn Rate, Success Plays can be discussed with this completely editable template. It is available for immediate download depending on the needs and requirements of the user.
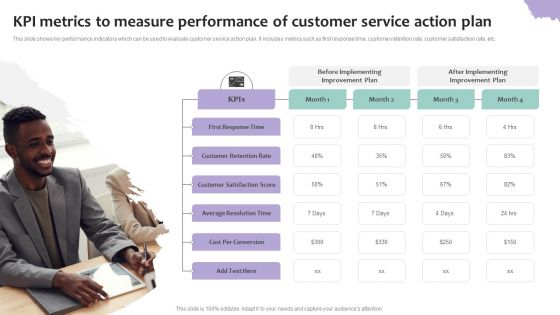
KPI Metrics To Measure Performance Of Customer Service Action Plan Diagrams PDF
This slide shows key performance indicators which can be used to evaluate customer service action plan. It includes metrics such as first response time, customer retention rate, customer satisfaction rate, etc. Persuade your audience using this KPI Metrics To Measure Performance Of Customer Service Action Plan Diagrams PDF. This PPT design covers four stages, thus making it a great tool to use. It also caters to a variety of topics including Before Implementing, Improvement Plan, After Implementing, First Response Time . Download this PPT design now to present a convincing pitch that not only emphasizes the topic but also showcases your presentation skills.
Ultimate Guide To Improve Customer Support And Services Kpi Dashboard For Tracking Customer Retention Guidelines PDF
This slide covers the dashboard for analyzing customer loyalty with metrics such as NPS, loyal customer rate, premium users, CLV, customer churn, revenue churn, net retention, MRR growth, etc. Welcome to our selection of the Ultimate Guide To Improve Customer Support And Services Kpi Dashboard For Tracking Customer Retention Guidelines PDF. These are designed to help you showcase your creativity and bring your sphere to life. Planning and Innovation are essential for any business that is just starting out. This collection contains the designs that you need for your everyday presentations. All of our PowerPoints are 100 percent editable, so you can customize them to suit your needs. This multi purpose template can be used in various situations. Grab these presentation templates today.
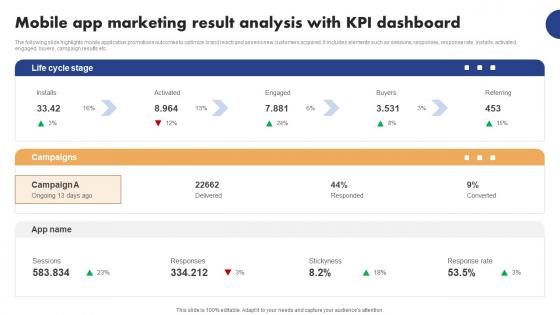
Mobile Ad Campaign Launch Strategy Mobile App Marketing Result Analysis With KPI Slides Pdf
The following slide highlights mobile application promotions outcomes to optimize brand reach and assess new customers acquired. It includes elements such as sessions, responses, response rate, installs, activated, engaged, buyers, campaign results etc. Coming up with a presentation necessitates that the majority of the effort goes into the content and the message you intend to convey. The visuals of a PowerPoint presentation can only be effective if it supplements and supports the story that is being told. Keeping this in mind our experts created Mobile Ad Campaign Launch Strategy Mobile App Marketing Result Analysis With KPI Slides Pdf to reduce the time that goes into designing the presentation. This way, you can concentrate on the message while our designers take care of providing you with the right template for the situation.

Guide To Healthcare Services Administration Performance KPI Dashboard To Analyze Healthcare Marketing Clipart PDF
The following slide showcases a comprehensive dashboard which can be used to evaluate the effectiveness of marketing strategies. The key metrics are total searches, brand mentions, customer value, total spending on advertisement etc. Slidegeeks is one of the best resources for PowerPoint templates. You can download easily and regulate Guide To Healthcare Services Administration Performance KPI Dashboard To Analyze Healthcare Marketing Clipart PDF for your personal presentations from our wonderful collection. A few clicks is all it takes to discover and get the most relevant and appropriate templates. Use our Templates to add a unique zing and appeal to your presentation and meetings. All the slides are easy to edit and you can use them even for advertisement purposes.
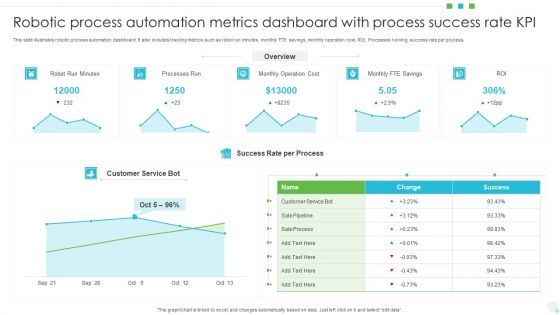
Robotic Process Automation Metrics Dashboard With Process Success Rate KPI Professional PDF
This slide illustrates robotic process automation dashboard. It also includes tracking metrics such as robot run minutes, monthly FTE savings, monthly operation cost, ROI, Processes running, success rate per process. Showcasing this set of slides titled Robotic Process Automation Metrics Dashboard With Process Success Rate KPI Professional PDF The topics addressed in these templates are Processes Run, Monthly Operation Cost, Customer Service Bot. All the content presented in this PPT design is completely editable. Download it and make adjustments in color, background, font etc. as per your unique business setting.
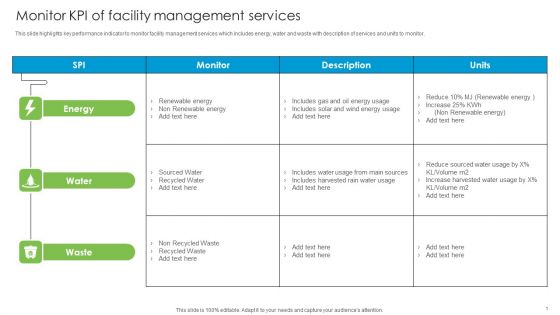
Monitor Kpi Of Facility Management Services Developing Tactical Fm Services Rules PDF
This slide highlights key performance indicator to monitor facility management services which includes energy, water and waste with description of services and units to monitor.This Monitor Kpi Of Facility Management Services Developing Tactical Fm Services Rules PDF from Slidegeeks makes it easy to present information on your topic with precision. It provides customization options, so you can make changes to the colors, design, graphics, or any other component to create a unique layout. It is also available for immediate download, so you can begin using it right away. Slidegeeks has done good research to ensure that you have everything you need to make your presentation stand out. Make a name out there for a brilliant performance.
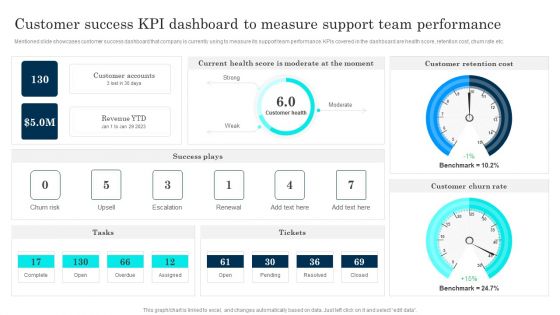
Customer Journey Enhancement Playbook Customer Success KPI Dashboard To Measure Portrait PDF
Mentioned slide showcases customer success dashboard that company is currently using to measure its support team performance. KPIs covered in the dashboard are health score, retention cost, churn rate etc. Slidegeeks is here to make your presentations a breeze with Customer Journey Enhancement Playbook Customer Success KPI Dashboard To Measure Portrait PDF With our easy-to-use and customizable templates, you can focus on delivering your ideas rather than worrying about formatting. With a variety of designs to choose from, youre sure to find one that suits your needs. And with animations and unique photos, illustrations, and fonts, you can make your presentation pop. So whether youre giving a sales pitch or presenting to the board, make sure to check out Slidegeeks first.

Comprehensive Customer Data Platform Guide Optimizing Promotional Initiatives Customer Behaviour Analysis KPI Brochure PDF
The following slide showcases customer behavior assessment to gain competitive advantages and analyze their purchase pattern. It includes elements such as visitors, by device, page views, top pages, domains etc. Coming up with a presentation necessitates that the majority of the effort goes into the content and the message you intend to convey. The visuals of a PowerPoint presentation can only be effective if it supplements and supports the story that is being told. Keeping this in mind our experts created Comprehensive Customer Data Platform Guide Optimizing Promotional Initiatives Customer Behaviour Analysis KPI Brochure PDF to reduce the time that goes into designing the presentation. This way, you can concentrate on the message while our designers take care of providing you with the right template for the situation.
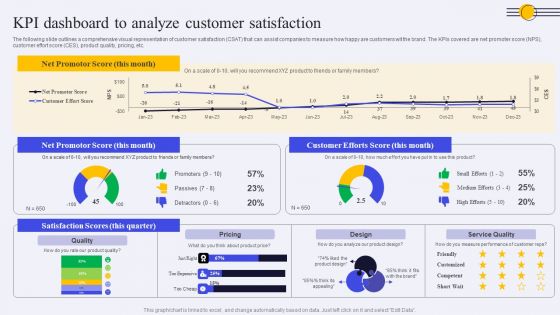
KPI Dashboard To Analyze Customer Satisfaction Ppt PowerPoint Presentation File Infographic Template PDF
The following slide outlines a comprehensive visual representation of customer satisfaction CSAT that can assist companies to measure how happy are customers wit the brand. The KPIs covered are net promoter score NPS, customer effort score CES, product quality, pricing, etc. Coming up with a presentation necessitates that the majority of the effort goes into the content and the message you intend to convey. The visuals of a PowerPoint presentation can only be effective if it supplements and supports the story that is being told. Keeping this in mind our experts created KPI Dashboard To Analyze Customer Satisfaction Ppt PowerPoint Presentation File Infographic Template PDF to reduce the time that goes into designing the presentation. This way, you can concentrate on the message while our designers take care of providing you with the right template for the situation.
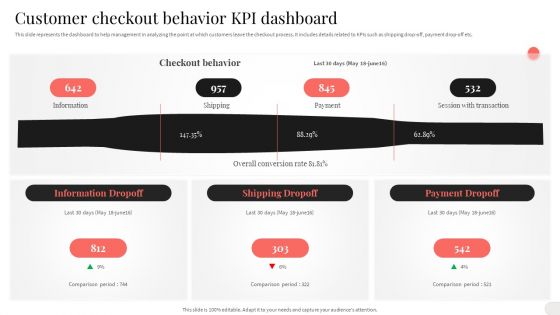
Analyzing And Implementing Effective CMS Customer Checkout Behavior KPI Dashboard Inspiration PDF
This slide represents the dashboard to help management in analyzing the point at which customers leave the checkout process. It includes details related to KPIs such as shipping drop off, payment drop off etc. Coming up with a presentation necessitates that the majority of the effort goes into the content and the message you intend to convey. The visuals of a PowerPoint presentation can only be effective if it supplements and supports the story that is being told. Keeping this in mind our experts created Analyzing And Implementing Effective CMS Customer Checkout Behavior KPI Dashboard Inspiration PDF to reduce the time that goes into designing the presentation. This way, you can concentrate on the message while our designers take care of providing you with the right template for the situation.

Offline Marketing Techniques To Elevate Brand Visibility KPI Dashboard To Track Offline Formats PDF
This slide shows dashboard which can be used by organizations to measure performance of traditional marketing. It includes metrics such as customer conversion rate, new customers, sales, and brand awareness. Coming up with a presentation necessitates that the majority of the effort goes into the content and the message you intend to convey. The visuals of a PowerPoint presentation can only be effective if it supplements and supports the story that is being told. Keeping this in mind our experts created Offline Marketing Techniques To Elevate Brand Visibility KPI Dashboard To Track Offline Formats PDF to reduce the time that goes into designing the presentation. This way, you can concentrate on the message while our designers take care of providing you with the right template for the situation.
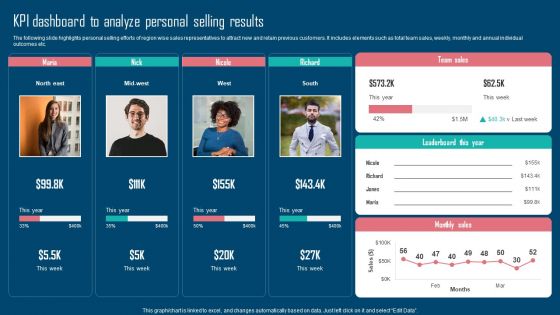
Adopting IMC Technique To Boost Brand Recognition Kpi Dashboard To Analyze Personal Selling Results Formats PDF
The following slide highlights personal selling efforts of region wise sales representatives to attract new and retain previous customers. It includes elements such as total team sales, weekly, monthly and annual individual outcomes etc. Coming up with a presentation necessitates that the majority of the effort goes into the content and the message you intend to convey. The visuals of a PowerPoint presentation can only be effective if it supplements and supports the story that is being told. Keeping this in mind our experts created Adopting IMC Technique To Boost Brand Recognition Kpi Dashboard To Analyze Personal Selling Results Formats PDF to reduce the time that goes into designing the presentation. This way, you can concentrate on the message while our designers take care of providing you with the right template for the situation.

Customer Service Metrics Dashboard With Unresolved Calls Designs PDF
This slide showcases KPI dashboard for customer service that can help to identify the issue unresolved and response time by weekday. Its key elements are final call resolution, unresolved calls, avg response time and best day to call. Showcasing this set of slides titled Customer Service Metrics Dashboard With Unresolved Calls Designs PDF. The topics addressed in these templates are Customer Service, Metrics Dashboard, Unresolved Calls. All the content presented in this PPT design is completely editable. Download it and make adjustments in color, background, font etc. as per your unique business setting.
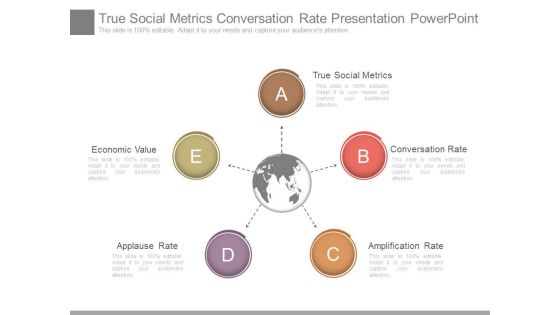
True Social Metrics Conversation Rate Presentation PowerPoint Slides
This is a true social metrics conversation rate presentation powerpoint slide. This is a five stage process. The stages in this process are technology, globe, marketing, business.
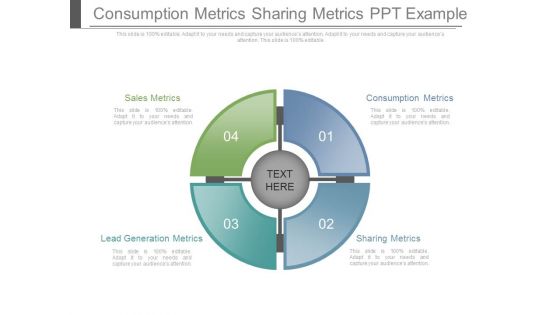
Consumption Metrics Sharing Metrics Ppt Example
This is a consumption metrics sharing metrics ppt example. This is a four stage process. The stages in this process are circle charts, business, marketing.
Business Diagram Metrics For Performance Measurement Presentation Template
This diagram slide has been designed with graphic of matrix. You may use this matrix for performance management. Download this diagram to make interactive presentations.
Circular Performance Measurement Metrics PowerPoint Templates
Communicate with your group through this slide of circles. It will facilitate understanding of your views. This diagram can be used to display performance measurement in business presentations.

Goals And Success Metrics Ppt Slides
This is a goals and success metrics ppt slides. This is a four stage process. The stages in this process are process and flows, success, business.
Key Evaluation Metrics Ppt Slides
This is a key evaluation metrics ppt slides. This is a five stage process. The stages in this process are business, finance, marketing, symbol.

Customer Service Metrics Dashboard With Average Response Time Formats PDF
This slide showcases KPI dashboard for customer service that can help to evaluate the performance of call center agents and identify issues arising from different channels. Its key components are number of issues in last 1 day, average time to closes, first call resolution, daily average response time, average time to close by channel and top performing call agents. Pitch your topic with ease and precision using this Customer Service Metrics Dashboard With Average Response Time Formats PDF. This layout presents information on Customer Service, Metrics Dashboard, Average Response Time. It is also available for immediate download and adjustment. So, changes can be made in the color, design, graphics or any other component to create a unique layout.
Online Customer Interaction Dashboard For Tracking Customer Service Team Performance Infographics PDF
This slide covers the KPI dashboard for analyzing the performance of client support department. It includes metrics such as first call resolution, unresolved calls, average response rate, the best day to call, average time to solve issues, etc. Deliver and pitch your topic in the best possible manner with this Online Customer Interaction Dashboard For Tracking Customer Service Team Performance Infographics PDF. Use them to share invaluable insights on Response Time, Issue Solving, Call Resolution and impress your audience. This template can be altered and modified as per your expectations. So, grab it now.
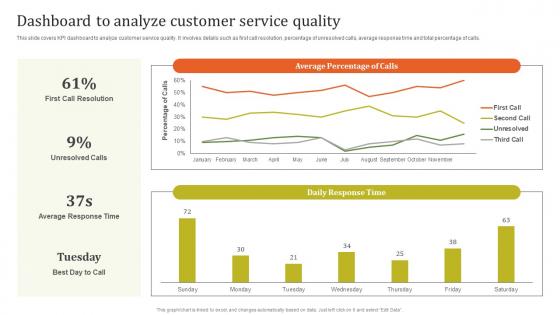
Dashboard To Analyze Customer Executing Effective Quality Enhancement Mockup Pdf
This slide covers KPI dashboard to analyze customer service quality. It involves details such as first call resolution, percentage of unresolved calls, average response time and total percentage of calls. From laying roadmaps to briefing everything in detail, our templates are perfect for you. You can set the stage with your presentation slides. All you have to do is download these easy to edit and customizable templates. Dashboard To Analyze Customer Executing Effective Quality Enhancement Mockup Pdf will help you deliver an outstanding performance that everyone would remember and praise you for. Do download this presentation today.
Dashboard For Tracking Customer Service Team Performance Clipart PDF
This slide covers the KPI dashboard for analyzing the performance of client support department. It includes metrics such as first call resolution, unresolved calls, average response rate, the best day to call, average time to solve issues, etc. Deliver an awe inspiring pitch with this creative Dashboard For Tracking Customer Service Team Performance Clipart PDF bundle. Topics like Dashboard For Tracking Customer, Service Team Performance can be discussed with this completely editable template. It is available for immediate download depending on the needs and requirements of the user.
Dashboard For Tracking Customer Service Team Performance Information PDF
This slide covers the KPI dashboard for analyzing the performance of client support department. It includes metrics such as first call resolution, unresolved calls, average response rate, the best day to call, average time to solve issues, etc. Deliver an awe inspiring pitch with this creative Dashboard For Tracking Customer Service Team Performance Information PDF bundle. Topics like Dashboard For Tracking Customer, Service Team Performance can be discussed with this completely editable template. It is available for immediate download depending on the needs and requirements of the user.
Consumer Journey Mapping Techniques Dashboard For Tracking Customer Service Team Performance Summary PDF
This slide covers the KPI dashboard for analyzing the performance of client support department. It includes metrics such as first call resolution, unresolved calls, average response rate, the best day to call, average time to solve issues, etc. Pitch your topic with ease and precision using this Consumer Journey Mapping Techniques Dashboard For Tracking Customer Service Team Performance Summary PDF. This layout presents information on Dashboard For Tracking Customer, Service Team Performance. It is also available for immediate download and adjustment. So, changes can be made in the color, design, graphics or any other component to create a unique layout.
Dashboard For Tracking Customer Service Team Performance Consumer Contact Point Guide Diagrams PDF
This slide covers the KPI dashboard for analyzing the performance of client support department. It includes metrics such as first call resolution, unresolved calls, average response rate, the best day to call, average time to solve issues, etc. The Dashboard For Tracking Customer Service Team Performance Consumer Contact Point Guide Diagrams PDF is a compilation of the most recent design trends as a series of slides. It is suitable for any subject or industry presentation, containing attractive visuals and photo spots for businesses to clearly express their messages. This template contains a variety of slides for the user to input data, such as structures to contrast two elements, bullet points, and slides for written information. Slidegeeks is prepared to create an impression.
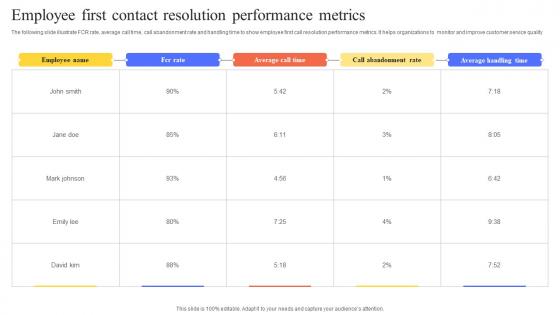
Employee First Contact Resolution Performance Metrics Demonstration Pdf
The following slide illustrate FCR rate, average call time, call abandonment rate and handling time to show employee first call resolution performance metrics. It helps organizations to monitor and improve customer service quality.Showcasing this set of slides titled Employee First Contact Resolution Performance Metrics Demonstration Pdf The topics addressed in these templates are Average Call Time, Abandonment Rate, Average Handling Time All the content presented in this PPT design is completely editable. Download it and make adjustments in color, background, font etc. as per your unique business setting.
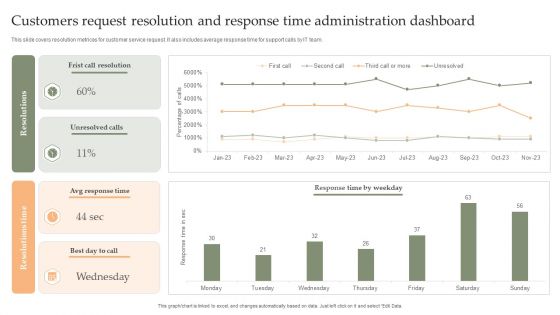
Customers Request Resolution And Response Time Administration Dashboard Mockup PDF
This slide covers resolution metrices for customer service request. It also includes average response time for support calls by IT team. Showcasing this set of slides titled Customers Request Resolution And Response Time Administration Dashboard Mockup PDF. The topics addressed in these templates are Frist Call Resolution, Unresolved Calls, Avg Response Time. All the content presented in this PPT design is completely editable. Download it and make adjustments in color, background, font etc. as per your unique business setting.
Ultimate Guide To Improve Customer Support And Services Dashboard For Tracking Aftersales Customer Sample PDF
This slide covers the KPI dashboard for ticket tracking. It includes metrics such as tickets by month, service level, and details of customer service department agents. If your project calls for a presentation, then Slidegeeks is your go to partner because we have professionally designed, easy to edit templates that are perfect for any presentation. After downloading, you can easily edit Ultimate Guide To Improve Customer Support And Services Dashboard For Tracking Aftersales Customer Sample PDF and make the changes accordingly. You can rearrange slides or fill them with different images. Check out all the handy templates
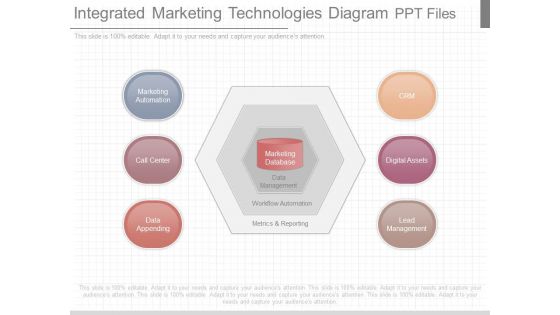
Integrated Marketing Technologies Diagram Ppt Files
This is a integrated marketing technologies diagram ppt files. This is a six stage process. The stages in this process are crm, digital assets, lead management, marketing, automation, call center, data appending, marketing database, data management, workflow automation, metrics and reporting.
Tracking First Response Time Improving Customer Retention PPT Presentation
The following slide depicts key performance indicators to review call resolution time and offer real time support. It also includes elements such as unsolved calls, weekly response time analysis, best day to call etc. Presenting this PowerPoint presentation, titled Tracking First Response Time Improving Customer Retention PPT Presentation, with topics curated by our researchers after extensive research. This editable presentation is available for immediate download and provides attractive features when used. Download now and captivate your audience. Presenting this Tracking First Response Time Improving Customer Retention PPT Presentation. Our researchers have carefully researched and created these slides with all aspects taken into consideration. This is a completely customizable Tracking First Response Time Improving Customer Retention PPT Presentation that is available for immediate downloading. Download now and make an impact on your audience. Highlight the attractive features available with our PPTs.
Tracking First Response Time Enhancing Customer Experience Ppt Presentation
The following slide depicts key performance indicators to review call resolution time and offer real time support. It also includes elements such as unsolved calls, weekly response time analysis, best day to call etc. Presenting this PowerPoint presentation, titled Tracking First Response Time Enhancing Customer Experience Ppt Presentation, with topics curated by our researchers after extensive research. This editable presentation is available for immediate download and provides attractive features when used. Download now and captivate your audience. Presenting this Tracking First Response Time Enhancing Customer Experience Ppt Presentation. Our researchers have carefully researched and created these slides with all aspects taken into consideration. This is a completely customizable Tracking First Response Time Enhancing Customer Experience Ppt Presentation that is available for immediate downloading. Download now and make an impact on your audience. Highlight the attractive features available with our PPTs.
Client Support Performance Tracking Dashboard Template PDF
This slide shows KPI dashboard which can be used by organizations to track customer service delivery dashboard. It includes customer satisfaction score, total cases received, cases responses, etc. Showcasing this set of slides titled Client Support Performance Tracking Dashboard Template PDF. The topics addressed in these templates are Customer Satisfaction Score, Average, Cases By Product. All the content presented in this PPT design is completely editable. Download it and make adjustments in color, background, font etc. as per your unique business setting.

Client Support Management Dashboard Designs PDF
This slide shows KPI dashboard of customer service delivery management. It includes key performance indicators such as total support requests received, support status, total solved and unsolved issues, etc. Pitch your topic with ease and precision using this Client Support Management Dashboard Designs PDF. This layout presents information on Client Support, Management Dashboard. It is also available for immediate download and adjustment. So, changes can be made in the color, design, graphics or any other component to create a unique layout.

Client Support Dashboard To Measure Satisfaction Level Structure PDF
This slide shows KPI dashboard which can be used to track customer service delivery by channel. It includes weekly customer satisfaction levels. Showcasing this set of slides titled Client Support Dashboard To Measure Satisfaction Level Structure PDF. The topics addressed in these templates are Executive, Customer Satisfaction Level, Email. All the content presented in this PPT design is completely editable. Download it and make adjustments in color, background, font etc. as per your unique business setting.
Client Support Satisfaction Dashboard Icons PDF
This slide shows KPI dashboard which can be used to track customer satisfaction level. It includes key performance indicators such as total requests, cases by channel, customer satisfaction by subject, etc. Showcasing this set of slides titled Client Support Satisfaction Dashboard Icons PDF. The topics addressed in these templates are Client Support, Satisfaction Dashboard. All the content presented in this PPT design is completely editable. Download it and make adjustments in color, background, font etc. as per your unique business setting.
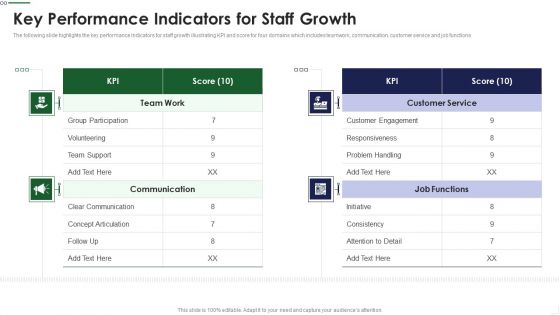
Key Performance Indicators For Staff Growth Topics PDF
The following slide highlights the key performance Indicators for staff growth illustrating KPI and score for four domains which includes teamwork, communication, customer service and job functions Pitch your topic with ease and precision using this Key Performance Indicators For Staff Growth Topics PDF This layout presents information on Customer Engagement, Responsiveness, Problem Handling It is also available for immediate download and adjustment. So, changes can be made in the color, design, graphics or any other component to create a unique layout.
Information Technology Service Integration Post Acquisition Merger Customer Service Measuring Icons PDF
This slide illustrates customer service dashboard covering informational stats about NPS score, growth rate, customer distribution, top customer locations, inbound leads and revenue by type. Deliver an awe inspiring pitch with this creative information technology service integration post acquisition merger customer service measuring icons pdf bundle. Topics like customer service measuring kpi dashboard can be discussed with this completely editable template. It is available for immediate download depending on the needs and requirements of the user.
Customer Attrition In A Bpo - Dashboard Icons PDF
Deliver an awe-inspiring pitch with this creative customer attrition in a bpo - dashboard icons pdf. bundle. Topics like web chart performance, telecom churn overview metrics, customer care call performance, telecom churn overview metrics, monthly revenue lost can be discussed with this completely editable template. It is available for immediate download depending on the needs and requirements of the user.

Customer Attrition In A BPO Dashboard Ppt Show File Formats PDF
Deliver an awe-inspiring pitch with this creative customer attrition in a bpo dashboard ppt show file formats pdf. bundle. Topics like customer care call performance, telecom churn overview metrics, telecom churn overview metrics can be discussed with this completely editable template. It is available for immediate download depending on the needs and requirements of the user.
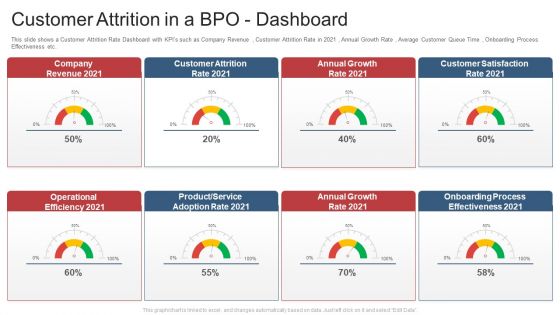
Customer Attrition In A Bpo Dashboard Ppt Model Ideas PDF
Deliver and pitch your topic in the best possible manner with this customer attrition in a bpo dashboard ppt model ideas pdf. Use them to share invaluable insights on telecom churn overview metrics, customer care call performance, monthly revenue lost and impress your audience. This template can be altered and modified as per your expectations. So, grab it now.
Effective Workforce Management Performance Tracking Of Employees Ppt PowerPoint Presentation Inspiration Sample PDF
Presenting this set of slides with name effective workforce management performance tracking of employees ppt powerpoint presentation inspiration sample pdf. The topics discussed in these slides are key metrics 2016, customer satisfaction, cost per contact month, call volume vs service level 2019, neutral. This is a completely editable PowerPoint presentation and is available for immediate download. Download now and impress your audience.
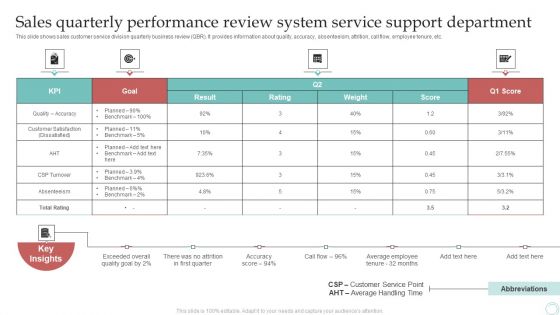
Sales Quarterly Performance Review System Service Support Department Infographics PDF
This slide shows sales customer service division quarterly business review QBR. It provides information about quality, accuracy, absenteeism, attrition, call flow, employee tenure, etc. Pitch your topic with ease and precision using this Sales Quarterly Performance Review System Service Support Department Infographics PDF. This layout presents information on KPI, Goal, Quality Accuracy. It is also available for immediate download and adjustment. So, changes can be made in the color, design, graphics or any other component to create a unique layout.
Dashboard For Tracking Aftersales Customer Services Team Performance Designs PDF
This slide covers the KPI dashboard for ticket tracking. It includes metrics such as tickets by month, service level, and details of customer service department agents. Boost your pitch with our creative Dashboard For Tracking Aftersales Customer Services Team Performance Designs PDF. Deliver an awe inspiring pitch that will mesmerize everyone. Using these presentation templates you will surely catch everyones attention. You can browse the ppts collection on our website. We have researchers who are experts at creating the right content for the templates. So you do not have to invest time in any additional work. Just grab the template now and use them.
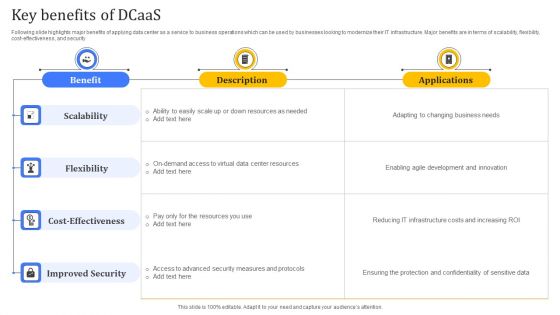
Key Benefits Of Dcaas Diagrams PDF
This slide depicts a dashboard which can be used to monitor the key performing indicators related to data center as a service model. The key performing indicators are items by status, counts by model attributes, item count by customer type, physical vs virtual system Showcasing this set of slides titled Key Benefits Of Dcaas Diagrams PDF. The topics addressed in these templates are Scalability, Flexibility, Cost Effectiveness, Improved Security. All the content presented in this PPT design is completely editable. Download it and make adjustments in color, background, font etc. as per your unique business setting.

Customer Service Metrics Dashboard With Net Retention Rate Sample PDF
This slide showcases KPI dashboard for customer service that can help to compare the customer churn rate, revenue churn rate, net retention rate and MRR growth rate as compared to previous month. Its key elements are net promoter score, loyal customer rate, percentage of premium users and customer lifetime value. Pitch your topic with ease and precision using this Customer Service Metrics Dashboard With Net Retention Rate Sample PDF. This layout presents information on Loyal Customer Rate, Premium Users, Customer Lifetime Value. It is also available for immediate download and adjustment. So, changes can be made in the color, design, graphics or any other component to create a unique layout.

Customer Service Kpis Metrics With Objectives Introduction PDF
The purpose of this slide is to showcase KPIs and objectives of customer service department. Customer satisfaction score, first response time, average handle time and cost per resolution are some of the key KPI mentioned in the slide. Persuade your audience using this Customer Service Kpis Metrics With Objectives Introduction PDF. This PPT design covers one stages, thus making it a great tool to use. It also caters to a variety of topics including Customer Satisfaction, Target, Average Handle. Download this PPT design now to present a convincing pitch that not only emphasizes the topic but also showcases your presentation skills.
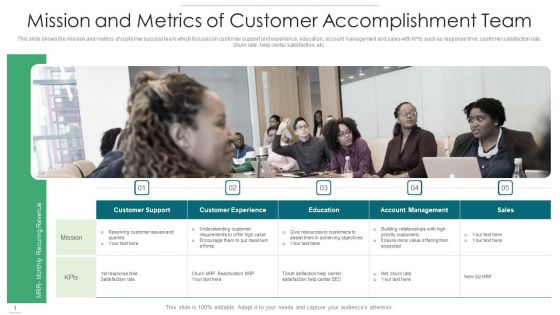
Mission And Metrics Of Customer Accomplishment Team Demonstration PDF
This slide shows the mission and metrics of customer success team which focuses on customer support and experience, education, account management and sales with KPIs such as response time, customer satisfaction rate, churn rate, help center satisfaction, etc. Presenting mission and metrics of customer accomplishment team demonstration pdf to dispense important information. This template comprises five stages. It also presents valuable insights into the topics including customer support, customer experience, education, account management, sales. This is a completely customizable PowerPoint theme that can be put to use immediately. So, download it and address the topic impactfully.

Business Sales Procedures Improvement Dashboard Designs PDF
Following slide shows the dashboard for reengineering business sales processes which assist in accelerated processing times, lower costs, better customer service, and stronger employee retention. The KPI are proposals ,opportunities, etc. Pitch your topic with ease and precision using this Business Sales Procedures Improvement Dashboard Designs PDF. This layout presents information on Deals Opportunities Ratios, Opportunity, Deals Conversion Ratio. It is also available for immediate download and adjustment. So, changes can be made in the color, design, graphics or any other component to create a unique layout.

 Home
Home