Business Turnover

How Much Money We Need Ppt PowerPoint Presentation Outline
This is a how much money we need ppt powerpoint presentation outline. This is a three stage process. The stages in this process are business, marketing, management, production, sales.
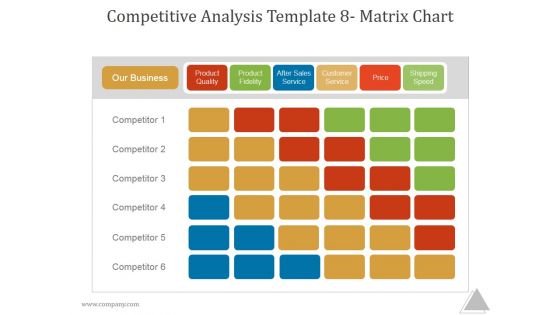
Competitive Analysis Template 8 Matrix Chart Ppt PowerPoint Presentation Templates
This is a competitive analysis template 8 matrix chart ppt powerpoint presentation templates. This is a six stage process. The stages in this process are our business, product quality, product fidelity, after sales service, customer service, price, shipping speed, competitor.

Competitive Analysis Matrix Chart Ppt PowerPoint Presentation Gallery
This is a competitive analysis matrix chart ppt powerpoint presentation gallery. This is a seven stage process. The stages in this process are our business, product quality, product fidelity, after sales service, customer service, price, shipping speed.
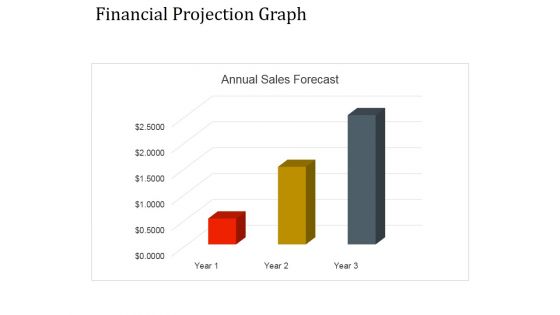
Financial Projection Graph Template 1 Ppt PowerPoint Presentation Graphics
This is a financial projection graph template 1 ppt powerpoint presentation graphics. This is a three stage process. The stages in this process are annual sales, business, management, marketing, strategy.

Financial Projection Graph Template 2 Ppt PowerPoint Presentation Ideas
This is a financial projection graph template 2 ppt powerpoint presentation ideas. This is a nine stage process. The stages in this process are annual sales, business, management, marketing, strategy.

Bar Graph Ppt PowerPoint Presentation Introduction
This is a bar graph ppt powerpoint presentation introduction. This is a eleven stage process. The stages in this process are management, marketing, business, fy, graph, sales in percentage.

Stacked Column Template 2 Ppt PowerPoint Presentation Visuals
This is a stacked column template 2 ppt powerpoint presentation visuals. This is a twelve stage process. The stages in this process are business, marketing, analysis, sales in percentage, finance, growth strategy.

Market Segmentation Evaluation Template 1 Ppt PowerPoint Presentation Templates
This is a market segmentation evaluation template 1 ppt powerpoint presentation templates. This is a two stage process. The stages in this process are market sale, net profit, evaluation, business, marketing.
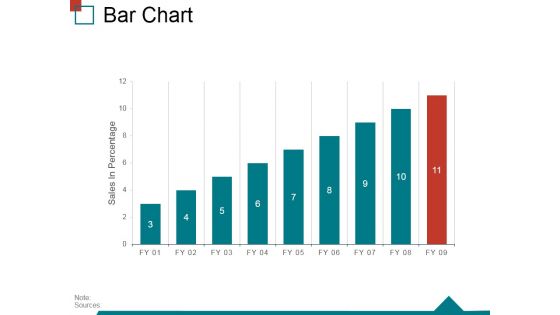
Bar Chart Ppt PowerPoint Presentation Infographic Template Skills
This is a bar chart ppt powerpoint presentation infographic template skills. This is a nine stage process. The stages in this process are sales in percentage, finance, business, marketing, strategy, success.
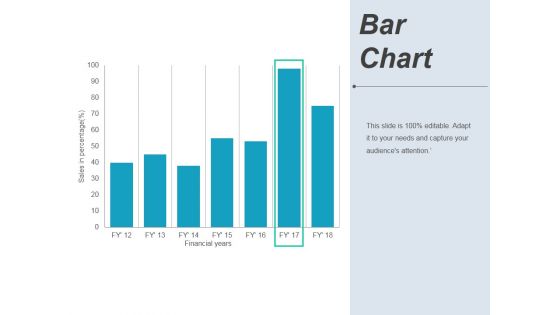
Bar Chart Ppt PowerPoint Presentation Pictures Background Image
This is a bar chart ppt powerpoint presentation pictures background image. This is a seven stage process. The stages in this process are financial years, sales in percentage, graph, business.

Area Chart Ppt Powerpoint Presentation File Show
This is a area chart ppt powerpoint presentation file show. This is a two stage process. The stages in this process are sales in percentage, financial year, product, financial, business.

Scatter Bubble Chart Ppt PowerPoint Presentation Pictures Show
This is a scatter bubble chart ppt powerpoint presentation pictures show. This is a eight stage process. The stages in this process are business, strategy, analysis, pretention, highest sale.
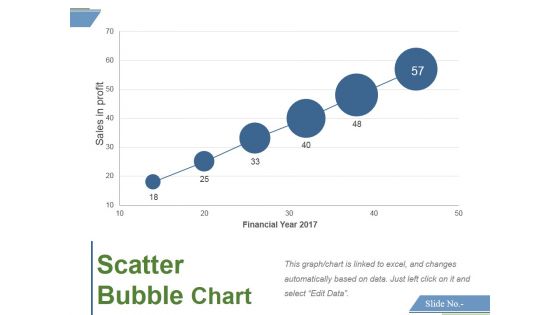
Scatter Bubble Chart Ppt PowerPoint Presentation Professional Model
This is a scatter bubble chart ppt powerpoint presentation professional model. This is a six stage process. The stages in this process are sales in profit, financial year, growth, business, marketing, strategy.

Meet Our Team Ppt PowerPoint Presentation Infographics Templates
This is a meet our team ppt powerpoint presentation infographics templates. This is a three stage process. The stages in this process are graphic designer, ceo, sales manager, teamwork, business.
Scatter Chart Ppt PowerPoint Presentation Icon Elements
This is a scatter chart ppt powerpoint presentation icon elements. This is a nine stage process. The stages in this process are dollar in billions, sales in percentage, business, success.

Scatter Bubble Chart Ppt PowerPoint Presentation Diagram Ppt
This is a scatter bubble chart ppt powerpoint presentation diagram ppt. This is a two stage process. The stages in this process are product, in price, highest sale, percentage, business, marketing.
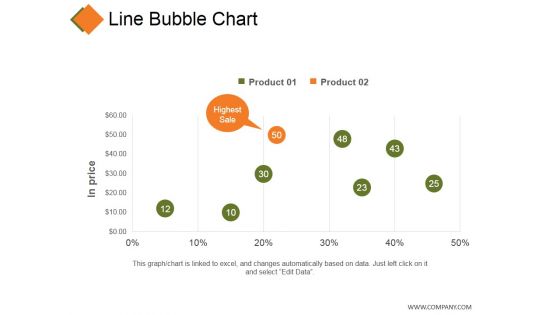
Line Bubble Chart Ppt PowerPoint Presentation Professional Infographic Template
This is a line bubble chart ppt powerpoint presentation professional infographic template. This is a five stage process. The stages in this process are product, in price, highest sale, business, finance.

Monthly Social Media Dashboard Ppt PowerPoint Presentation Model Slide
This is a monthly social media dashboard ppt powerpoint presentation model slide. This is a four stage process. The stages in this process are sales, social events, business, finance, key social metrics.

Line Bubble Chart Ppt PowerPoint Presentation Portfolio Slide Portrait
This is a line bubble chart ppt powerpoint presentation portfolio slide portrait. This is a six stage process. The stages in this process are highest profit, financial year, profit in sales, growth, business.
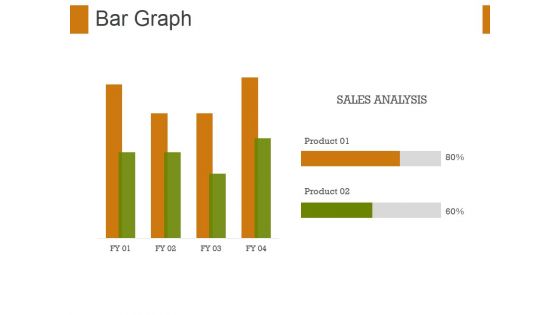
Bar Graph Ppt PowerPoint Presentation File Graphic Tips
This is a bar graph ppt powerpoint presentation file graphic tips. This is a two stage process. The stages in this process are bar graph, finance, marketing, strategy, sales, business.
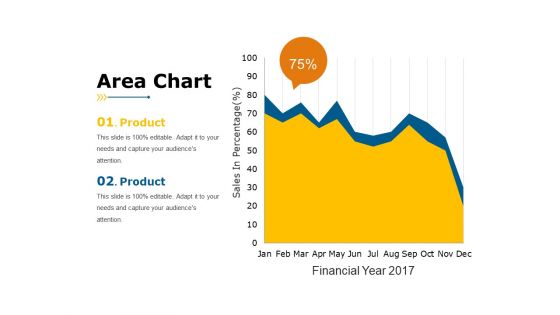
Area Chart Ppt PowerPoint Presentation Slides Rules
This is a area chart ppt powerpoint presentation slides rules. This is a two stage process. The stages in this process are sales in percentage, business, marketing, product, finance.
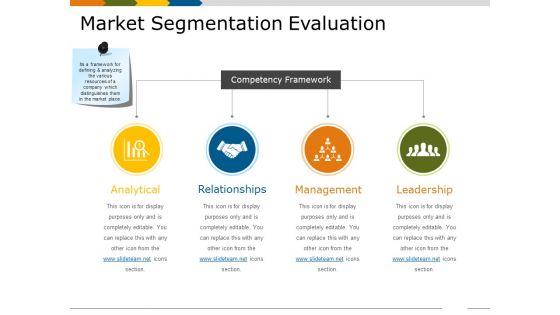
Market Segmentation Evaluation Ppt PowerPoint Presentation Infographics Background
This is a market segmentation evaluation ppt powerpoint presentation infographics background. This is a two stage process. The stages in this process are market sales, net profit, icons, finance, business, marketing.
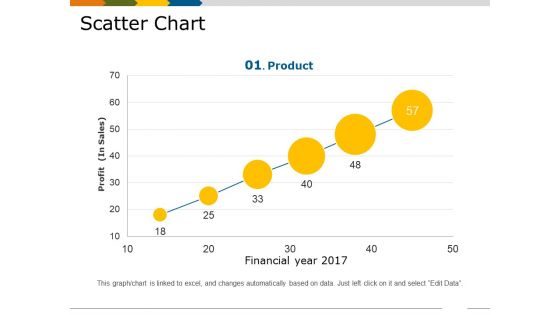
Scatter Chart Template 1 Ppt PowerPoint Presentation Show Slides
This is a scatter chart template 1 ppt powerpoint presentation show slides. This is a six stage process. The stages in this process are financial year, profit in sales, growth, business, marketing, product.

Area Stacked Ppt PowerPoint Presentation Diagram Images
This is a area stacked ppt powerpoint presentation diagram images. This is a two stage process. The stages in this process are sales in percentage, product, business, marketing, finance.
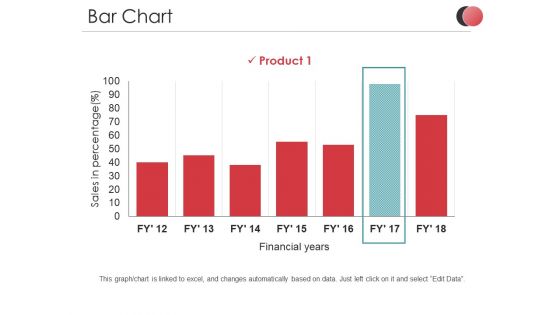
Bar Chart Ppt PowerPoint Presentation Outline Introduction
This is a bar chart ppt powerpoint presentation outline introduction. This is a one stage process. The stages in this process are sales in percentage, product, business, financial years, graph.
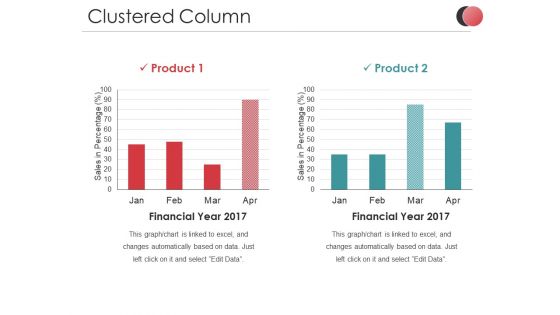
Clustered Column Ppt PowerPoint Presentation Slides Ideas
This is a clustered column ppt powerpoint presentation slides ideas. This is a two stage process. The stages in this process are sales in percentage, business, marketing, finance, graph.
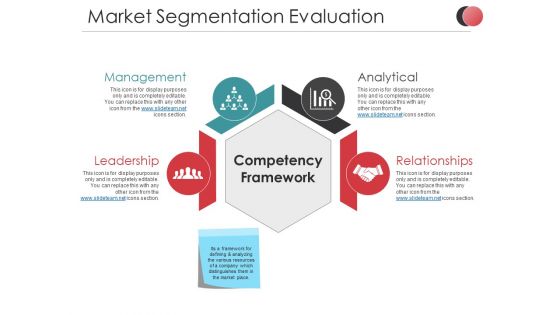
Market Segmentation Evaluation Ppt PowerPoint Presentation Summary Slideshow
This is a market segmentation evaluation ppt powerpoint presentation summary slideshow. This is a two stage process. The stages in this process are net profit, market sales, business, marketing, finance, icons.

Stacked Column Ppt PowerPoint Presentation Infographics Samples
This is a stacked column ppt powerpoint presentation infographics samples. This is a two stage process. The stages in this process are product, sales in percentage, business, marketing, graph.

Supply Chain Management Budget Forecasting Ppt PowerPoint Presentation Styles Styles
This is a supply chain management budget forecasting ppt powerpoint presentation styles styles. This is a four stage process. The stages in this process are sales, budget forecasting, percentage, business, process.

Scatter Bubble Chart Ppt PowerPoint Presentation Infographic Template Examples
This is a scatter bubble chart ppt powerpoint presentation infographic template examples. This is a two stage process. The stages in this process are highest sale, product, in price, finance, business.
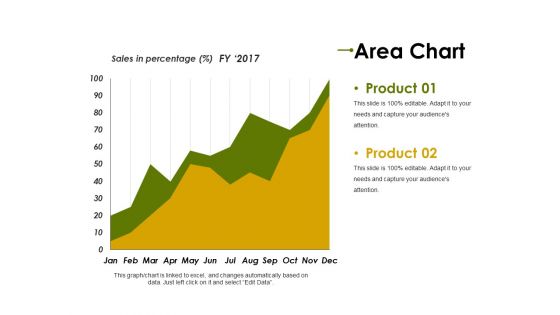
Area Chart Ppt PowerPoint Presentation Summary Objects
This is a area chart ppt powerpoint presentation summary objects. This is a two stage process. The stages in this process are product, sales in percentage, finance, business, marketing.

Clustered Column Ppt PowerPoint Presentation Ideas Graphic Tips
This is a clustered column ppt powerpoint presentation ideas graphic tips. This is a two stage process. The stages in this process are financial year, sales in percentage, product, graph, business.

Stacked Column Ppt PowerPoint Presentation Professional Vector
This is a stacked column ppt powerpoint presentation professional vector. This is a two stage process. The stages in this process are product, sales in percentage, business, marketing, graph.
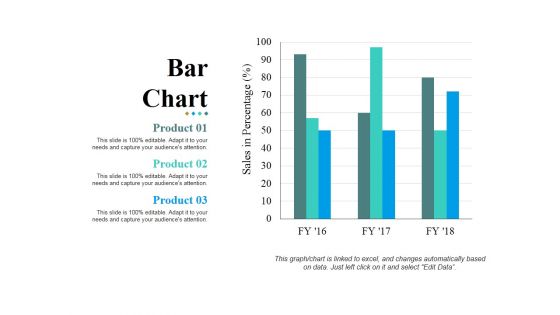
Bar Chart Ppt PowerPoint Presentation Layouts Pictures
This is a bar chart ppt powerpoint presentation layouts pictures. This is a three stage process. The stages in this process are bar graph, product, sales in percentage, business, marketing.
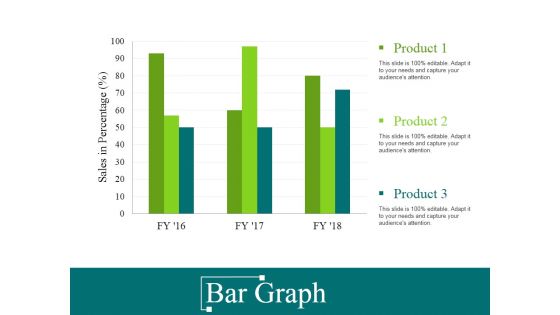
Bar Graph Ppt PowerPoint Presentation Gallery Grid
This is a bar graph ppt powerpoint presentation gallery grid. This is a three stage process. The stages in this process are sales in percentage, product, finance, business, marketing.
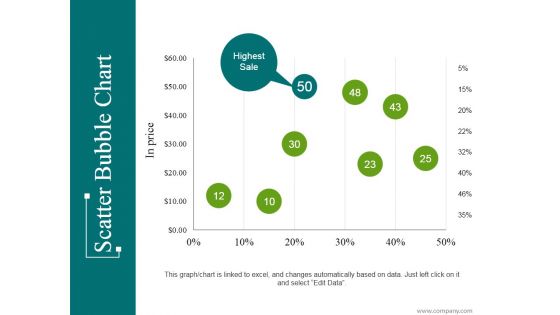
Scatter Bubble Chart Ppt PowerPoint Presentation Infographic Template Introduction
This is a scatter bubble chart ppt powerpoint presentation infographic template introduction. This is a eight stage process. The stages in this process are highest sale, business, marketing, percentage, finance.
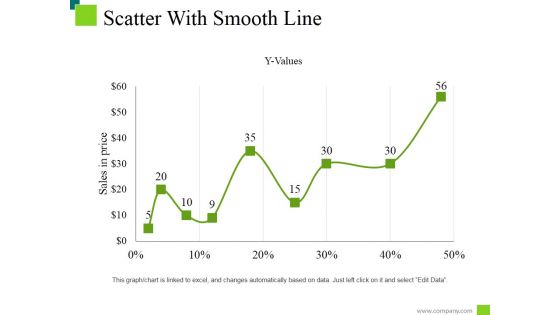
Scatter With Smooth Line Ppt PowerPoint Presentation Professional Display
This is a scatter with smooth line ppt powerpoint presentation professional display. This is a nine stage process. The stages in this process are sale price, business, marketing, percentage, finance.

Stack Area Chart Ppt PowerPoint Presentation Show Samples
This is a stack area chart ppt powerpoint presentation show samples. This is a two stage process. The stages in this process are product, sales in percentage, business, marketing, percentage.

Bar Chart Ppt PowerPoint Presentation Professional Graphics Download
This is a bar chart ppt powerpoint presentation professional graphics download. This is a seven stage process. The stages in this process are sales in percentage, financial years, chart, business.

Clustered Column Ppt PowerPoint Presentation Portfolio Smartart
This is a clustered column ppt powerpoint presentation portfolio smartart. This is a two stage process. The stages in this process are financial year, product, sales in percentage, finance, business, graph.

Bar Chart Ppt PowerPoint Presentation Styles Outfit
This is a bar chart ppt powerpoint presentation styles outfit. This is a Seven stage process. The stages in this process are sales in percentage, financial years, graph, business.

Clustered Column Ppt PowerPoint Presentation Pictures Mockup
This is a clustered column ppt powerpoint presentation pictures mockup. This is a two stage process. The stages in this process are product, sales in percentage, financial year, graph, business.
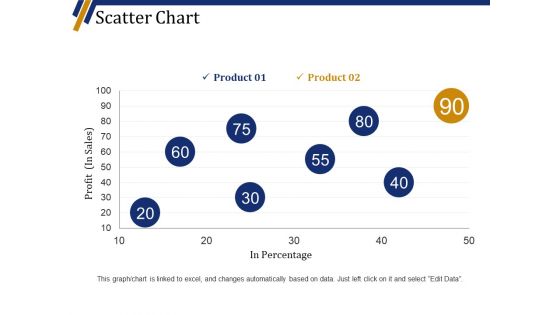
Scatter Chart Ppt PowerPoint Presentation Summary Visuals
This is a scatter chart ppt powerpoint presentation summary visuals. This is a eight stage process. The stages in this process are product, profit in sales, in percentage, finance, business.
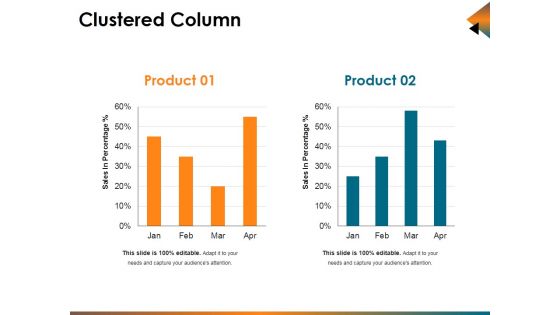
Clustered Column Ppt PowerPoint Presentation Infographic Template Background Designs
This is a clustered column ppt powerpoint presentation infographic template background designs. This is a two stage process. The stages in this process are sales in percentage, bar, business, marketing, planning.

Our Team Ppt PowerPoint Presentation Portfolio Graphics Download
This is a our team ppt powerpoint presentation portfolio graphics download. This is a two stage process. The stages in this process are sales manager, graphic designer, our team, business, management.
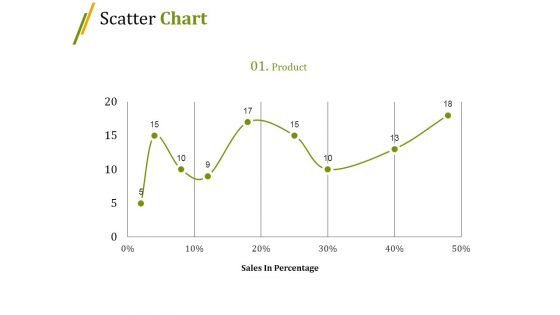
Scatter Chart Ppt PowerPoint Presentation Slides Summary
This is a scatter chart ppt powerpoint presentation slides summary. This is a nine stage process. The stages in this process are sales in percentage, growth, graph, business, marketing.

Area Chart Ppt PowerPoint Presentation Layouts Maker
This is a area chart ppt powerpoint presentation layouts maker. This is a two stage process. The stages in this process are financial year, sales in percentage, graph, business, marketing.

Area Chart Ppt PowerPoint Presentation Professional Brochure
This is a area chart ppt powerpoint presentation professional brochure. This is a two stage process. The stages in this process are sales in percentage, business, marketing, finance, graph.

Column Chart Ppt PowerPoint Presentation Slides Smartart
This is a column chart ppt powerpoint presentation slides smartart. This is a two stage process. The stages in this process are sales in percentage, financial year in, business, growth, strategy.
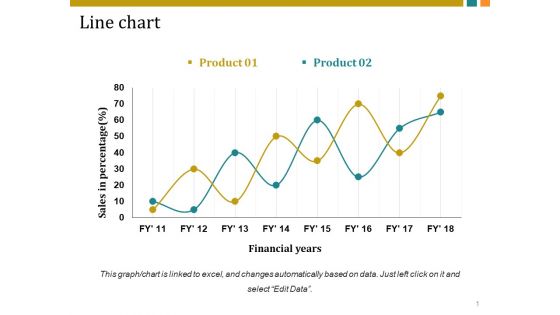
Line Chart Ppt PowerPoint Presentation Inspiration Vector
This is a line chart ppt powerpoint presentation inspiration vector. This is a two stage process. The stages in this process are sales in percentage, financial years, business, marketing, growth.

Acquisition Strategy Plan Template 1 Ppt PowerPoint Presentation Ideas Backgrounds
This is a acquisition strategy plan template 1 ppt powerpoint presentation ideas backgrounds. This is a four stage process. The stages in this process are driving traffic, conversion, nurturing, sales, business, icons.

Acquisition Strategy Plan Template 2 Ppt PowerPoint Presentation Ideas Infographics
This is a acquisition strategy plan template 2 ppt powerpoint presentation ideas infographics. This is a four stage process. The stages in this process are driving traffic, conversion, nurturing, sales, business.

Bar Chart Ppt PowerPoint Presentation Portfolio Diagrams
This is a bar chart ppt powerpoint presentation portfolio diagrams. This is a three stage process. The stages in this process are sales in percentage, business, marketing, graph, finance.
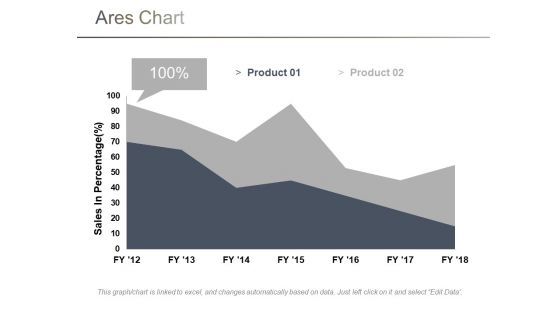
Area Chart Ppt PowerPoint Presentation Model Influencers
This is a area chart ppt powerpoint presentation model influencers. This is a two stage process. The stages in this process are sales in percentage, chart, business, marketing, finance.

Line Chart Ppt PowerPoint Presentation Infographics Graphic Images
This is a line chart ppt powerpoint presentation infographics graphic images. This is a two stage process. The stages in this process are sales in percentage, financial years, growth, business, marketing.

Area Chart Ppt PowerPoint Presentation Inspiration Demonstration
This is a area chart ppt powerpoint presentation inspiration demonstration. This is a two stage process. The stages in this process are sales in percentage, chart, percentage, business, marketing.

Area Chart Ppt PowerPoint Presentation Summary Show
This is a area chart ppt powerpoint presentation summary show. This is a two stage process. The stages in this process are sales in percentage, financial year, business, marketing, finance.
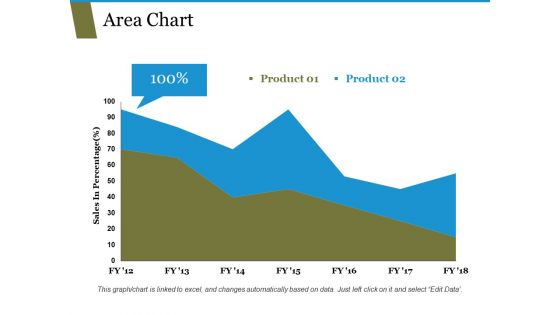
Area Chart Ppt PowerPoint Presentation Portfolio Templates
This is a area chart ppt powerpoint presentation portfolio templates. This is a two stage process. The stages in this process are sales in percentage, chart, business, marketing, finance.
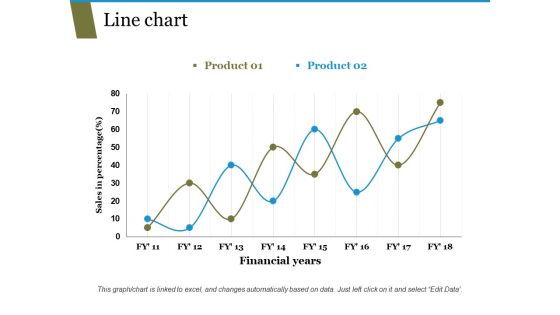
Line Chart Ppt PowerPoint Presentation Pictures Templates
This is a line chart ppt powerpoint presentation pictures templates. This is a two stage process. The stages in this process are sales in percentage, financial years, business, marketing, growth.
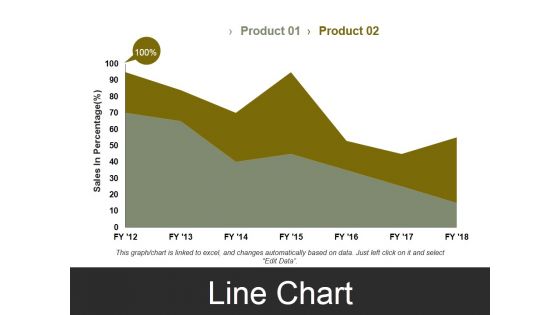
Line Chart Template 3 Ppt PowerPoint Presentation Styles Visual Aids
This is a line chart template 3 ppt powerpoint presentation styles visual aids. This is a two stage process. The stages in this process are sales in percentage, business, marketing, finance, graph.

 Home
Home