Business Review Dashboard
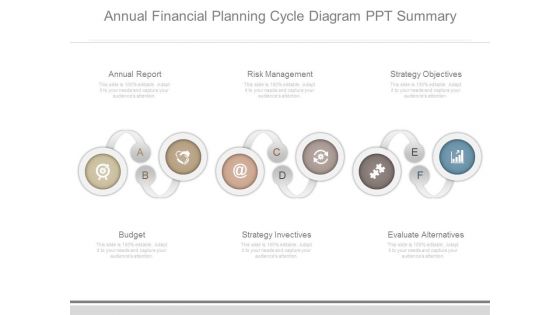
Annual Financial Planning Cycle Diagram Ppt Summary
This is a annual financial planning cycle diagram ppt summary. This is a six stage process. The stages in this process are annual report, risk management, strategy objectives, budget, strategy invectives, evaluate alternatives.
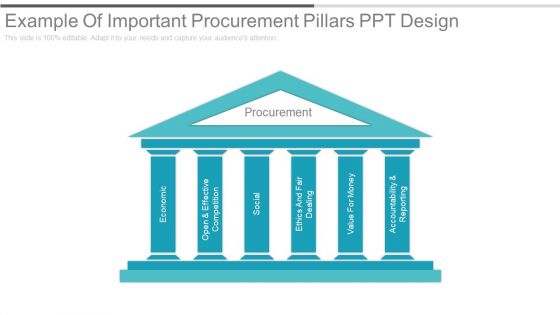
Example Of Important Procurement Pillars Ppt Design
This is a example of important procurement pillars ppt design. This is a six stage process. The stages in this process are procurement, economic, open and effective competition, social, ethics and fair dealing, value for money, accountability and reporting.
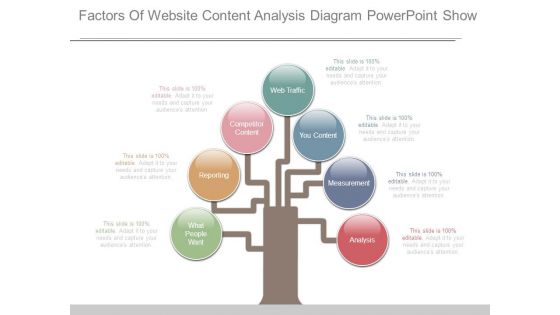
Factors Of Website Content Analysis Diagram Powerpoint Show
This is a factors of website content analysis diagram powerpoint show. This is a seven stage process. The stages in this process are what people want, reporting, competitor content, web traffic, you content, measurement, analysis.

Solution Selling Template Powerpoint Slide Designs Download
This is a solution selling template powerpoint slide designs download. This is a five stage process. The stages in this process are export controls, report and refine, campaign invention, execution, goals and objective.
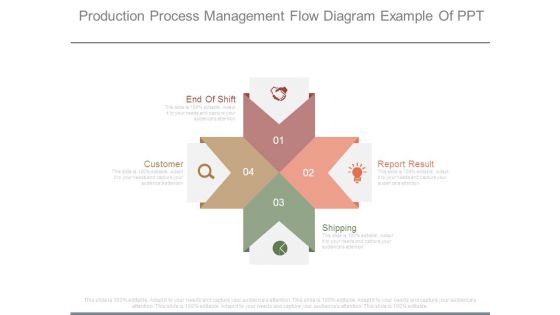
Production Process Management Flow Diagram Example Of Ppt
This is a production process management flow diagram example of ppt. This is a four stage process. The stages in this process are end of shift, customer, report result, shipping.

Service Delivery Process Template Powerpoint Show
This is a service delivery process template powerpoint show. This is a seven stage process. The stages in this process are need recognition, management, planning scoping, close the sale, formulate solution, reporting, fieldwork execution.
Executive Management Team Roles And Responsibilities Ppt Icon
This is a executive management team roles and responsibilities ppt icon. This is a eight stage process. The stages in this process are reporting, oversight, planning, messaging, monitoring, risk analysis, project manager, implementing.
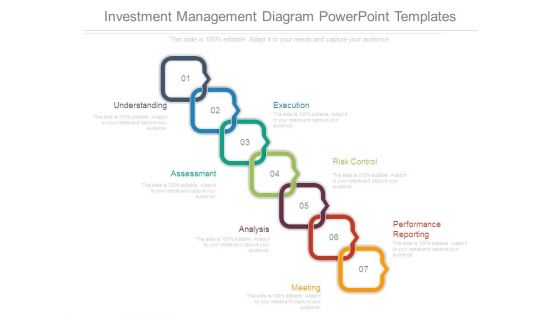
Investment Management Diagram Powerpoint Templates
This is a investment management diagram powerpoint templates. This is a seven stage process. The stages in this process are understanding, execution, risk control, performance reporting, meeting, analysis, assessment.
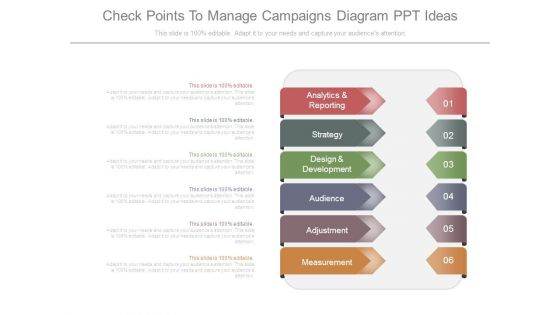
Check Points To Manage Campaigns Diagram Ppt Ideas
This is a check points to manage campaigns diagram ppt ideas. This is a six stage process. The stages in this process are analytics and reporting, strategy, design and development, audience, adjustment, measurement.

Category Management Training Chart Ppt Slides Styles
This is a category management training chart ppt slides styles. This is a four stage process. The stages in this process are category prioritization and assessment, result tracking and reporting, category strategy development, supplier relationship.

Metric Development Process Diagram Presentation Powerpoint Example
This is a metric development process diagram presentation powerpoint example. This is a seven stage process. The stages in this process are define, measure, process improvement identified, technical development and implementation, requirements for metric, reporting, action.
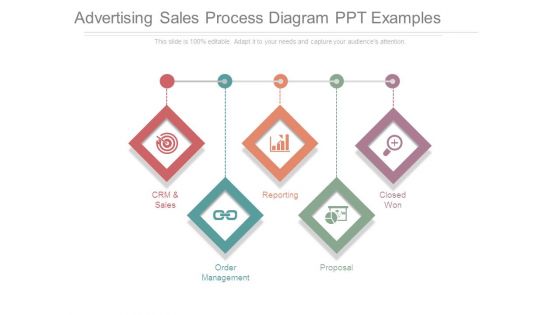
Advertising Sales Process Diagram Ppt Examples
This is a advertising sales process diagram ppt examples. This is a five stage process. The stages in this process are crm and sales, order management, reporting, proposal, closed won.
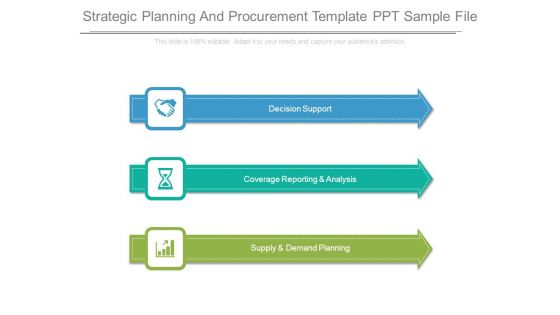
Strategic Planning And Procurement Template Ppt Sample File
This is a strategic planning and procurement template ppt sample file. This is a three stage process. The stages in this process are decision support, coverage reporting and analysis, supply and demand planning.

Call Center Administration Diagram Powerpoint Slide Background Picture
This is a call center administration diagram powerpoint slide background picture. This is a five stage process. The stages in this process are training manager, general service manager, hr and admin manager, integration, reporting.
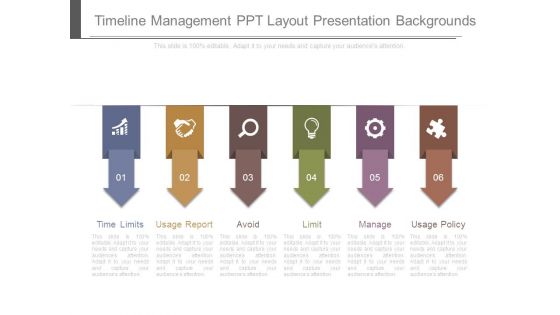
Timeline Management Ppt Layout Presentation Backgrounds
This is a timeline management ppt layout presentation backgrounds. This is a six stage process. The stages in this process are time limits, usage report, avoid, limit, manage, usage policy.
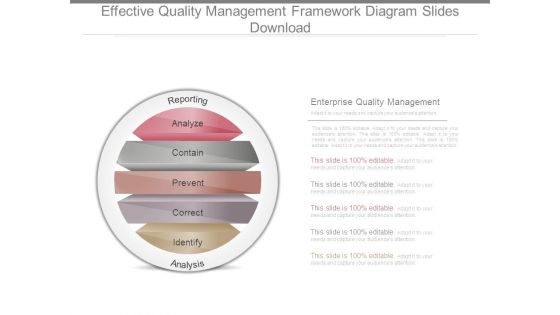
Effective Quality Management Framework Diagram Slides Download
This is a effective quality management framework diagram slides download. This is a five stage process. The stages in this process are reporting, analyze, contain, prevent, correct, identify, analysis, enterprise quality management.
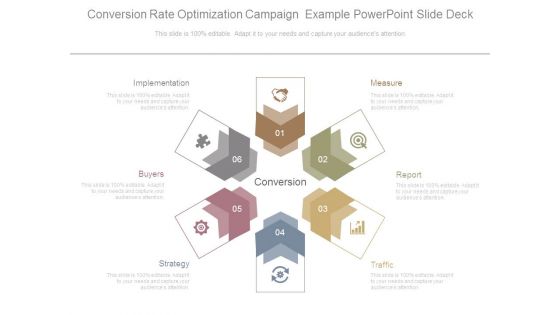
Conversion Rate Optimization Campaign Example Powerpoint Slide Deck
This is a conversion rate optimization campaign example powerpoint slide deck. This is a six stage process. The stages in this process are measure, report, traffic, strategy, buyers, implementation.

Audit Administration Model Ppt Diagram Presentation Slides
This is a audit administration model ppt diagram presentation slides. This is a five stage process. The stages in this process are analysis, grading, audit planning, corrective action, audit reporting.

Threat Structure Ppt Diagram Ppt Background Images
This is a threat structure ppt diagram ppt background images. This is a eight stage process. The stages in this process are project sponsor, internal audit, risk identification, timing, tools, milestones, reporting, information criteria.

Price Management On Activity Basis Example Ppt Examples Slides
This is a price management on activity basis example ppt examples slides. This is a six stage process. The stages in this process are cost, outcomes, identify activities and activity pools, assign cost to cost objects, prepare reports.

Secondary Analysis Ppt Template Presentation Diagrams
This is a secondary analysis ppt template presentation diagrams. This is a four stage process. The stages in this process are news media reports, competitive landscape, communication audit, research papers.

Technological Process Ppt Layout Powerpoint Slide Designs
This is a technological process ppt layout powerpoint slide designs. This is a eight stage process. The stages in this process are purpose, construct, materials, procedure, report result, conclusion, observation, test with an experiment.

Portfolio Risk And Performance Analytics Template Ppt Model
This is a portfolio risk and performance analytics template ppt model. This is a six stage process. The stages in this process are single security analytics, portfolio risk and return attribution, managed services, factor models, portfolio risk reporting, portfolio optimization.
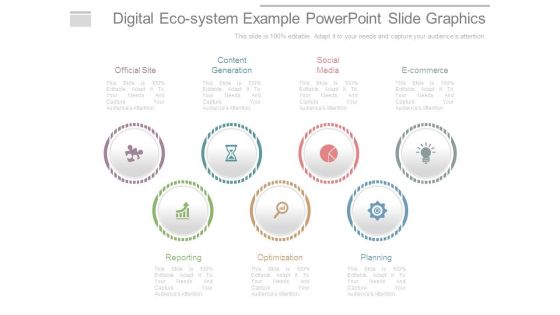
Digital Eco System Example Powerpoint Slide Graphics
This is a digital eco system example powerpoint slide graphics. This is a seven stage process. The stages in this process are official site, content generation, social media, e commerce, planning, optimization, reporting.

Mechanical Reasoning Tests Diagram Ppt Slides Download
This is a mechanical reasoning tests diagram ppt slides download. This is a five stage process. The stages in this process are mechanical reasoning, report, analyze, levers, set goals.
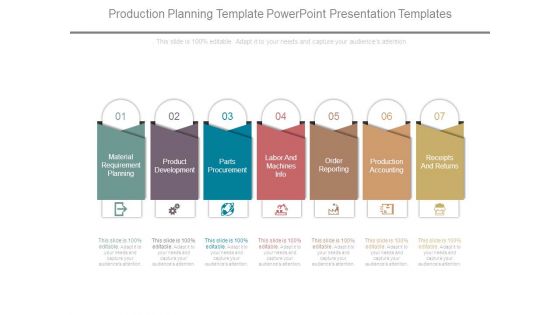
Production Planning Template Powerpoint Presentation Templates
This is a production planning template powerpoint presentation templates. This is a seven stage process. The stages in this process are material requirement planning, product development, parts procurement, labor and machines info, order reporting, production accounting, receipts and returns.
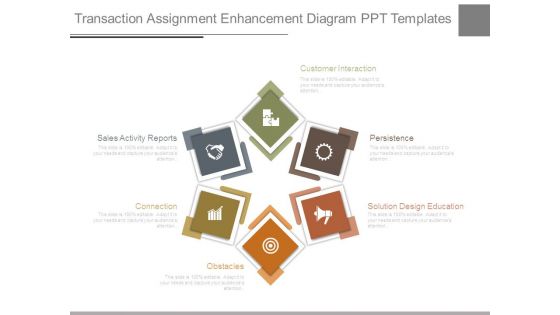
Transaction Assignment Enhancement Diagram Ppt Templates
This is a transaction assignment enhancement diagram ppt templates. This is a six stage process. The stages in this process are customer interaction, persistence, solution design education, obstacles, connection, sales activity reports.
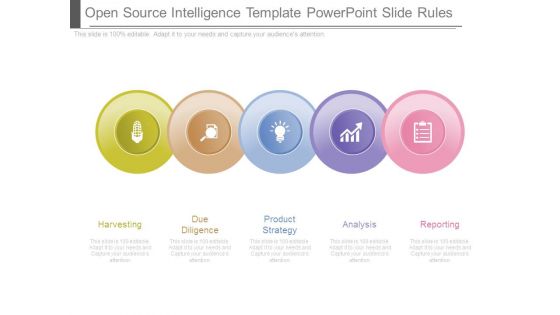
Open Source Intelligence Template Powerpoint Slide Rules
This is a open source intelligence template powerpoint slide rules. This is a five stage process. The stages in this process are harvesting, due diligence, product strategy, analysis, reporting.
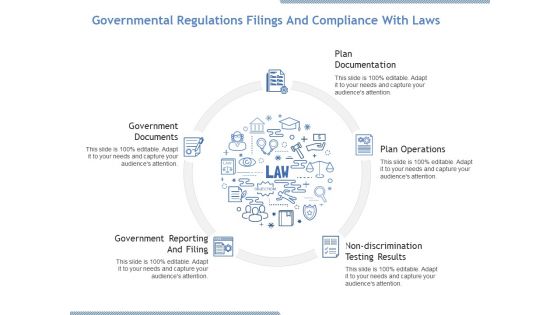
Governmental Regulations Filings And Compliance With Laws Ppt PowerPoint Presentation Infographic Template Visuals
This is a governmental regulations filings and compliance with laws ppt powerpoint presentation infographic template visuals. This is a five stage process. The stages in this process are plan documentation, plan operations, government documents, government reporting and filing.
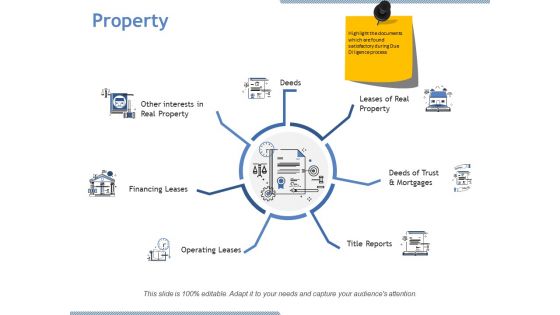
Property Ppt PowerPoint Presentation Professional Background Designs
This is a property ppt powerpoint presentation professional background designs. This is a seven stage process. The stages in this process are deeds, financing leases, operating leases, title reports, leases of real property.

Process Methodology Five Steps Ppt PowerPoint Presentation Layouts Grid
This is a process methodology five steps ppt powerpoint presentation layouts grid. This is a five stage process. The stages in this process are prepare, design, execute, manage monitor and report, discover, classify and audit.
Skill Matrix In It Industry Ppt PowerPoint Presentation Icon Graphics
This is a skill matrix in it industry ppt powerpoint presentation icon graphics. This is a six stage process. The stages in this process are role, network services, interface, analysis, reports design.
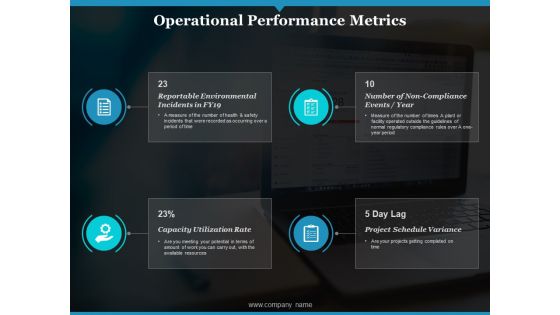
Operational Performance Metrics Ppt PowerPoint Presentation Ideas Background Image
This is a operational performance metrics ppt powerpoint presentation ideas background image. This is a four stage process. The stages in this process are reportable environmental incidents, number of non compliance events, capacity utilization rate.

Marketing Strategy Ppt PowerPoint Presentation Portfolio Inspiration
This is a marketing strategy ppt powerpoint presentation portfolio inspiration. This is a seven stage process. The stages in this process are paid advertising, analytics and reporting, email marketing, social media blog, website design, search engine optimization.
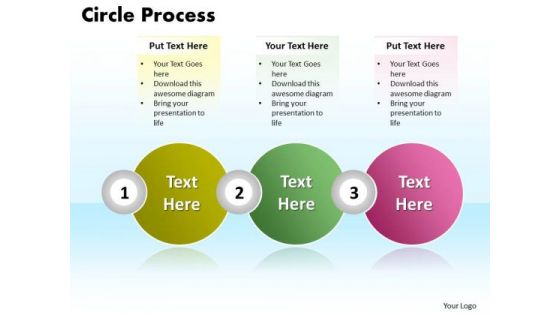
Ppt Circle Diamond Mining Process PowerPoint Presentation 3 State Diagram Templates
PPT circle diamond mining process powerpoint presentation 3 state diagram Templates-Use this circular PPT abstraction to establish a link between your personal methodology and action research possibilities -PPT circle diamond mining process powerpoint presentation 3 state diagram Templates-Abstract, Business, Chart, Circle, Company, Corporate, Design, Diagram, Different, Graph, Illustration, Information, Item, Junction, Management, Marketing, Menu, Modern, Network, Options, Parts, Pie, Plan, Presentation, Process, Report, Representational, Segments, Sphere, Statistics, Strategy, Structure, Wheel
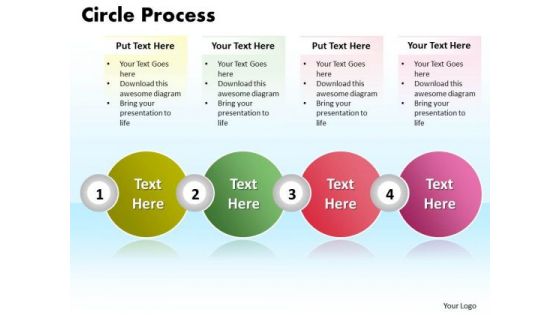
Ppt Circle Military Decision Making Process PowerPoint Presentation 4 Stages Templates
PPT circle military decision making process powerpoint presentation 4 stages Templates-This Chart is a simple template that provides a graphical, time-phased overview of a continuing sequence of stages, tasks, or events.-PPT circle military decision making process powerpoint presentation 4 stages Templates-Abstract, Business, Chart, Circle, Company, Corporate, Design, Diagram, Different, Graph, Illustration, Information, Item, Junction, Management, Marketing, Menu, Modern, Network, Options, Parts, Pie, Plan, Presentation, Process, Report, Representational, Segments, Sphere, Statistics, Strategy, Structure, Wheel
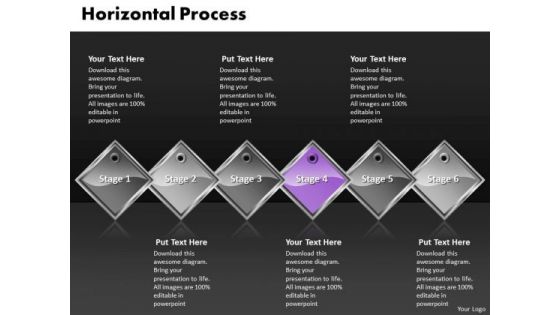
Ppt Purple Diamond Horizontal Process Six Practice The PowerPoint Macro Steps Templates
PPT purple diamond horizontal process six practice the powerpoint macro steps Templates-Use this diagram to evolve the strategy to take you down the required path with appropriate, efficient and effective marketing along the way. This helps to focus the thoughts of your listeners.-PPT purple diamond horizontal process six practice the powerpoint macro steps Templates-Advertise, Advertisement, Badge, Box, Business, Card, Collection, Column, Corporate, Costing, Counting, Design, Discount, Element, Featured, Finance, Grid, Hosting, Information, List, Message, Placard, Plan, Price, Pricing, Rectangle, Report, Round
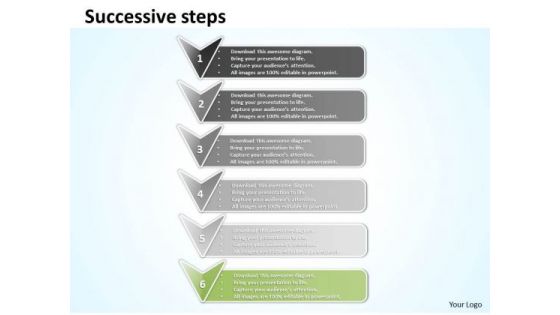
Ppt Successive Create PowerPoint Macro Through Circular Arrows 2007 Templates
PPT successive create powerpoint macro through circular arrows 2007 Templates-Often you have to represent an organization using a simple organizational hierarchy, but by using this PowerPoint Diagram you will give your Presentation a new look and will make it more interesting to watch. It is a useful captivating tool enables you to define your message in your Marketing PPT presentations. You can edit text, color, shade and style as per you need.-PPT successive create powerpoint macro through circular arrows 2007 Templates-arrows, business, chart, company, concept, continuity, continuous, cycle, diagram, direction, dynamic, graph, iteration, iterative, method, path, phase, presentation, process, production, progress, progression, recycle, recycling, report, rotation, sequence, stage, steps, succession, vector

Our Company Snapshot For Digital Marketing Pitch Deck Themes PDF
The following slide displays the overview of the company along with the key details such as the date of organizations inception, the name of founder etc. Presenting our company snapshot for digital marketing pitch deck themes pdf to provide visual cues and insights. Share and navigate important information on four stages that need your due attention. This template can be used to pitch topics like achieve tremendous success, performing organization, founded under the leadership. In addtion, this PPT design contains high resolution images, graphics, etc, that are easily editable and available for immediate download.

Customer Churn Prediction And Prevention Training Required For Marketing Strategies Formats PDF
Presenting this set of slides with name customer churn prediction and prevention training required for marketing strategies formats pdf. This is a six stage process. The stages in this process are product knowledge, ms excel training, reporting format, software usage. This is a completely editable PowerPoint presentation and is available for immediate download. Download now and impress your audience.

Ppt Correlated Arrows PowerPoint Templates Even Line 7 Stages
PPT correlated arrows powerpoint templates even line 7 stages-This Diagram is used to illustrate how information will move between interrelated systems in the accomplishment of a given function, task or process. The visual description of this information flow with each given level showing how data is fed into a given process step and subsequently passed along at the completion of that step.-PPT correlated arrows powerpoint templates even line 7 stages-Aim, Arrow, Badge, Border, Color, Connection, Curve, Design, Direction, Download, Icon, Illustration, Indicator, Internet, Label, Link, Magenta, Mark, Next, Object, Orientation, Paper, Peeling, Pointer, Rounded, Set, Shadow, Shape, Sign
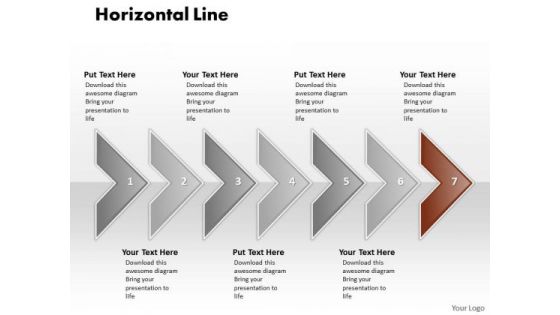
Ppt Correlated Circular Arrows PowerPoint 2010 Horizontal Line 7 Stages Templates
PPT correlated circular arrows powerpoint 2010 horizontal line 7 stages Templates-This Diagram is used to illustrate how information will move between interrelated systems in the accomplishment of a given function, task or process. The visual description of this information flow with each given level showing how data is fed into a given process step and subsequently passed along at the completion of that step.-PPT correlated circular arrows powerpoint 2010 horizontal line 7 stages Templates-Aim, Arrow, Badge, Border, Color, Connection, Curve, Design, Direction, Download, Icon, Illustration, Indicator, Internet, Label, Link, Magenta, Mark, Next, Object, Orientation, Paper, Peeling, Pointer, Rounded, Set, Shadow, Shape, Sign
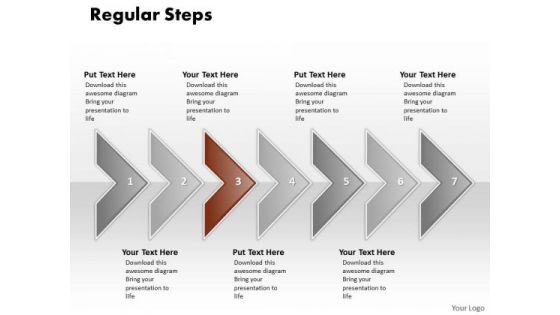
Ppt Correlated Curved Arrows PowerPoint 2010 Regular Line 7 Stages Templates
PPT correlated curved arrows powerpoint 2010 regular line 7 stages Templates-This Diagram is used to illustrate how information will move between interrelated systems in the accomplishment of a given function, task or process. The visual description of this information flow with each given level showing how data is fed into a given process step and subsequently passed along at the completion of that step.-PPT correlated curved arrows powerpoint 2010 regular line 7 stages Templates-Aim, Arrow, Badge, Border, Color, Connection, Curve, Design, Direction, Download, Icon, Illustration, Indicator, Internet, Label, Link, Magenta, Mark, Next, Object, Orientation, Paper, Peeling, Pointer, Rounded, Set, Shadow, Shape, Sign

Ppt Correlated PowerPoint Graphics Arrows Parallel Line 7 Stage Templates
PPT correlated powerpoint graphics arrows parallel line 7 stage Templates-This Diagram is used to illustrate how information will move between interrelated systems in the accomplishment of a given function, task or process. The visual description of this information flow with each given level showing how data is fed into a given process step and subsequently passed along at the completion of that step.-PPT correlated powerpoint graphics arrows parallel line 7 stage Templates-Aim, Arrow, Badge, Border, Color, Connection, Curve, Design, Direction, Download, Icon, Illustration, Indicator, Internet, Label, Link, Magenta, Mark, Next, Object, Orientation, Paper, Peeling, Pointer, Rounded, Set, Shadow, Shape, Sign

Ppt Correlated Shapes Arrows PowerPoint Horizontal Stages Templates
PPT correlated shapes arrows powerpoint horizontal stages Templates-This Diagram is used to illustrate how information will move between interrelated systems in the accomplishment of a given function, task or process. The visual description of this information flow with each given level showing how data is fed into a given process step and subsequently passed along at the completion of that step.-PPT correlated shapes arrows powerpoint horizontal stages Templates-Aim, Arrow, Badge, Border, Color, Connection, Curve, Design, Direction, Download, Icon, Illustration, Indicator, Internet, Label, Link, Magenta, Mark, Next, Object, Orientation, Paper, Peeling, Pointer, Rounded, Set, Shadow, Shape, Sign

Ppt Correlated Shapes Arrows PowerPoint Straight Line 7 Phase Diagram Templates
PPT correlated shapes arrows powerpoint straight line 7 phase diagram Templates-This Diagram is used to illustrate how information will move between interrelated systems in the accomplishment of a given function, task or process. The visual description of this information flow with each given level showing how data is fed into a given process step and subsequently passed along at the completion of that step.-PPT correlated shapes arrows powerpoint straight line 7 phase diagram Templates-Aim, Arrow, Badge, Border, Color, Connection, Curve, Design, Direction, Download, Icon, Illustration, Indicator, Internet, Label, Link, Magenta, Mark, Next, Object, Orientation, Paper, Peeling, Pointer, Rounded, Set, Shadow, Shape, Sign

Ppt Eight Phase Diagram Social Media PowerPoint Presentation Process Templates
PPT eight phase diagram social media powerpoint presentation process Templates-This Diagram is used to illustrate how information will move between interrelated systems in the accomplishment of a given function, task or process. The visual description of this information flow with each given level showing how data is fed into a given process step and subsequently passed along at the completion of that step.-PPT eight phase diagram social media powerpoint presentation process Templates-Aim, Arrow, Badge, Border, Color, Connection, Curve, Design, Direction, Download, Icon, Illustration, Indicator, Internet, Label, Link, Magenta, Mark, Next, Object, Orientation, Paper, Peeling, Pointer, Rounded, Set, Shadow, Shape, Sign
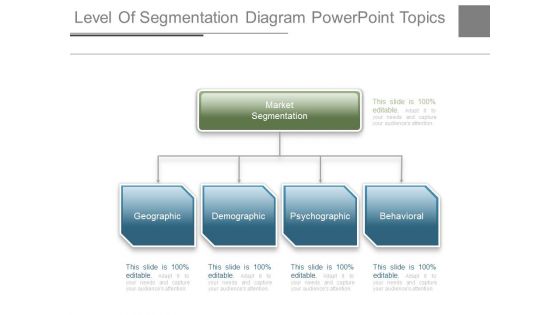
Level Of Segmentation Diagram Powerpoint Topics
This is a level of segmentation diagram powerpoint topics. This is a five stage process. The stages in this process are reporting and market segmentation, geographic, demographic, psychographic, behavioral.
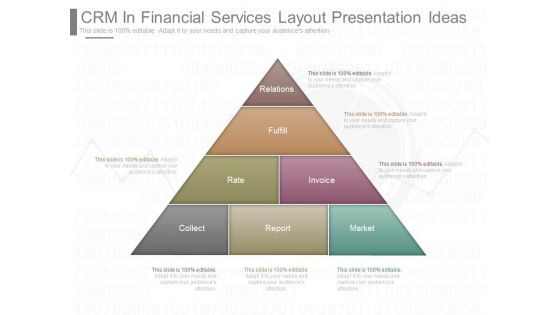
Crm In Financial Services Layout Presentation Ideas
This is a crm in financial services layout presentation ideas. This is a seven stage process. The stages in this process are relations, fulfill, rate, invoice, collect, report, market.

Planning Process Of Conversion Optimization Ppt Presentation Visuals
This is a planning process of conversion optimization ppt presentation visuals. This is a six stage process. The stages in this process are market, design, report, measure, strategy, analyse.

Professional Social Media Management Template Ppt Slides
This is a professional social media management template ppt slides. This is a four stage process. The stages in this process are continuous improvement, content creation, campaign analysis and reporting, deployment of campaign, initial campaign meeting, production, marketing schedule, promotion.

Ppt PowerPoint Slide Numbers Of Marketing Process Using 8 State Diagram Templates
PPT powerpoint slide numbers of marketing process using 8 state diagram Templates-Our compelling template consists of a design of arrow in straight line. This Diagram is used to illustrate how information will move between interrelated systems in the accomplishment of a given function, task or process. The visual description of this information flow with each given level showing how data is fed into a given process step and subsequently passed along at the completion of that step.-PPT powerpoint slide numbers of marketing process using 8 state diagram Templates-Aim, Arrow, Badge, Border, Color, Connection, Curve, Design, Direction, Download, Icon, Illustration, Indicator, Internet, Label, Link, Magenta, Mark, Next, Object, Orientation, Paper, Peeling, Pointer, Rounded, Set, Shadow, Shape, Sign
Website Performance Report Icon With Data Download PDF
Persuade your audience using this Website Performance Report Icon With Data Download PDF. This PPT design covers four stages, thus making it a great tool to use. It also caters to a variety of topics including Website Performance Report Icon With Data. Download this PPT design now to present a convincing pitch that not only emphasizes the topic but also showcases your presentation skills.
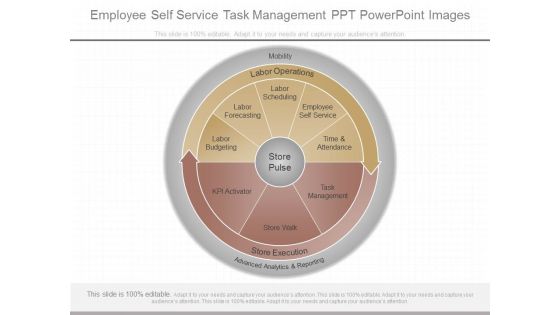
Employee Self Service Task Management Ppt Powerpoint Images
This is a employee self service task management ppt powerpoint images. This is a eight stage process. The stages in this process are labor budgeting, labor forecasting, labor scheduling, employee self service, time and attendance, labor operations, mobility, store pulse, kpi activator, store walk, task management, store execution, advanced analytics and reporting.
Website Data Report Icon With Monthly Traffic Performance Brochure PDF
Persuade your audience using this Website Data Report Icon With Monthly Traffic Performance Brochure PDF. This PPT design covers four stages, thus making it a great tool to use. It also caters to a variety of topics including Website Data Report Icon With Monthly Traffic Performance. Download this PPT design now to present a convincing pitch that not only emphasizes the topic but also showcases your presentation skills.
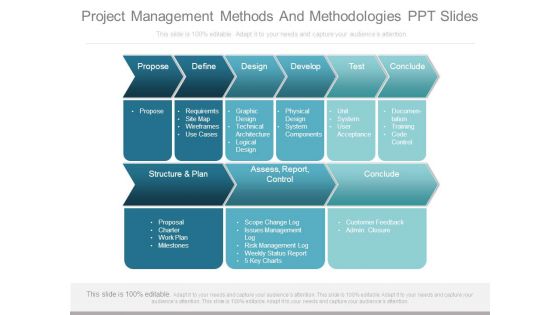
Project Management Methods And Methodologies Ppt Slides
This is a project management methods and methodologies ppt slides. This is a six stage process. The stages in this process are propose, define, design, develop, test, conclude, propose, requirements, site map, wireframes, use cases, graphic design, technical architecture, logical design, physical design, system components, unit, system, user acceptance, documentation, training, code control, structure and plan, assess, report, control, conclude, proposal, charter, work plan, milestones, scope change log, issues management log, risk management log, weekly status report, 5 key charts, customer feedback, admin closure.

Data Warehousing Opportunities Diagram Ppt Powerpoint Slides
This is a data warehousing opportunities diagram ppt powerpoint slides. This is a eight stage process. The stages in this process are inventory, payroll, sales, ledger general, production, reporting, analytics, data mining.
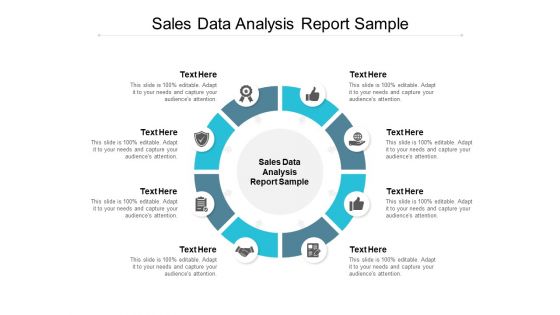
Sales Data Analysis Report Sample Ppt PowerPoint Presentation Summary Example Cpb
Presenting this set of slides with name sales data analysis report sample ppt powerpoint presentation summary example cpb. This is an editable Powerpoint eight stages graphic that deals with topics like sales data analysis report sample to help convey your message better graphically. This product is a premium product available for immediate download and is 100 percent editable in Powerpoint. Download this now and use it in your presentations to impress your audience.
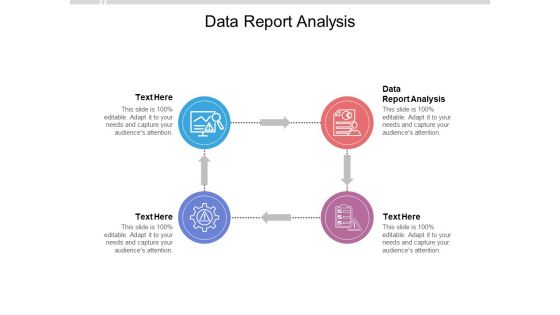
Data Report Analysis Ppt PowerPoint Presentation Inspiration Graphics Download Cpb Pdf
Presenting this set of slides with name data report analysis ppt powerpoint presentation inspiration graphics download cpb pdf. This is an editable Powerpoint four stages graphic that deals with topics like data report analysis to help convey your message better graphically. This product is a premium product available for immediate download and is 100 percent editable in Powerpoint. Download this now and use it in your presentations to impress your audience.

Improve Social Networking Skills Diagram Ppt Presentation Idea
This is a improve social networking skills diagram ppt presentation idea. This is a six stage process. The stages in this process are social media intelligence, develop positioning, remember basics, build presence, integrate across firm, web management, content creation, define strategy, measure results, develop relations, create content, optimize content, scheduling and management, strategy and reporting, social media research.

 Home
Home