Business Review Dashboard

Excel Reporting Dashboard Ppt PowerPoint Presentation Inspiration Slide Portrait Cpb
This is a excel reporting dashboard ppt powerpoint presentation inspiration slide portrait cpb. This is a six stage process. The stages in this process are excel reporting dashboard.

Dashboard Reporting Excel Ppt PowerPoint Presentation File Files Cpb
This is a dashboard reporting excel ppt powerpoint presentation file files cpb. This is a four stage process. The stages in this process are dashboard reporting excel.
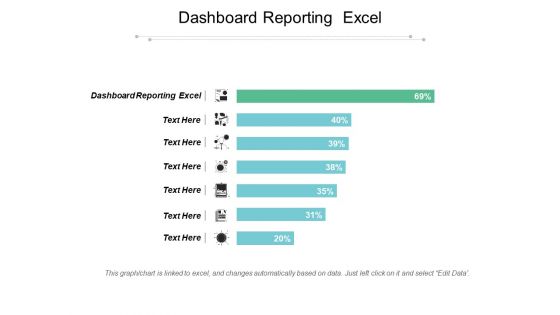
Dashboard Reporting Excel Ppt PowerPoint Presentation Layouts Templates Cpb
This is a dashboard reporting excel ppt powerpoint presentation layouts templates cpb. This is a seven stage process. The stages in this process are dashboard reporting excel.

Quarterly Cost Variance Analysis With Maintenance Metrics Dashboard Information PDF
The following slide depicts a maintenance KPI dashboard to have useful insights for effective decision making. It includes key performance areas such as quarterly cost variance, scrap, quarterly run time variance analysis etc. Pitch your topic with ease and precision using this Quarterly Cost Variance Analysis With Maintenance Metrics Dashboard Information PDF. This layout presents information on Production, Budgeted Cost, Planned Run Time, Actual Run Time. It is also available for immediate download and adjustment. So, changes can be made in the color, design, graphics or any other component to create a unique layout.
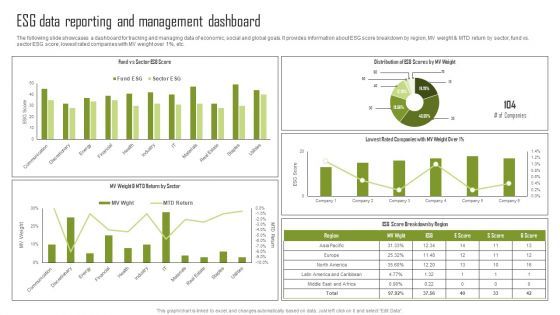
ESG Data Reporting And Management Dashboard Download PDF
The following slide showcases a dashboard for tracking and managing data of economic, social and global goals. It provides information about ESG score breakdown by region, MV weight and MTD return by sector, fund vs. sector ESG score, lowest rated companies with MV weight over 1 percent, etc. Formulating a presentation can take up a lot of effort and time, so the content and message should always be the primary focus. The visuals of the PowerPoint can enhance the presenters message, so our ESG Data Reporting And Management Dashboard Download PDF was created to help save time. Instead of worrying about the design, the presenter can concentrate on the message while our designers work on creating the ideal templates for whatever situation is needed. Slidegeeks has experts for everything from amazing designs to valuable content, we have put everything into ESG Data Reporting And Management Dashboard Download PDF.

Profiling Report Dashboard Depicting Attributes Of Data Quality Themes PDF
This slide shows profiling report dashboard depicting attributes of data quality which can help in accessing the processing speed and yearly analysis of data performance. It contains information about overall score, rows processed, failed rows, comprehensiveness, efficiency, legitimacy, precision, regularity, exceptionality, etc. Pitch your topic with ease and precision using this Profiling Report Dashboard Depicting Attributes Of Data Quality Themes PDF. This layout presents information on Comprehensiveness, Efficiency, Legitimacy, Precision. It is also available for immediate download and adjustment. So, changes can be made in the color, design, graphics or any other component to create a unique layout.

Weekly Assembly Lines Production Report Dashboard Demonstration PDF
This slide illustrates production numbers of the assembly lines of a corporation. It includes total produced units, production scrap, rate of scrap, efficiency, etc.Showcasing this set of slides titled Weekly Assembly Lines Production Report Dashboard Demonstration PDF. The topics addressed in these templates are Total Produced, Production Efficiency, Production Scrap. All the content presented in this PPT design is completely editable. Download it and make adjustments in color, background, font etc. as per your unique business setting.

Workforce Mobility And Stay Report Dashboard Brochure PDF
This slide showcases HR mobility and stay time report summary. It provides information such as time taken to quit job, notice period served, internal mobility, vacancies, etc. Showcasing this set of slides titled Workforce Mobility And Stay Report Dashboard Brochure PDF. The topics addressed in these templates are Management Roles, Internal Recruitment, Workforce Mobility. All the content presented in this PPT design is completely editable. Download it and make adjustments in color, background, font etc. as per your unique business setting.
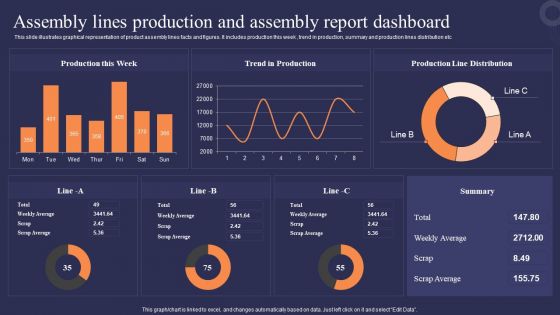
Assembly Lines Production And Assembly Report Dashboard Microsoft PDF
This slide illustrates graphical representation of product assembly lines facts and figures. It includes production this week , trend in production, summary and production lines distribution etc.Showcasing this set of slides titled Assembly Lines Production And Assembly Report Dashboard Microsoft PDF. The topics addressed in these templates are Production, Trend Production, Production Distribution. All the content presented in this PPT design is completely editable. Download it and make adjustments in color, background, font etc. as per your unique business setting.

Email Marketing Digital Promotion Success Evaluation Dashboard Sample PDF
The slide demonstrates a dashboard to evaluate the success of marketing campaign for updating the strategies. Various KPIs included are average open rate per month, average click-through rate per month, average revenue on email per month, etc. Pitch your topic with ease and precision using this Email Marketing Digital Promotion Success Evaluation Dashboard Sample PDF. This layout presents information on Open Rate Per Month, Order Placed Per Month. It is also available for immediate download and adjustment. So, changes can be made in the color, design, graphics or any other component to create a unique layout.
Centralized Repository Data Lake Reporting Dashboard Icons PDF
This slide represents the data lake reporting dashboard by covering the total number of users, total lake size, trusted zone size, conversion rate, and retention. Find a pre designed and impeccable Centralized Repository Data Lake Reporting Dashboard Icons PDF. The templates can ace your presentation without additional effort. You can download these easy to edit presentation templates to make your presentation stand out from others. So, what are you waiting for Download the template from Slidegeeks today and give a unique touch to your presentation.
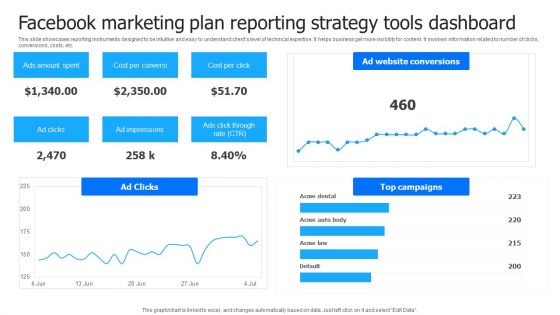
Facebook Marketing Plan Reporting Strategy Tools Dashboard Information PDF
This slide showcases reporting instruments designed to be intuitive and easy to understand clients level of technical expertise. It helps business get more visibility for content. It involves information related to number of clicks, conversions, costs, etc. Showcasing this set of slides titled Facebook Marketing Plan Reporting Strategy Tools Dashboard Information PDF Elements. The topics addressed in these templates are Ads Amount Spent, Cost Per Conversion, Cost Per Click. All the content presented in this PPT design is completely editable. Download it and make adjustments in color, background, font etc. as per your unique business setting.
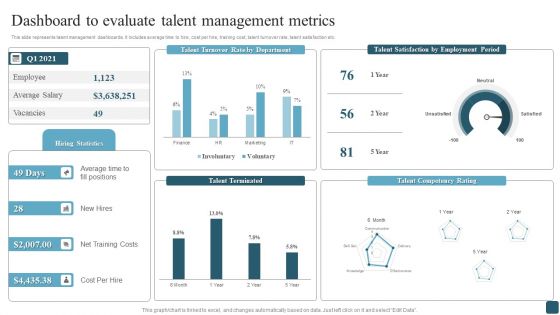
Dashboard To Evaluate Talent Management Metrics Professional PDF
This slide represents talent management dashboards. It includes average time to hire, cost per hire, training cost, talent turnover rate, talent satisfaction etc. Whether you have daily or monthly meetings, a brilliant presentation is necessary. Dashboard To Evaluate Talent Management Metrics Professional PDF can be your best option for delivering a presentation. Represent everything in detail using Dashboard To Evaluate Talent Management Metrics Professional PDF and make yourself stand out in meetings. The template is versatile and follows a structure that will cater to your requirements. All the templates prepared by Slidegeeks are easy to download and edit. Our research experts have taken care of the corporate themes as well. So, give it a try and see the results.

Staff Turnover Key Performance Indicators Dashboard Sample PDF
The following slide highlights the staff turnover key performance Indicators dashboard illustrating employee turn over, turn over rate, average tenure, turnover per quarter, turnover per department, turnover type, turnover time period, turnover per position and turnover reasons Deliver and pitch your topic in the best possible manner with this Staff Turnover Key Performance Indicators Dashboard Sample PDF Use them to share invaluable insights on Management Goals, Subjective Appraisal, Product Defects and impress your audience. This template can be altered and modified as per your expectations. So, grab it now.
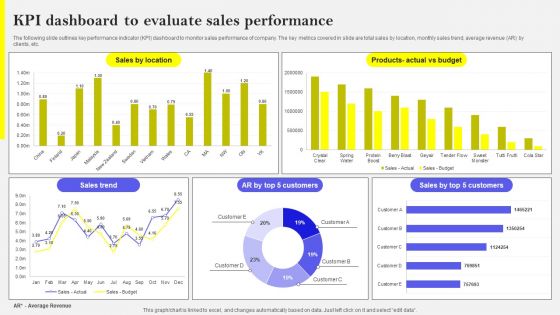
KPI Dashboard To Evaluate Sales Performance Template PDF
The following slide outlines key performance indicator KPI dashboard to monitor sales performance of company. The key metrics covered in slide are total sales by location, monthly sales trend, average revenue AR by clients, etc. Welcome to our selection of the KPI Dashboard To Evaluate Sales Performance Template PDF. These are designed to help you showcase your creativity and bring your sphere to life. Planning and Innovation are essential for any business that is just starting out. This collection contains the designs that you need for your everyday presentations. All of our PowerPoints are 100 percent editable, so you can customize them to suit your needs. This multi-purpose template can be used in various situations. Grab these presentation templates today
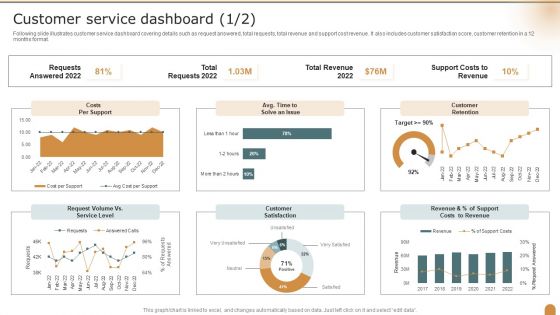
Customer Service Dashboard Company Performance Evaluation Using KPI Themes PDF
Following slide illustrates customer service dashboard covering details such as request answered, total requests, total revenue and support cost revenue. It also includes customer satisfaction score, customer retention in a 12 months format. Deliver and pitch your topic in the best possible manner with this Customer Service Dashboard Company Performance Evaluation Using KPI Themes PDF. Use them to share invaluable insights on Requests Answered, Total Revenue, Customer Retention and impress your audience. This template can be altered and modified as per your expectations. So, grab it now.
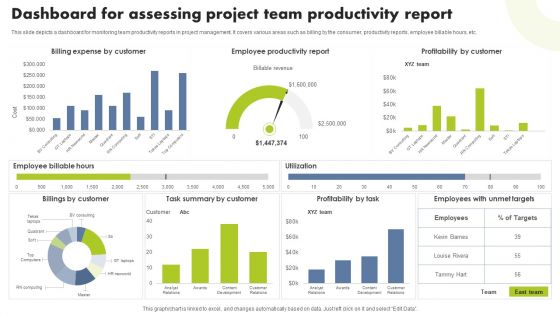
Dashboard For Assessing Project Team Productivity Report Mockup PDF
This slide depicts a dashboard for monitoring team productivity reports in project management. It covers various areas such as billing by the consumer, productivity reports, employee billable hours, etc. Pitch your topic with ease and precision using this Dashboard For Assessing Project Team Productivity Report Mockup PDF. This layout presents information on Billing Expense Customer, Employee Productivity Report, Profitability Customer. It is also available for immediate download and adjustment. So, changes can be made in the color, design, graphics or any other component to create a unique layout.
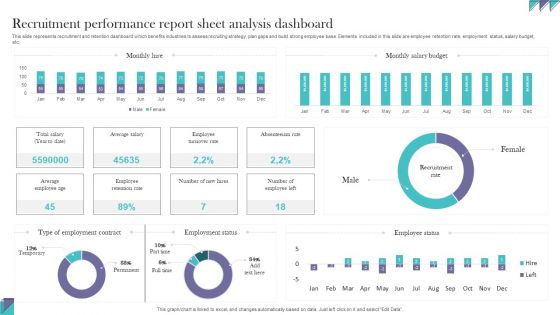
Recruitment Performance Report Sheet Analysis Dashboard Information PDF
This slide represents recruitment and retention dashboard which benefits industries to assess recruiting strategy, plan gaps and build strong employee base. Elements included in this slide are employee retention rate, employment status, salary budget, etc. Pitch your topic with ease and precision using this Recruitment Performance Report Sheet Analysis Dashboard Information PDF. This layout presents information onRecruitment Performance, Report Sheet Analysis. It is also available for immediate download and adjustment. So, changes can be made in the color, design, graphics or any other component to create a unique layout.
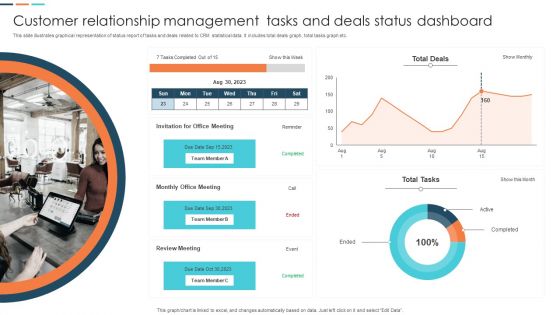
Customer Relationship Management Tasks And Deals Status Dashboard Background PDF
This slide illustrates graphical representation of status report of tasks and deals related to CRM statistical data. It includes total deals graph, total tasks graph etc. Showcasing this set of slides titled Customer Relationship Management Tasks And Deals Status Dashboard Background PDF. The topics addressed in these templates are Invitation, Team Member, Customer Relationship Management. All the content presented in this PPT design is completely editable. Download it and make adjustments in color, background, font etc. as per your unique business setting.

Project Management And Execution Status Dashboard Infographics PDF
This slide illustrates facts and figures related to project implementation status. It includes milestones, achievements, time spent, overall costs, team workload etc.Showcasing this set of slides titled Project Management And Execution Status Dashboard Infographics PDF. The topics addressed in these templates are Achievement, Team Workload, Overall Cost. All the content presented in this PPT design is completely editable. Download it and make adjustments in color, background, font etc. as per your unique business setting.
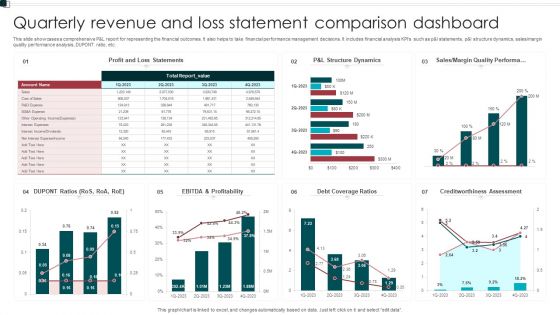
Quarterly Revenue And Loss Statement Comparison Dashboard Portrait PDF
This slide showcases a comprehensive P and L report for representing the financial outcomes. It also helps to take financial performance management decisions. It includes financial analysis KPIs such as p and l statements, p and l structure dynamics, sales or margin quality performance analysis, DUPONT ratio, etc. Showcasing this set of slides titled Quarterly Revenue And Loss Statement Comparison Dashboard Portrait PDF. The topics addressed in these templates are Profitability, Debt Coverage Ratios, Margin Quality Performa. All the content presented in this PPT design is completely editable. Download it and make adjustments in color, background, font etc. as per your unique business setting.
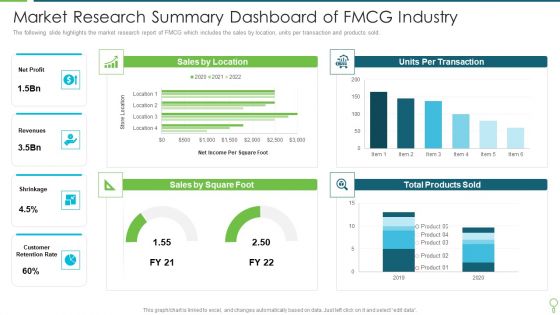
Market Research Summary Dashboard Of Fmcg Industry Pictures PDF
The following slide highlights the market research report of FMCG which includes the sales by location, units per transaction and products sold. Showcasing this set of slides titled Market Research Summary Dashboard Of Fmcg Industry Pictures PDF. The topics addressed in these templates are Revenues, Net Profit, Sales. All the content presented in this PPT design is completely editable. Download it and make adjustments in color, background, font etc. as per your unique business setting.
Social Media Performance Analytics Dashboard Ppt Styles Icons PDF
Following slide exhibits social media management statistics with website report. It includes multiple KPIs such as website traffic, followers on multiple social media platforms and site revenue. Showcasing this set of slides titled social media performance analytics dashboard ppt styles icons pdf. The topics addressed in these templates are site revenue, website traffic. All the content presented in this PPT design is completely editable. Download it and make adjustments in color, background, font etc. as per your unique business setting.
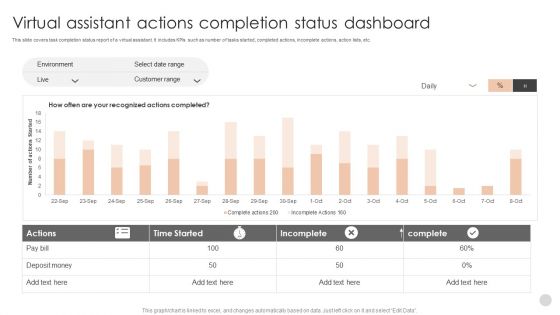
Virtual Assistant Actions Completion Status Dashboard Elements PDF
This slide covers task completion status report of a virtual assistant. It includes KPIs such as number of tasks started, completed actions, incomplete actions, action lists, etc.Showcasing this set of slides titled Virtual Assistant Actions Completion Status Dashboard Elements PDF. The topics addressed in these templates are Customer Range, Time Started, Incomplete. All the content presented in this PPT design is completely editable. Download it and make adjustments in color, background, font etc. as per your unique business setting.

Credit Risk Assessment Dashboard Regulatory Parameters Microsoft PDF
This slide involves key parameters for assessing financial credit status of organization covering regulatory parameters, credit ratings and trend report etc.Showcasing this set of slides titled Credit Risk Assessment Dashboard Regulatory Parameters Microsoft PDF The topics addressed in these templates are Regulatory Parameters, Exposure By Credit Rating, Exposure By Sectors All the content presented in this PPT design is completely editable. Download it and make adjustments in color, background, font etc. as per your unique business setting.

Workplace Work Stress And Absenteeism Dashboard Pictures PDF
This slide illustrates facts and figures related to work stress ang high absenteeism rate. It includes top 3 workplace issues, average workdays missed, etc.Showcasing this set of slides titled Workplace Work Stress And Absenteeism Dashboard Pictures PDF. The topics addressed in these templates are Employees Reported, Workplace Issues, Highest Absenteeism. All the content presented in this PPT design is completely editable. Download it and make adjustments in color, background, font etc. as per your unique business setting.

Quarterly Sales Performance Action Plan Dashboard Mockup PDF
This slide elaborated about he overall quarterly sales details and the target goal projections that has to be achieved within a stipulated time. Pitch your topic with ease and precision using this Quarterly Sales Performance Action Plan Dashboard Mockup PDF. This layout presents information on Sales, Target, Goal. It is also available for immediate download and adjustment. So, changes can be made in the color, design, graphics or any other component to create a unique layout.
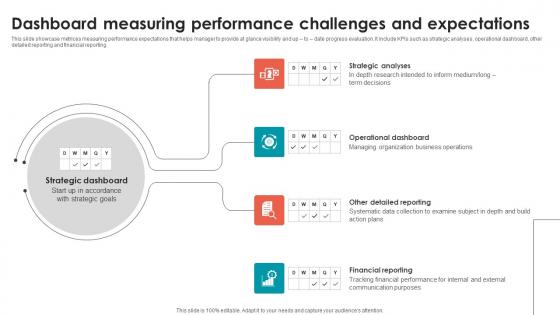
Dashboard Measuring Performance Challenges And Expectations Portrait Pdf
This slide showcase metrices measuring performance expectations that helps manager to provide at glance visibility and up to date progress evaluation. It include KPIs such as strategic analyses, operational dashboard, other detailed reporting and financial reporting. Showcasing this set of slides titled Dashboard Measuring Performance Challenges And Expectations Portrait Pdf. The topics addressed in these templates are Operational Dashboard, Strategic Analyses, Financial Reporting. All the content presented in this PPT design is completely editable. Download it and make adjustments in color, background, font etc. as per your unique business setting.
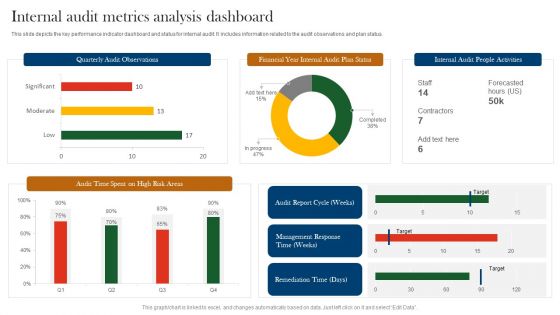
Internal Audit Metrics Analysis Dashboard Ppt Ideas Clipart Images PDF
This slide depicts the key performance indicator dashboard and status for internal audit. It includes information related to the audit observations and plan status. Pitch your topic with ease and precision using this Internal Audit Metrics Analysis Dashboard Ppt Ideas Clipart Images PDF. This layout presents information on Quarterly Audit Observations, Financial Year Internal, Audit Plan Status. It is also available for immediate download and adjustment. So, changes can be made in the color, design, graphics or any other component to create a unique layout.
Plan Dashboard For Tracking Location Wise Revenue Diagrams PDF
This slide presents a dashboard which will assist managers to track the revenue of each branch having geographical presence in different corners of the world. The key performance indicators are total revenue, location wise rent, branch performance among many others.Pitch your topic with ease and precision using this Plan Dashboard For Tracking Location Wise Revenue Diagrams PDF. This layout presents information on Taxes Paid, Current Month, Branch Performance, Previous Quarter. It is also available for immediate download and adjustment. So, changes can be made in the color, design, graphics or any other component to create a unique layout.
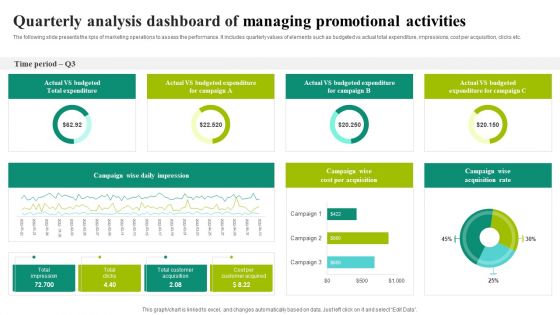
Quarterly Analysis Dashboard Of Managing Promotional Activities Ideas PDF
The following slide presents the kpis of marketing operations to assess the performance. It includes quarterly values of elements such as budgeted vs actual total expenditure, impressions, cost per acquisition, clicks etc. Showcasing this set of slides titled Quarterly Analysis Dashboard Of Managing Promotional Activities Ideas PDF. The topics addressed in these templates are Campaign Wise, Daily Impression, Total Impression, Total Clicks. All the content presented in this PPT design is completely editable. Download it and make adjustments in color, background, font etc. as per your unique business setting.

Call Center Kpis Dashboard With Data Management Infographics PDF
This slide covers contact center metrics KPI dashboard with call data details. It involves details such as total number of contacts handled, product sales, repeated calls and contact handles per day. Pitch your topic with ease and precision using this Call Center Kpis Dashboard With Data Management Infographics PDF. This layout presents information on Achieved, Contacts Handled, Repeated Calls. It is also available for immediate download and adjustment. So, changes can be made in the color, design, graphics or any other component to create a unique layout.

Information Technology Firm Report Example Companys Financials Dashboard Designs PDF
Deliver an awe inspiring pitch with this creative Information Technology Firm Report Example Companys Financials Dashboard Designs PDF bundle. Topics like Gross Profit, Operating Profit, Profit Margin can be discussed with this completely editable template. It is available for immediate download depending on the needs and requirements of the user.
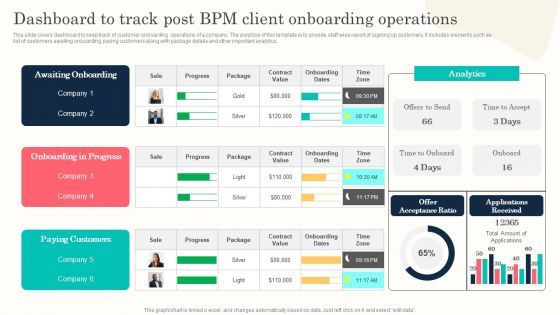
Dashboard To Track Post BPM Client Onboarding Operations Professional PDF
This slide covers dashboard to keep track of customer onboarding operations of a company. The purpose of this template is to provide staff wise report of signing up customers. It includes elements such as list of customers awaiting onboarding, paying customers along with package details and other important analytics. Do you have to make sure that everyone on your team knows about any specific topic I yes, then you should give Dashboard To Track Post BPM Client Onboarding Operations Professional PDF a try. Our experts have put a lot of knowledge and effort into creating this impeccable Dashboard To Track Post BPM Client Onboarding Operations Professional PDF. You can use this template for your upcoming presentations, as the slides are perfect to represent even the tiniest detail. You can download these templates from the Slidegeeks website and these are easy to edit. So grab these today.
Crisis Management Incident Reporting Dashboard Ppt Icon File Formats PDF
Deliver and pitch your topic in the best possible manner with this crisis management incident reporting dashboard ppt icon file formats pdf. Use them to share invaluable insights on new incidents this month, total near miss incidents, total outstanding incidents, total incidents and impress your audience. This template can be altered and modified as per your expectations. So, grab it now.

Health And Risk KPI Dashboard Ppt Pictures Designs Download PDF
The slide highlights the health and safety key performance indicator dashboard illustrating key headings which includes key objectives, inspections, total reports vs over due reports, injuries by body part and accident trends. Pitch your topic with ease and precision using this Health And Risk KPI Dashboard Ppt Pictures Designs Download PDF. This layout presents information on Key Objectives, Inspections, Accidents Trends. It is also available for immediate download and adjustment. So, changes can be made in the color, design, graphics or any other component to create a unique layout.
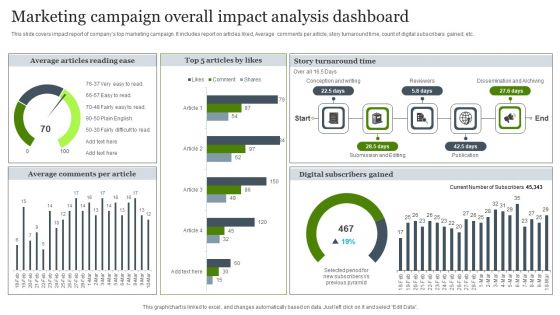
Marketing Campaign Overall Impact Analysis Dashboard Brochure PDF
This slide covers impact report of companys top marketing campaign. It includes report on articles liked, Average comments per article, story turnaround time, count of digital subscribers gained, etc. Pitch your topic with ease and precision using this Marketing Campaign Overall Impact Analysis Dashboard Brochure PDF. This layout presents information on Marketing Campaign, Overall Impact Analysis Dashboard. It is also available for immediate download and adjustment. So, changes can be made in the color, design, graphics or any other component to create a unique layout.

Progress Summary Dashboard For Monitoring Project Kpis Infographics PDF
The following slide showcases progress reporting dashboard for clients to stay informed about changes, schedules and budgets. It presents information related to work items, tasks late, issues red, etc. Pitch your topic with ease and precision using this Progress Summary Dashboard For Monitoring Project Kpis Infographics PDF. This layout presents information on Project Status, Project Manager, Project Type, Percent Complete. It is also available for immediate download and adjustment. So, changes can be made in the color, design, graphics or any other component to create a unique layout.
Performance Tracking Dashboard Effective Strategies For Strengthening Food Ppt Slide
The slide showcases dashboard representing food and beverage business performance tracking tool , which assist to evaluate monthly performance of employees, customer retention etc. Retrieve professionally designed Performance Tracking Dashboard Effective Strategies For Strengthening Food Ppt Slide to effectively convey your message and captivate your listeners. Save time by selecting pre-made slideshows that are appropriate for various topics, from business to educational purposes. These themes come in many different styles, from creative to corporate, and all of them are easily adjustable and can be edited quickly. Access them as PowerPoint templates or as Google Slides themes. You do not have to go on a hunt for the perfect presentation because Slidegeeks got you covered from everywhere.
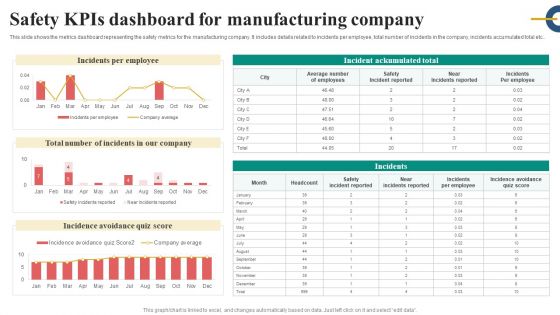
Safety Kpis Dashboard For Manufacturing Company Slides PDF
This slide shows the metrics dashboard representing the safety metrics for the manufacturing company. It includes details related to incidents per employee, total number of incidents in the company, incidents accumulated total etc.. Pitch your topic with ease and precision using this Safety Kpis Dashboard For Manufacturing Company Slides PDF. This layout presents information on Incidents Per Employee, Safety Incident Reported, Incidence Avoidance Quiz Score. It is also available for immediate download and adjustment. So, changes can be made in the color, design, graphics or any other component to create a unique layout.
Tracking Goals Dashboard With Progress Report Rules PDF
This slide showcases the progress report which helps to determine gaps in the objective achievement process and take corrective actions. It also includes objective details such as contributor, due date, and progress percentage. Showcasing this set of slides titled Tracking Goals Dashboard With Progress Report Rules PDF. The topics addressed in these templates are Immediate Action Required, Progress Update Required, Concise Goal Outcome Required. All the content presented in this PPT design is completely editable. Download it and make adjustments in color, background, font etc. as per your unique business setting.
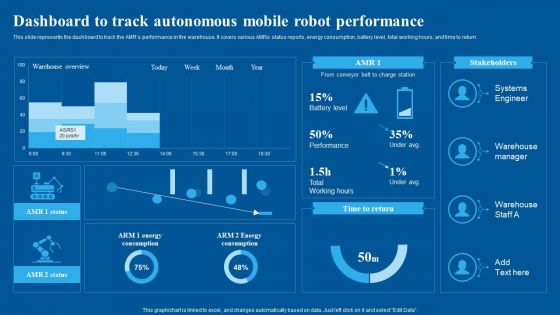
Dashboard To Track Autonomous Mobile Robot Performance Infographics PDF
This slide represents the dashboard to track the AMRs performance in the warehouse. It covers various AMRs status reports, energy consumption, battery level, total working hours, and time to return. Take your projects to the next level with our ultimate collection of Dashboard To Track Autonomous Mobile Robot Performance Infographics PDF. Slidegeeks has designed a range of layouts that are perfect for representing task or activity duration, keeping track of all your deadlines at a glance. Tailor these designs to your exact needs and give them a truly corporate look with your own brand colors they will make your projects stand out from the rest.
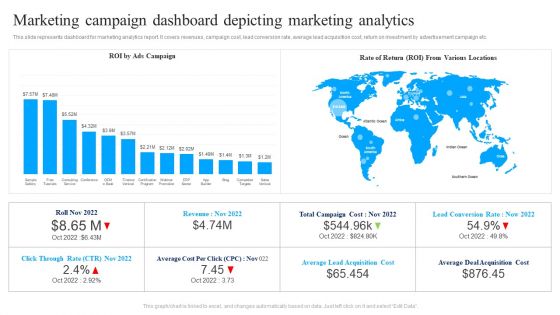
Marketing Campaign Dashboard Depicting Marketing Analytics Ppt Summary Infographics PDF
This slide represents dashboard for marketing analytics report. It covers revenues, campaign cost, lead conversion rate, average lead acquisition cost, return on investment by advertisement campaign etc. Pitch your topic with ease and precision using this Marketing Campaign Dashboard Depicting Marketing Analytics Ppt Summary Infographics PDF. This layout presents information on ROI Ads Campaign, Rate Of Return, Various Locations. It is also available for immediate download and adjustment. So, changes can be made in the color, design, graphics or any other component to create a unique layout.
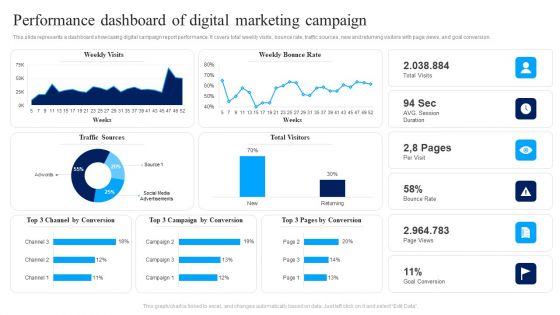
Performance Dashboard Of Digital Marketing Campaign Ppt Show Slide PDF
This slide represents a dashboard showcasing digital campaign report performance. It covers total weekly visits, bounce rate, traffic sources, new and returning visitors with page views, and goal conversion. Pitch your topic with ease and precision using this Performance Dashboard Of Digital Marketing Campaign Ppt Show Slide PDF. This layout presents information on Weekly Visits, Weekly Bounce Rate, Bounce Rate. It is also available for immediate download and adjustment. So, changes can be made in the color, design, graphics or any other component to create a unique layout.

Financial KPI Report Dashboard For Investment Bank Structure Pdf
This slide shows KPI dashboard to assist investor in analyzing financial report of investment bank. It includes current assets, current liabilities, cash conversion cycle, vendor payment system etc. Showcasing this set of slides titled Financial KPI Report Dashboard For Investment Bank Structure Pdf. The topics addressed in these templates are Current Working Capital, Cash Conversion Cycle Days, Vendor Payment Error Rate. All the content presented in this PPT design is completely editable. Download it and make adjustments in color, background, font etc. as per your unique business setting.

Project Metrics Dashboard With Task Status Rules PDF
This slide shows the project management dashboard which shows the number of team members of managing project activities, estimated and actual time to complete the project task, hours taken by employees with achieved and open milestones and progress status. Pitch your topic with ease and precision using this Project Metrics Dashboard With Task Status Rules PDF. This layout presents information on Team Members, Employee. It is also available for immediate download and adjustment. So, changes can be made in the color, design, graphics or any other component to create a unique layout.

Monitoring Calendar Performance Index KPI Dashboard Slides PDF
This slide depicts the SPI indicator dashboard for identifying problem areas at any level of the project. It also includes a section for project schedule, chart for earned and planned performance comparison, schedule performance index graph, progress summary table, milestones achieved, etc. Pitch your topic with ease and precision using this Monitoring Calendar Performance Index KPI Dashboard Slides PDF. This layout presents information on Current Budget, Planned Value, Earned Value. It is also available for immediate download and adjustment. So, changes can be made in the color, design, graphics or any other component to create a unique layout.
Project Tracking Bug And Progress Tracker Dashboard Elements PDF
The following slide showcases the progress status of project tracking activities to achieve objectives. It constitutes of elements such as number of projects, features, work items, number of bugs along with the progress status etc. Pitch your topic with ease and precision using this Project Tracking Bug And Progress Tracker Dashboard Elements PDF. This layout presents information on Project Tracking, Progress Tracker Dashboard. It is also available for immediate download and adjustment. So, changes can be made in the color, design, graphics or any other component to create a unique layout.
Multi Channel Marketing Strategies Performance Tracking Dashboard Elements PDF
This slide covers dashboard to track achievements of various communication channel. It includes elements such as revenue, sessions, costs, CTR. ROAS. It also includes communication channels such as Instagram, Facebook, Google Ads, Pinterest and Twitter. Pitch your topic with ease and precision using this Multi Channel Marketing Strategies Performance Tracking Dashboard Elements PDF. This layout presents information on Channel Grouping, Revenue Cost Date, Sessions. It is also available for immediate download and adjustment. So, changes can be made in the color, design, graphics or any other component to create a unique layout.
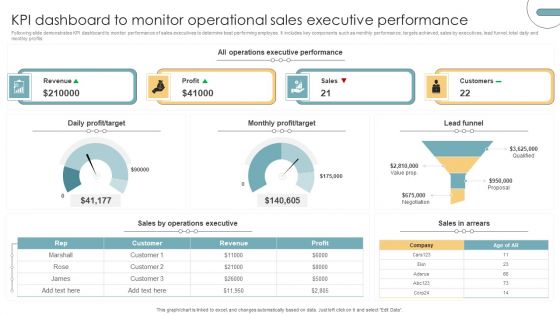
KPI Dashboard To Monitor Operational Sales Executive Performance Portrait PDF
Following slide demonstrates KPI dashboard to monitor performance of sales executives to determine best performing employee. It includes key components such as monthly performance, targets achieved, sales by executives, lead funnel, total daily and monthly profits. Pitch your topic with ease and precision using this KPI Dashboard To Monitor Operational Sales Executive Performance Portrait PDF. This layout presents information on Revenue, Profit, Sales, Customers. It is also available for immediate download and adjustment. So, changes can be made in the color, design, graphics or any other component to create a unique layout.

Pricing Benchmarks Analysis Dashboard For Manufacturing Company Structure PDF
This slide represents the price benchmarking comparison report of manufacturing company. It includes information related to gross and profit margin and revenue growth of all organizations along with graph showing benchmark index comparison from industry average. Pitch your topic with ease and precision using this Pricing Benchmarks Analysis Dashboard For Manufacturing Company Structure PDF. This layout presents information on Pricing Benchmarks Analysis, Dashboard For Manufacturing Company. It is also available for immediate download and adjustment. So, changes can be made in the color, design, graphics or any other component to create a unique layout.

Dashboard For Monthly Procurement Process Automated Workflow Brochure PDF
This slide presents a dashboard for monthly procurement activities in an organization. It includes number of suppliers, contract attainted, supplier share, top supplier report, average procurement cycle time, etc. Want to ace your presentation in front of a live audience Our Dashboard For Monthly Procurement Process Automated Workflow Brochure PDF can help you do that by engaging all the users towards you. Slidegeeks experts have put their efforts and expertise into creating these impeccable powerpoint presentations so that you can communicate your ideas clearly. Moreover, all the templates are customizable, and easy to edit and downloadable. Use these for both personal and commercial use.
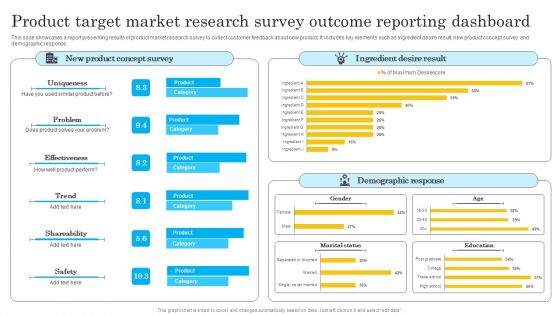
Product Target Market Research Survey Outcome Reporting Dashboard Portrait PDF
This slide showcases a report presenting results of product market research survey to collect customer feedback about new product. It includes key elements such as ingredient desire result, new product concept survey and demographic response. Showcasing this set of slides titled Product Target Market Research Survey Outcome Reporting Dashboard Portrait PDF. The topics addressed in these templates are Uniqueness, Problem, Effectiveness. All the content presented in this PPT design is completely editable. Download it and make adjustments in color, background, font etc. as per your unique business setting.

Website Internal Link Analysis Dashboard Ppt Inspiration Outline PDF
This slide showcases dashboard for website Analysis that can help to identify the reasons and errors for decline in website speed and performance. Its key elements are site health, crawled pages and thematic reports. Pitch your topic with ease and precision using this Website Internal Link Analysis Dashboard Ppt Inspiration Outline PDF. This layout presents information on Success, Incoming Internal Followed Link, Link Score. It is also available for immediate download and adjustment. So, changes can be made in the color, design, graphics or any other component to create a unique layout.
Workforce Productivity Tracking Report Kpi Dashboard Icons PDF
The following slide presents the KPAs of project work stream for transparency and better decision making. It includes KPIs such as work stream status, priority check, planned vs actual budget etc. Showcasing this set of slides titled Workforce Productivity Tracking Report Kpi Dashboard Icons PDF. The topics addressed in these templates are Initiation Meeting, Resource Assessment, Technological Analysis. All the content presented in this PPT design is completely editable. Download it and make adjustments in color, background, font etc. as per your unique business setting.

Customer Relationship Management Procedure CRM Application Dashboard Marketing Graphics PDF
Deliver and pitch your topic in the best possible manner with this customer relationship management procedure CRM application dashboard marketing graphics pdf. Use them to share invaluable insights on marketing funnel, opportunity generation by quarter, days performance, new opportunities, active prospects and impress your audience. This template can be altered and modified as per your expectations. So, grab it now.

Monthly Marketing Program Dashboard Report Ppt Inspiration Information PDF
This graph or chart is linked to excel, and changes automatically based on data. Just left click on it and select Edit Data. Pitch your topic with ease and precision using this Monthly Marketing Program Dashboard Report Ppt Inspiration Information PDF. This layout presents information on Rankings, Traffic, Site Audit, Warnings. It is also available for immediate download and adjustment. So, changes can be made in the color, design, graphics or any other component to create a unique layout.
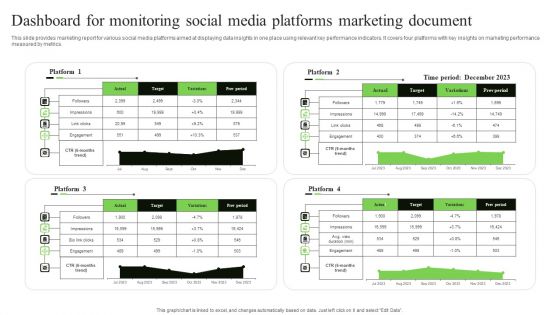
Dashboard For Monitoring Social Media Platforms Marketing Document Slides PDF
This slide provides marketing report for various social media platforms aimed at displaying data insights in one place using relevant key performance indicators. It covers four platforms with key insights on marketing performance measured by metrics. Showcasing this set of slides titled Dashboard For Monitoring Social Media Platforms Marketing Document Slides PDF. The topics addressed in these templates are Impressions, Engagement, Target. All the content presented in this PPT design is completely editable. Download it and make adjustments in color, background, font etc. as per your unique business setting.

Product Advertisement Marketing Campaign Dashboard Ppt Infographic Template Show PDF
This slide represents the product advertising campaign report. It covers advertisement costs, conversions, clicks, cost per conversion, impressions with clicks, and conversions by the campaign. Showcasing this set of slides titled Product Advertisement Marketing Campaign Dashboard Ppt Infographic Template Show PDF. The topics addressed in these templates are Ads Clicks, Ads Conversions, Conversion Through Advertisement, Advertisement Cost. All the content presented in this PPT design is completely editable. Download it and make adjustments in color, background, font etc. as per your unique business setting.

Crisis Management Program Presentation Incident Reporting Dashboard Assignee Microsoft PDF
The firm will track the various incidents issues faced and resolved in the firm. Deliver an awe-inspiring pitch with this creative crisis management program presentation incident reporting dashboard assignee microsoft pdf bundle. Topics like tickets resolved assignee, tickets resolved without assignee, tickets resolved can be discussed with this completely editable template. It is available for immediate download depending on the needs and requirements of the user.

 Home
Home