Business Case

Administering Quality Assurance Introduction Of Control Charts For Project Quality Management PM SS V
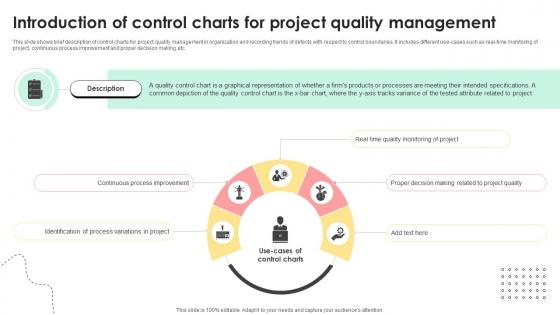
This slide shows brief description of control charts for project quality management in organization and recording trends of defects with respect to control boundaries. It includes different use-cases such as real-time monitoring of project, continuous process improvement and proper decision making, etc. Coming up with a presentation necessitates that the majority of the effort goes into the content and the message you intend to convey. The visuals of a PowerPoint presentation can only be effective if it supplements and supports the story that is being told. Keeping this in mind our experts created Administering Quality Assurance Introduction Of Control Charts For Project Quality Management PM SS V to reduce the time that goes into designing the presentation. This way, you can concentrate on the message while our designers take care of providing you with the right template for the situation.

 Home
Home