Business Analytics
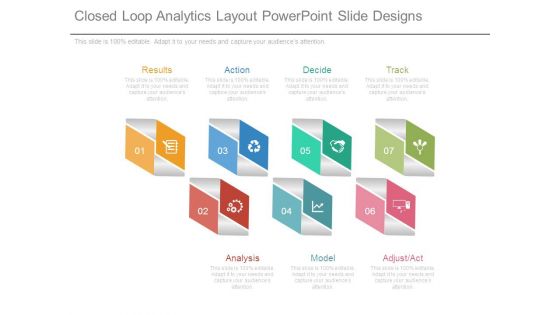
Closed Loop Analytics Layout Powerpoint Slide Designs
This is a closed loop analytics layout powerpoint slide designs. This is a seven stage process. The stages in this process are results, action, decide, track, analysis, model, adjust act.

Marketing Analytics Ppt Template Powerpoint Slide Introduction
This is a marketing analytics ppt template powerpoint slide introduction. This is a six stage process. The stages in this process are reporting intelligence, acquisition, development, pricing strategy, product design, other solution.

Marketing Analytics Technology Template Ppt Sample File
This is a marketing analytics technology template ppt sample file. This is a five stage process. The stages in this process are profile, associate, product design, marketing roi, predict.
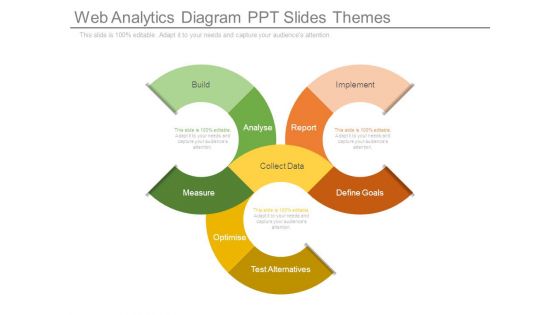
Web Analytics Diagram Ppt Slides Themes
This is a web analytics diagram ppt slides themes. This is a three stage process. The stages in this process are build, analyse, measure, test alternatives, optimise, collect data, define goals, report, implement.
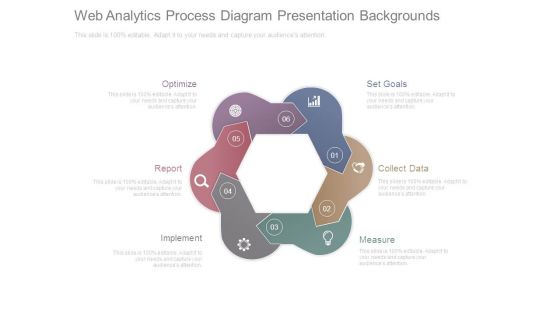
Web Analytics Process Diagram Presentation Backgrounds
This is a web analytics process diagram presentation backgrounds. This is a six stage process. The stages in this process are optimize, report, implement, measure, collect data, set goals.

Effective Marketing Analytics Layout Ppt Slide Design
This is a effective marketing analytics layout ppt slide design. This is a three stage process. The stages in this process are checks and balances, fundamental analysis, trend analysis.

Half Yearly Data Analytics Implementation Roadmap Demonstration
We present our half yearly data analytics implementation roadmap demonstration. This PowerPoint layout is easy-to-edit so you can change the font size, font type, color, and shape conveniently. In addition to this, the PowerPoint layout is Google Slides compatible, so you can share it with your audience and give them access to edit it. Therefore, download and save this well-researched half yearly data analytics implementation roadmap demonstration in different formats like PDF, PNG, and JPG to smoothly execute your business plan.
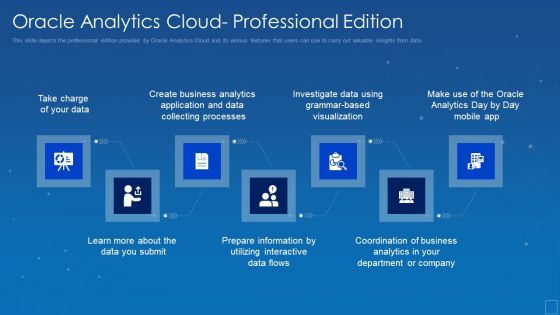
Oracle Analytics Cloud Professional Edition Graphics PDF
This slide defines the collaboration and publishing cloud solution of Oracle Analytics and how it encourages teamwork in the organizations. Presenting oracle analytics cloud professional edition graphics pdf to provide visual cues and insights. Share and navigate important information on seven stages that need your due attention. This template can be used to pitch topics like oracle analytics cloud solutions collaboration and publishing. In addtion, this PPT design contains high resolution images, graphics, etc, that are easily editable and available for immediate download.
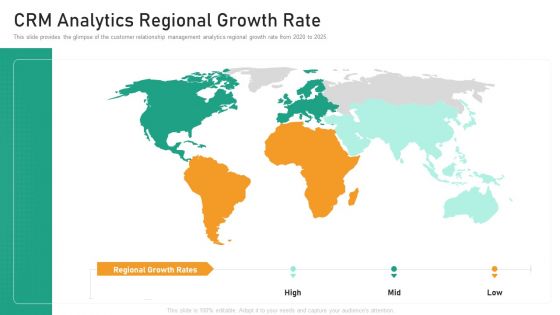
CRM Analytics Regional Growth Rate Diagrams PDF
This slide provides the glimpse of the customer relationship management analytics regional growth rate from 2020 to 2025.This is a crm analytics regional growth rate diagrams pdf template with various stages. Focus and dispense information on three stages using this creative set, that comes with editable features. It contains large content boxes to add your information on topics like crm analytics regional growth rate. You can also showcase facts, figures, and other relevant content using this PPT layout. Grab it now.

Marketing Analytics Diagram Powerpoint Slide Ideas
This is a marketing analytics diagram powerpoint slide ideas. This is a four stage process. The stages in this process are development, other solution, acquisition, retention.
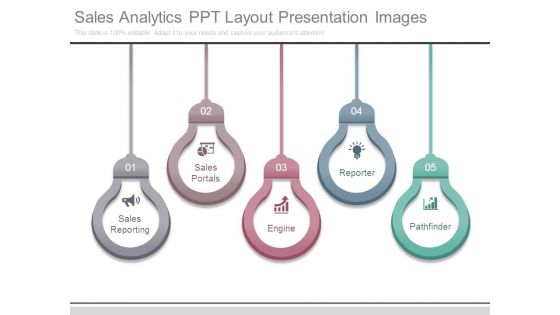
Sales Analytics Ppt Layout Presentation Images
This is a sales analytics ppt layout presentation images. This is a five stage process. The stages in this process are sales reporting, sales portals, engine, reporter, pathfinder.
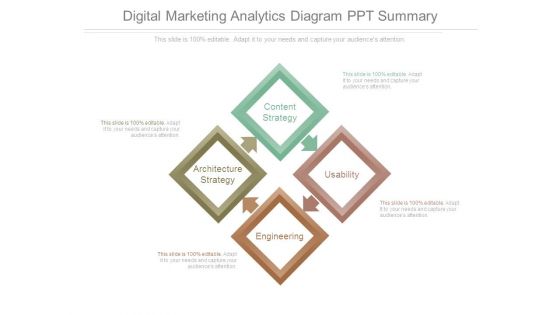
Digital Marketing Analytics Diagram Ppt Summary
This is a digital marketing analytics diagram ppt summary. This is a four stage process. The stages in this process are content strategy, usability, engineering, architecture, strategy.
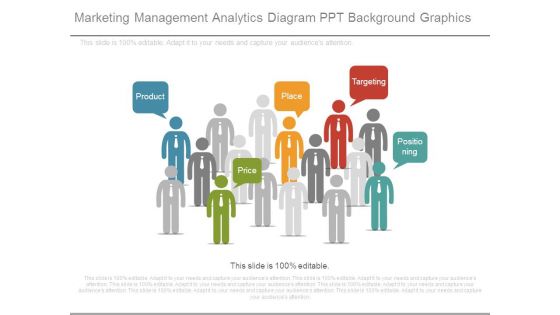
Marketing Management Analytics Diagram Ppt Background Graphics
This is a marketing management analytics diagram ppt background graphics. This is a five stage process. The stages in this process are product, price, place, targeting, positioning.
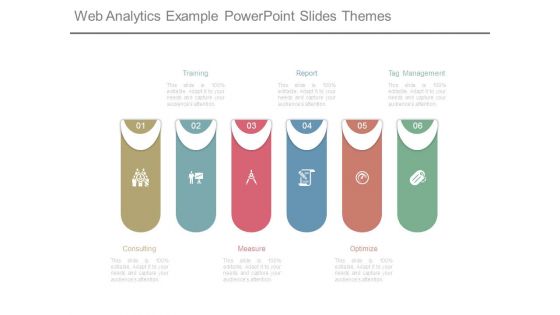
Web Analytics Example Powerpoint Slides Themes
This is a web analytics example powerpoint slides themes. This is a six stage process. The stages in this process are consulting, training, measure, report, optimize, tag management.

Web Analytics Process Framework Presentation Graphics
This is a web analytics process framework presentation graphics. This is a five stage process. The stages in this process are benchmarketing, management, implement, operations, social media.
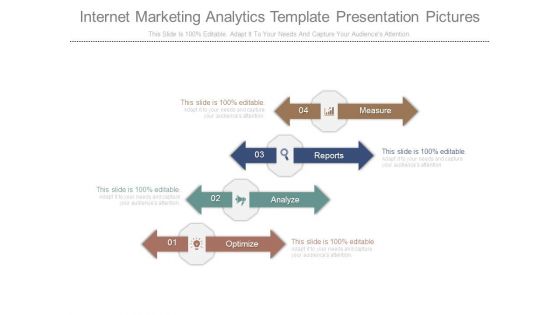
Internet Marketing Analytics Template Presentation Pictures
This is a internet marketing analytics template presentation pictures. This is a four stage process. The stages in this process are measure, reports, analyze, optimize.
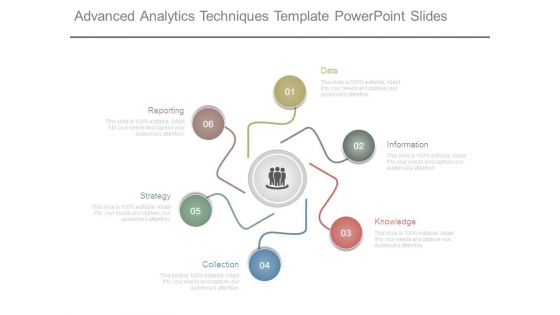
Advanced Analytics Techniques Template Powerpoint Slides
This is a advanced analytics techniques template powerpoint slides. This is a six stage process. The stages in this process are reporting, strategy, collection, knowledge, information, data.
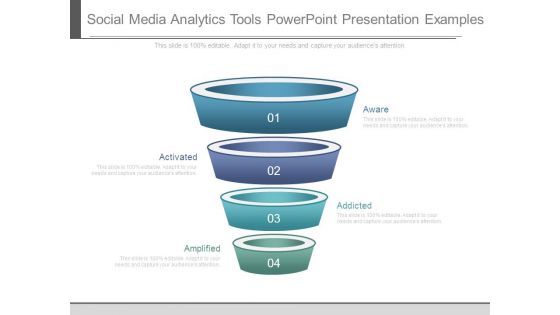
Social Media Analytics Tools Powerpoint Presentation Examples
This is a social media analytics tools powerpoint presentation examples. This is a four stage process. The stages in this process are activated, amplified, aware, addicted.

Bar Chart For Data Analytics Ppt Examples
This is a bar chart for data analytics ppt examples. This is a five stage process. The stages in this process are category.

Data Driven Analytics Chart Powerpoint Presentation Templates
This is a data driven analytics chart powerpoint presentation templates. This is a five stage process. The stages in this process are category.

Data Analytics Bar Chart Ppt Sample Presentations
This is a data analytics bar chart ppt sample presentations. This is a five stage process. The stages in this process are category.

Paid Search Analytics Ppt PowerPoint Presentation Guidelines
This is a paid search analytics ppt powerpoint presentation guidelines. This is a three stage process. The stages in this process are budget, impressions, clicks.
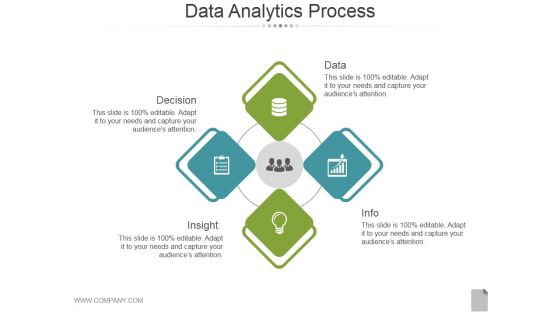
Data Analytics Process Ppt PowerPoint Presentation Inspiration
This is a data analytics process ppt powerpoint presentation inspiration. This is a four stage process. The stages in this process are decision, insight, data, info.
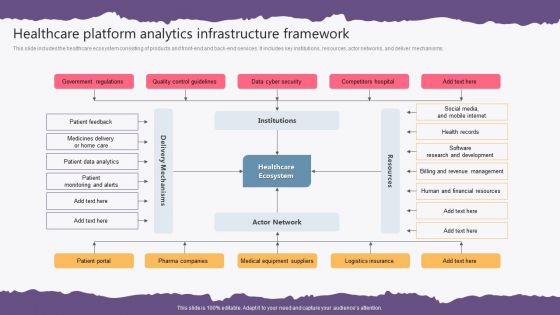
Healthcare Platform Analytics Infrastructure Framework Background PDF
This slide includes the healthcare ecosystem consisting of products and front-end and back-end services. It includes key institutions, resources, actor networks, and deliver mechanisms. Pitch your topic with ease and precision using this Healthcare Platform Analytics Infrastructure Framework Background PDF. This layout presents information on Government Regulations, Quality Control Guidelines, Data Cyber Security, Competitors Hospital. It is also available for immediate download and adjustment. So, changes can be made in the color, design, graphics or any other component to create a unique layout.

Digital Marketing Analytics Infrastructure Framework Elements PDF
This slide includes the digital marketing ecosystem with an analysis and measurement tools that allows the organization to create a digital campaign and improve brand position in the market. It includes key activities, content, and measurement and analysis. Showcasing this set of slides titled Digital Marketing Analytics Infrastructure Framework Elements PDF. The topics addressed in these templates are Key Activities, Content, Measurement And Analysis. All the content presented in this PPT design is completely editable. Download it and make adjustments in color, background, font etc. as per your unique business setting.

Big Data Analytics Job Vacancy Demonstration PDF
Following slide demonstrates buyer persona for recruitment of big data analyst to enhance business productivity and for achieving organisation goals. It includes elements such as job description, qualification, experience, salary, roles and responsibility and skills. Pitch your topic with ease and precision using this Big Data Analytics Job Vacancy Demonstration PDF. This layout presents information on Location, Information, Internal. It is also available for immediate download and adjustment. So, changes can be made in the color, design, graphics or any other component to create a unique layout.

Robust Reporting And Analytics Powerpoint Slides
This is a robust reporting and analytics powerpoint slides. This is a six stage process. The stages in this process are robust reporting and analytics, integration for order info automation, enter order info creases rater, management tools and functionality, customer satisfaction tools, multi enterprise application.
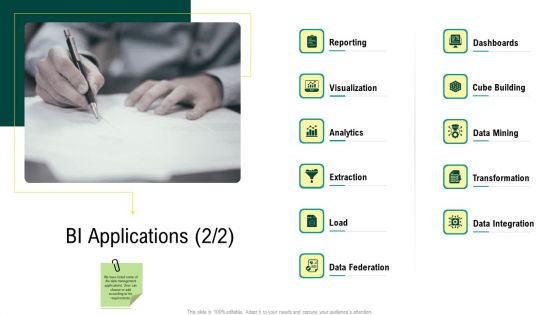
Expert Systems BI Applications Analytics Sample PDF
Presenting expert systems bi applications analytics sample pdf to provide visual cues and insights. Share and navigate important information on elven stages that need your due attention. This template can be used to pitch topics like reporting, visualization, analytics, extraction, data mining, cube building, transformation. In addtion, this PPT design contains high-resolution images, graphics, etc, that are easily editable and available for immediate download.

CRM Analytics Regional Growth Rate Download PDF
This is a crm analytics regional growth rate download pdf template with various stages. Focus and dispense information on three stages using this creative set, that comes with editable features. It contains large content boxes to add your information on topics like crm analytics regional growth rate. You can also showcase facts, figures, and other relevant content using this PPT layout. Grab it now.
Manpower Performance Analytics Dashboard Icon Designs PDF
Persuade your audience using this Manpower Performance Analytics Dashboard Icon Designs PDF. This PPT design covers four stages, thus making it a great tool to use. It also caters to a variety of topics including Manpower Performance, Analytics Dashboard, Icon. Download this PPT design now to present a convincing pitch that not only emphasizes the topic but also showcases your presentation skills.
Predictive Healthcare Data Analytics Icon Summary PDF
Presenting Predictive Healthcare Data Analytics Icon Summary PDF to dispense important information. This template comprises Three stages. It also presents valuable insights into the topics including Predictive Healthcare, Data Analytics Icon. This is a completely customizable PowerPoint theme that can be put to use immediately. So, download it and address the topic impactfully
Personnel Salary Analytics Dashboard Icon Elements PDF
Persuade your audience using this Personnel Salary Analytics Dashboard Icon Elements PDF. This PPT design covers three stages, thus making it a great tool to use. It also caters to a variety of topics including Dashboard Icon, Personnel Salary Analytics. Download this PPT design now to present a convincing pitch that not only emphasizes the topic but also showcases your presentation skills.
Working Capital Growth Analytics Icon Elements PDF
Presenting Working Capital Growth Analytics Icon Elements PDF to dispense important information. This template comprises three stages. It also presents valuable insights into the topics including Working Capital, Growth, Analytics This is a completely customizable PowerPoint theme that can be put to use immediately. So, download it and address the topic impactfully.
Working Capital Investment Analytics Icon Summary PDF
Persuade your audience using this Working Capital Investment Analytics Icon Summary PDF. This PPT design covers three stages, thus making it a great tool to use. It also caters to a variety of topics including Working Capital, Investment, Analytics. Download this PPT design now to present a convincing pitch that not only emphasizes the topic but also showcases your presentation skills.

Overview Of Descriptive Analytics In Developing Strategic Insights Using Big Data Analytics SS V
This slide provides introduction of descriptive analytics used in business for analyzing performance efficiency. It includes elements such as decision making, sales performance, growth opportunities, valuable insights etc. Formulating a presentation can take up a lot of effort and time, so the content and message should always be the primary focus. The visuals of the PowerPoint can enhance the presenters message, so our Overview Of Descriptive Analytics In Developing Strategic Insights Using Big Data Analytics SS V was created to help save time. Instead of worrying about the design, the presenter can concentrate on the message while our designers work on creating the ideal templates for whatever situation is needed. Slidegeeks has experts for everything from amazing designs to valuable content, we have put everything into Overview Of Descriptive Analytics In Developing Strategic Insights Using Big Data Analytics SS V
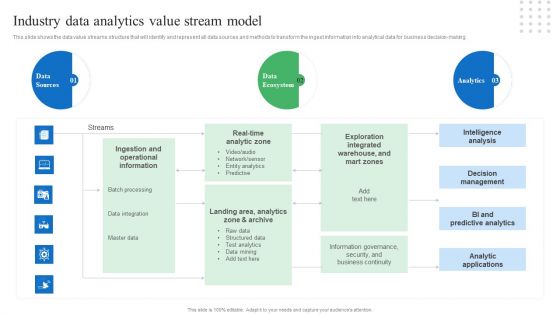
Toolkit For Data Science And Analytics Transition Industry Data Analytics Value Stream Model Brochure PDF
This slide shows the data value streams structure that will identify and represent all data sources and methods to transform the ingest information into analytical data for business decision-making. Whether you have daily or monthly meetings, a brilliant presentation is necessary. Toolkit For Data Science And Analytics Transition Industry Data Analytics Value Stream Model Brochure PDF can be your best option for delivering a presentation. Represent everything in detail using Toolkit For Data Science And Analytics Transition Industry Data Analytics Value Stream Model Brochure PDF and make yourself stand out in meetings. The template is versatile and follows a structure that will cater to your requirements. All the templates prepared by Slidegeeks are easy to download and edit. Our research experts have taken care of the corporate themes as well. So, give it a try and see the results.
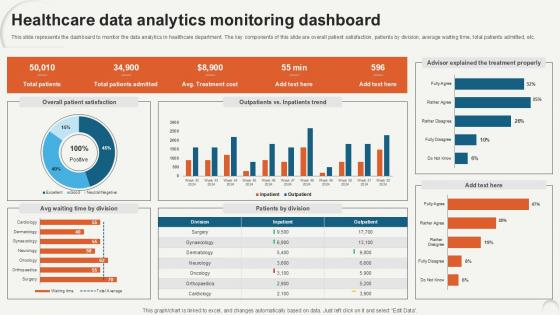
Healthcare Data Analytics Monitoring Data Analytics For Informed Decision Ppt PowerPoint
This slide represents the dashboard to monitor the data analytics in healthcare department. The key components of this slide are overall patient satisfaction, patients by division, average waiting time, total patients admitted, etc. Make sure to capture your audiences attention in your business displays with our gratis customizable Healthcare Data Analytics Monitoring Data Analytics For Informed Decision Ppt PowerPoint. These are great for business strategies, office conferences, capital raising or task suggestions. If you desire to acquire more customers for your tech business and ensure they stay satisfied, create your own sales presentation with these plain slides.

SMS Marketing Performance Analytics Report Summary PDF
This slide represents the dashboard to track and monitor the overall performance of SMS marketing campaign and its impact on business sales and revenues. It includes details related to top automated flows, attributed revenue etc. This SMS Marketing Performance Analytics Report Summary PDF from Slidegeeks makes it easy to present information on your topic with precision. It provides customization options, so you can make changes to the colors, design, graphics, or any other component to create a unique layout. It is also available for immediate download, so you can begin using it right away. Slidegeeks has done good research to ensure that you have everything you need to make your presentation stand out. Make a name out there for a brilliant performance.

Data Analytics Healthcare Best Technologies Template PDF
This slide showcases the most used technologies for healthcare data analytics. It includes technologies such as AI tools, cloud computing platforms, blockchain networks and machine learning tools. Presenting Data Analytics Healthcare Best Technologies Template PDF to dispense important information. This template comprises Five stages. It also presents valuable insights into the topics including Artificial Intelligence Tools, Cloud Computing Platforms, Blockchain Network. This is a completely customizable PowerPoint theme that can be put to use immediately. So, download it and address the topic impactfully.

Web Analytics Process Diagram Powerpoint Images
This is a web analytics process diagram powerpoint images. This is a six stage process. The stages in this process are build kpis, define goals, implement, test alternatives, analyze data, collect data.
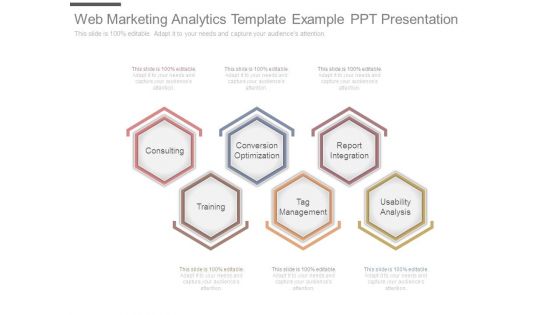
Web Marketing Analytics Template Example Ppt Presentation
This is a web marketing analytics template example ppt presentation. This is a six stage process. The stages in this process are consulting, conversion optimization, report integration, training, tag management, usability analysis.
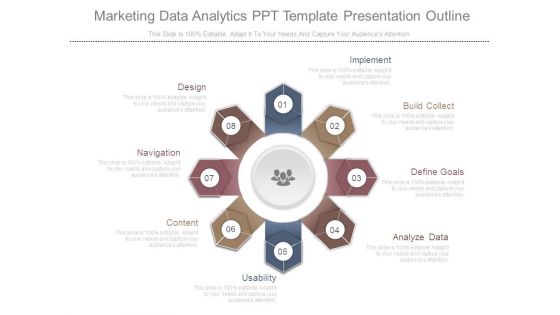
Marketing Data Analytics Ppt Template Presentation Outline
This is a marketing data analytics ppt template presentation outline. This is a eight stage process. The stages in this process are design, navigation, content, usability, analyze data, define goals, build collect, implement.
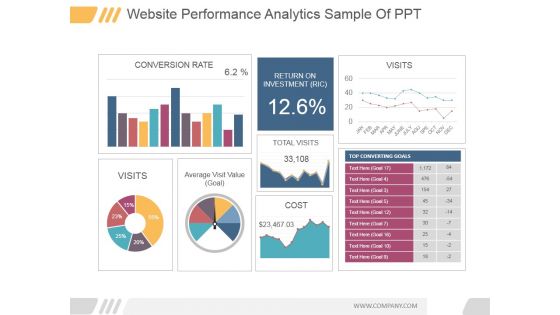
Website Performance Analytics Ppt PowerPoint Presentation Show
This is a website performance analytics ppt powerpoint presentation show. This is a three stage process. The stages in this process are conversion rate, visits, average visit value goal, return on investment ric, total visits, cost.

Paid Search Analytics Ppt PowerPoint Presentation Layout
This is a paid search analytics ppt powerpoint presentation layout. This is a three stage process. The stages in this process are march change form february, key stats, impressions, clicks, conversions.

Behavioural Analytics Ppt PowerPoint Presentation File Example
Presenting this set of slides with name behavioural analytics ppt powerpoint presentation file example. This is an editable Powerpoint six stages graphic that deals with topics like behavioural analytics to help convey your message better graphically. This product is a premium product available for immediate download and is 100 percent editable in Powerpoint. Download this now and use it in your presentations to impress your audience.
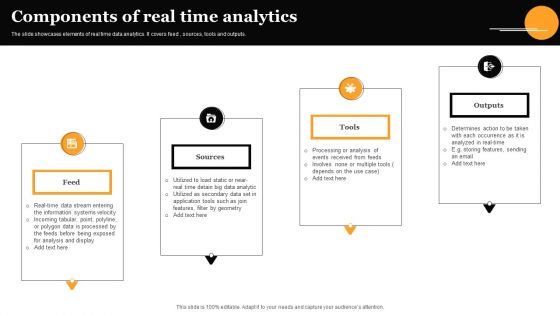
Components Of Real Time Analytics Graphics PDF
The slide showcases elements of real time data analytics. It covers feed, sources, tools and outputs. Presenting Components Of Real Time Analytics Graphics PDF to dispense important information. This template comprises four stages. It also presents valuable insights into the topics including Feed, Sources, Tools . This is a completely customizable PowerPoint theme that can be put to use immediately. So, download it and address the topic impactfully.

Revenue Streams Analytics Company Investor Funding Elevator
This slide represents various revenue generation sources of global analytics marketplace. It includes revenue sources such as subscription plans, API access, Data licensing, and custom analytics.This Revenue Streams Analytics Company Investor Funding Elevator is perfect for any presentation, be it in front of clients or colleagues. It is a versatile and stylish solution for organizing your meetings. The Revenue Streams Analytics Company Investor Funding Elevator features a modern design for your presentation meetings. The adjustable and customizable slides provide unlimited possibilities for acing up your presentation. Slidegeeks has done all the homework before launching the product for you. So, do not wait, grab the presentation templates today

Determining Least Effective Website Feature Product Analytics Implementation Data Analytics V
This slide provides an outline of data collected on website features aimed at evaluating individual effectiveness to improve engagement. The basis of evaluation are features, user feedback, metrics with key insights Make sure to capture your audiences attention in your business displays with our gratis customizable Determining Least Effective Website Feature Product Analytics Implementation Data Analytics V. These are great for business strategies, office conferences, capital raising or task suggestions. If you desire to acquire more customers for your tech business and ensure they stay satisfied, create your own sales presentation with these plain slides.

Effective Website Customer Analytics Tools Microsoft PDF
The following slide exhibits software for analysing consumer behaviour which helps businesses in providing crucial data about their marketing efforts and customer preferences. It includes information about Mixpanel, Hotjar, etc. Persuade your audience using this Effective Website Customer Analytics Tools Microsoft PDF. This PPT design covers three stages, thus making it a great tool to use. It also caters to a variety of topics including Tools, Features, Pricing. Download this PPT design now to present a convincing pitch that not only emphasizes the topic but also showcases your presentation skills.
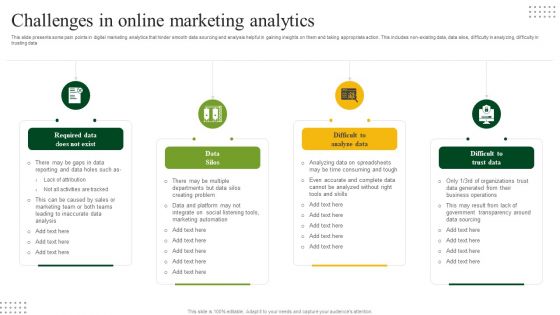
Challenges In Online Marketing Analytics Elements PDF
This slide presents some pain points in digital marketing analytics that hinder smooth data sourcing and analysis helpful in gaining insights on them and taking appropriate action. This includes non-existing data, data silos, difficulty in analyzing, difficulty in trusting data. Presenting Challenges In Online Marketing Analytics Elements PDF to dispense important information. This template comprises four stages. It also presents valuable insights into the topics including Data Silos, Difficult Analyze Data, Difficult Trust Data. This is a completely customizable PowerPoint theme that can be put to use immediately. So, download it and address the topic impactfully.
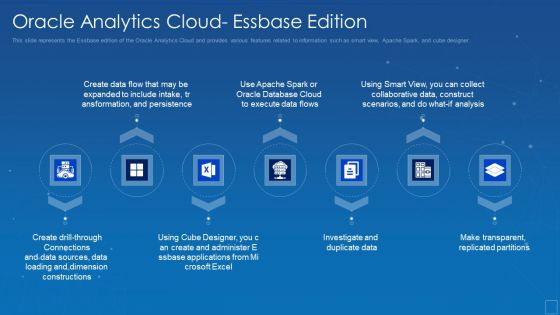
Oracle Analytics Cloud Essbase Edition Pictures PDF
This slide represents the Essbase edition of the Oracle Analytics Cloud and provides various features related to information such as smart view, Apache Spark, and cube designer. This is a oracle analytics cloud essbase edition pictures pdf template with various stages. Focus and dispense information on seven stages using this creative set, that comes with editable features. It contains large content boxes to add your information on topics like persistence, transformation, expanded, connections, sources. You can also showcase facts, figures, and other relevant content using this PPT layout. Grab it now.

Oracle Analytics Clouds Essbase Service Guidelines PDF
This slide describes the oracle analytics clouds Essbase service, and its features include flexibility, portability, enterprise readiness, best in class functionality, and proved platform and technology. This is a oracle analytics clouds essbase service guidelines pdf template with various stages. Focus and dispense information on five stages using this creative set, that comes with editable features. It contains large content boxes to add your information on topics like platform, technology, enterprise, functionality, flexible. You can also showcase facts, figures, and other relevant content using this PPT layout. Grab it now.

Benefits Of Healthcare Data Analytics Pictures PDF
This slide showcase the advantages of data analytics in healthcare. It includes benefits such as improved medical research, new drug development and automatic administrative processes. Persuade your audience using this Benefits Of Healthcare Data Analytics Pictures PDF. This PPT design covers Ten stages, thus making it a great tool to use. It also caters to a variety of topics including Clinical Data Analysis, Improve Medical Research. Download this PPT design now to present a convincing pitch that not only emphasizes the topic but also showcases your presentation skills.
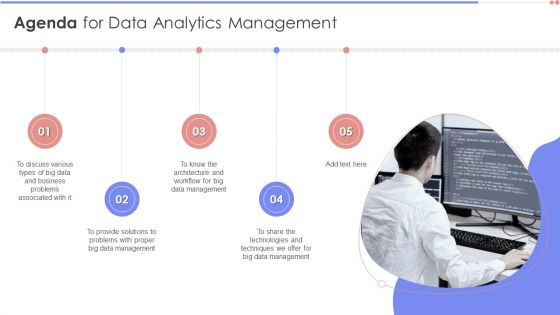
Agenda For Data Analytics Management Diagrams PDF
Presenting Agenda For Data Analytics Management Diagrams PDF to provide visual cues and insights. Share and navigate important information on five stages that need your due attention. This template can be used to pitch topics like Agenda. In addtion, this PPT design contains high resolution images, graphics, etc, that are easily editable and available for immediate download.
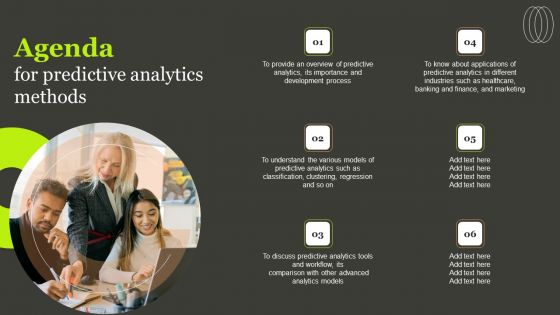
Agenda For Predictive Analytics Methods Topics PDF
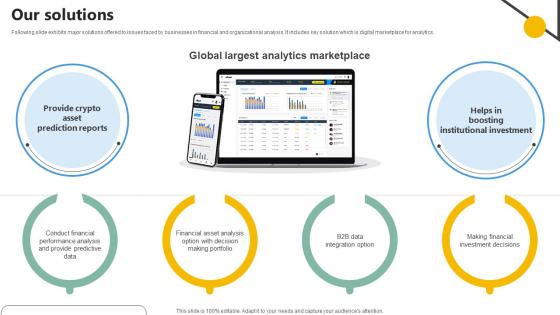
Our Solutions Analytics Company Investor Funding Elevator
Following slide exhibits major solutions offered to issues faced by businesses in financial and organizational analysis. It includes key solution which is digital marketplace for analytics. If you are looking for a format to display your unique thoughts, then the professionally designed Our Solutions Analytics Company Investor Funding Elevator is the one for you. You can use it as a Google Slides template or a PowerPoint template. Incorporate impressive visuals, symbols, images, and other charts. Modify or reorganize the text boxes as you desire. Experiment with shade schemes and font pairings. Alter, share or cooperate with other people on your work. Download Our Solutions Analytics Company Investor Funding Elevator and find out how to give a successful presentation. Present a perfect display to your team and make your presentation unforgettable.
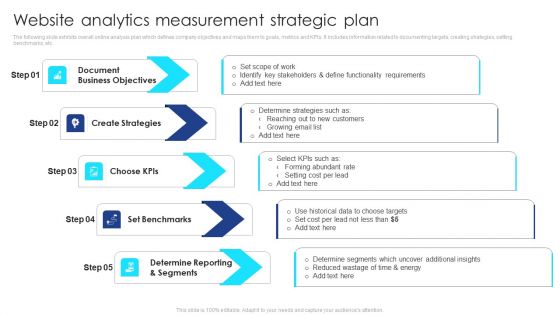
Website Analytics Measurement Strategic Plan Diagrams PDF
The following slide exhibits overall online analysis plan which defines company objectives and maps them to goals, metrics and KPIs. It includes information related to documenting targets, creating strategies, setting benchmarks, etc. Presenting Website Analytics Measurement Strategic Plan Diagrams PDF to dispense important information. This template comprises five stages. It also presents valuable insights into the topics including Document Business Objectives, Create Strategies, Choose Kpis, Set Benchmarks, Determine Reporting And Segments. This is a completely customizable PowerPoint theme that can be put to use immediately. So, download it and address the topic impactfully.
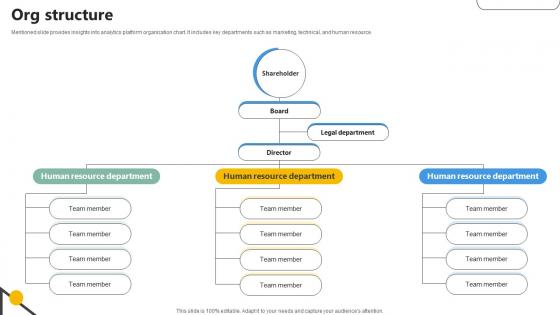
Org Structure Analytics Company Investor Funding Elevator
Mentioned slide provides insights into analytics platform organization chart. It includes key departments such as marketing, technical, and human resource.Find highly impressive Org Structure Analytics Company Investor Funding Elevator on Slidegeeks to deliver a meaningful presentation. You can save an ample amount of time using these presentation templates. No need to worry to prepare everything from scratch because Slidegeeks experts have already done a huge research and work for you. You need to download Org Structure Analytics Company Investor Funding Elevator for your upcoming presentation. All the presentation templates are 100 percent editable and you can change the color and personalize the content accordingly. Download now

Manufacturing Industry Weak Point Analytics Designs PDF
The following slide highlights pain point analysis of manufacturing industries to overcome consistent problems disrupting smooth functioning of markets. It include components such as supply chain disruptions, materials shortage etc. Presenting Manufacturing Industry Weak Point Analytics Designs PDF to dispense important information. This template comprises five stages. It also presents valuable insights into the topics including Disruptions, Shortage, Challenges. This is a completely customizable PowerPoint theme that can be put to use immediately. So, download it and address the topic impactfully.
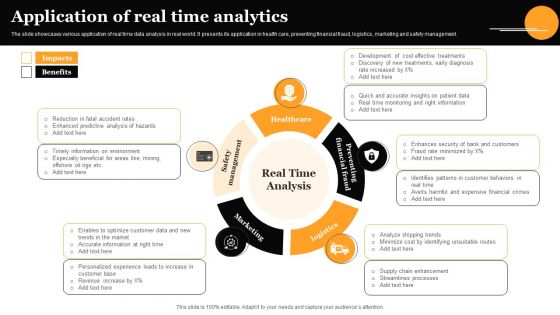
Application Of Real Time Analytics Topics PDF
The slide showcases various application of real time data analysis in real world. It presents its application in health care, preventing financial fraud, logistics, marketing and safety management. Presenting Application Of Real Time Analytics Topics PDF to dispense important information. This template comprises five stages. It also presents valuable insights into the topics including Healthcare, Preventing Financial Fraud, Logistics. This is a completely customizable PowerPoint theme that can be put to use immediately. So, download it and address the topic impactfully.

 Home
Home