Business Analytics
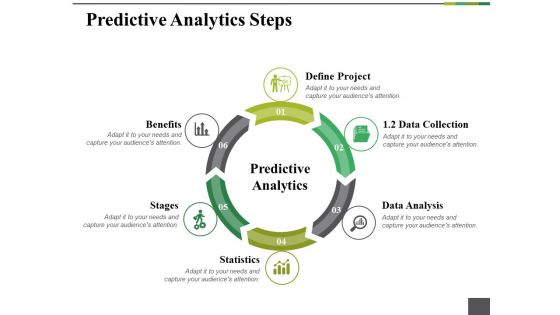
Predictive Analytics Steps Ppt PowerPoint Presentation Portfolio Template
This is a predictive analytics steps ppt powerpoint presentation portfolio template. This is a six stage process. The stages in this process are define project, benefits, stages, statistics, data analysis.

Projection Model Predictive Analytics Classification Model Introduction Rules PDF
This slide describes the overview of the classification model used in predictive analytics, including the questions it answers. It also contains algorithms used in this model, such as random forest, gradient boosted model, convolution neural network, bagging, and stacking.Are you searching for a Projection Model Predictive Analytics Classification Model Introduction Rules PDF that is uncluttered, straightforward, and original Its easy to edit, and you can change the colors to suit your personal or business branding. For a presentation that expresses how much effort you have put in, this template is ideal With all of its features, including tables, diagrams, statistics, and lists, its perfect for a business plan presentation. Make your ideas more appealing with these professional slides. Download Projection Model Predictive Analytics Classification Model Introduction Rules PDF from Slidegeeks today.
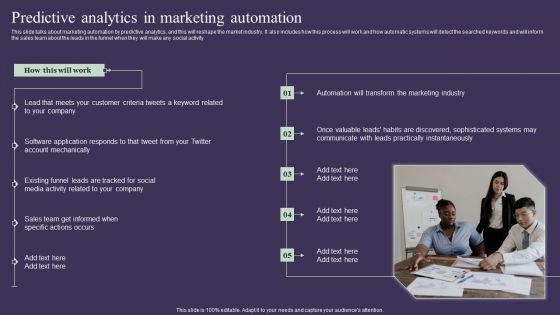
Projection Model Predictive Analytics In Marketing Automation Template PDF
This slide talks about marketing automation by predictive analytics, and this will reshape the market industry. It also includes how this process will work and how automatic systems will detect the searched keywords and will inform the sales team about the leads in the funnel when they will make any social activity. Create an editable Projection Model Predictive Analytics In Marketing Automation Template PDF that communicates your idea and engages your audience. Whether you are presenting a business or an educational presentation, pre-designed presentation templates help save time. Projection Model Predictive Analytics In Marketing Automation Template PDF is highly customizable and very easy to edit, covering many different styles from creative to business presentations. Slidegeeks has creative team members who have crafted amazing templates. So, go and get them without any delay.
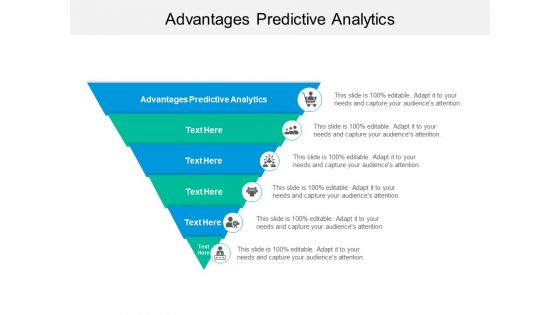
Advantages Predictive Analytics Ppt PowerPoint Presentation Outline Background Image Cpb
Presenting this set of slides with name advantages predictive analytics ppt powerpoint presentation outline background image cpb. This is an editable Powerpoint six stages graphic that deals with topics like advantages predictive analytics to help convey your message better graphically. This product is a premium product available for immediate download and is 100 percent editable in Powerpoint. Download this now and use it in your presentations to impress your audience.

Behavioral Application Analytics Ppt PowerPoint Presentation Ideas Examples Cpb Pdf
Presenting this set of slides with name behavioral application analytics ppt powerpoint presentation ideas examples cpb pdf. This is an editable Powerpoint five stages graphic that deals with topics like behavioral application analytics to help convey your message better graphically. This product is a premium product available for immediate download and is 100 percent editable in Powerpoint. Download this now and use it in your presentations to impress your audience.
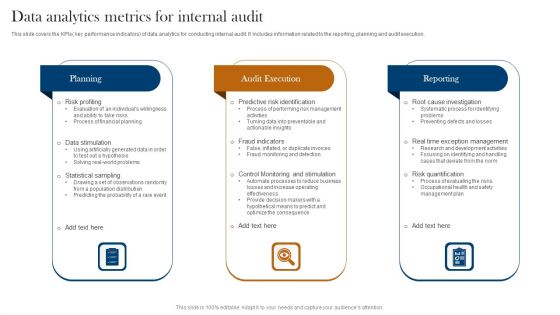
Data Analytics Metrics For Internal Audit Ppt Model Outfit PDF
This slide covers the KPIs key performance indicators of data analytics for conducting internal audit. It includes information related to the reporting, planning and audit execution. Presenting Data Analytics Metrics For Internal Audit Ppt Model Outfit PDF to dispense important information. This template comprises three stages. It also presents valuable insights into the topics including Planning, Audit Execution, Reporting. This is a completely customizable PowerPoint theme that can be put to use immediately. So, download it and address the topic impactfully.

Paid Search Analytics Ppt PowerPoint Presentation Pictures Smartart
This is a paid search analytics ppt powerpoint presentation pictures smartart. This is a three stage process. The stages in this process are budget, impressions, clicks, conversions, key stats.

Digital Transformation Strategies Data And Analytics Ppt Professional Slideshow PDF
Presenting this set of slides with name digital transformation strategies data and analytics ppt professional slideshow pdf. This is a ten stage process. The stages in this process are hyper personalization, machine intelligence, behavioural analytics, journey sciences, the experience economy, graph analytics, augmented reality, agile data science. This is a completely editable PowerPoint presentation and is available for immediate download. Download now and impress your audience.

Table Of Contents For Augmented Analytics Implementation Download PDF
This is a Table Of Contents For Augmented Analytics Implementation Download PDF template with various stages. Focus and dispense information on one stages using this creative set, that comes with editable features. It contains large content boxes to add your information on topics like Augmented Analytics Implementation, Checklist, Best Practices, Analytics Challenges. You can also showcase facts, figures, and other relevant content using this PPT layout. Grab it now.
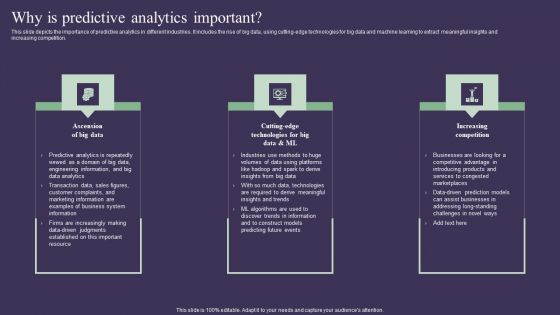
Projection Model Why Is Predictive Analytics Important Diagrams PDF
This slide depicts the importance of predictive analytics in different industries. It includes the rise of big data, using cutting-edge technologies for big data and machine learning to extract meaningful insights and increasing competition. Create an editable Projection Model Why Is Predictive Analytics Important Diagrams PDF that communicates your idea and engages your audience. Whether you are presenting a business or an educational presentation, pre-designed presentation templates help save time. Projection Model Why Is Predictive Analytics Important Diagrams PDF is highly customizable and very easy to edit, covering many different styles from creative to business presentations. Slidegeeks has creative team members who have crafted amazing templates. So, go and get them without any delay.
Efficient Analytics Metrics For Tracking Website Performance Professional PDF
This slide exhibits measures to maintain site position in market. The purpose of this slide is to improve ratio of revenue to marketing costs while promoting business successfully. It includes information related to number of visitors, bounce rates, etc. Showcasing this set of slides titled Efficient Analytics Metrics For Tracking Website Performance Professional PDF. The topics addressed in these templates are Number Of Visitors, Bounce Rates, Average Pageviews Per Session. All the content presented in this PPT design is completely editable. Download it and make adjustments in color, background, font etc. as per your unique business setting.

Comparative Assessment Of Big Data Analytics Tools Template PDF
Following slide demonstrates comparative analysis of various data management software solutions which can be used by business for improving customer service. It includes key components such as tools, price, features, rating, platforms and comments. Showcasing this set of slides titled Comparative Assessment Of Big Data Analytics Tools Template PDF. The topics addressed in these templates are Price, Automatically Optimize, Parallel Processing. All the content presented in this PPT design is completely editable. Download it and make adjustments in color, background, font etc. as per your unique business setting.

Solutions To Overcome Big Data Analytics Challenges Download PDF
Following slide includes various big data management challenges which ca be faced by business with respective solutions to increase organisation performance. It includes challenges such as big data management, tool selection, data integration and data security. Showcasing this set of slides titled Solutions To Overcome Big Data Analytics Challenges Download PDF. The topics addressed in these templates are Data Management Tools, Data Integration, Various Sources. All the content presented in this PPT design is completely editable. Download it and make adjustments in color, background, font etc. as per your unique business setting.
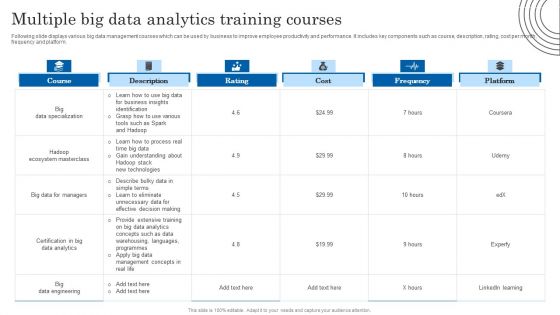
Multiple Big Data Analytics Training Courses Mockup PDF
Following slide displays various big data management courses which can be used by business to improve employee productivity and performance. It includes key components such as course, description, rating, cost per month, frequency and platform. Pitch your topic with ease and precision using this Multiple Big Data Analytics Training Courses Mockup PDF. This layout presents information on Data Specialization, Management Concepts, Business. It is also available for immediate download and adjustment. So, changes can be made in the color, design, graphics or any other component to create a unique layout.
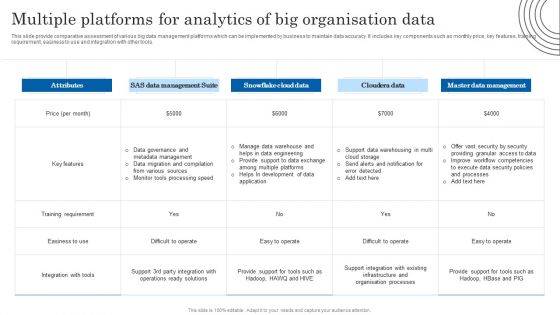
Multiple Platforms For Analytics Of Big Organisation Data Structure PDF
This slide provide comparative assessment of various big data management platforms which can be implemented by business to maintain data accuracy. It includes key components such as monthly price, key features, training requirement, easiness to use and integration with other tools. Showcasing this set of slides titled Multiple Platforms For Analytics Of Big Organisation Data Structure PDF. The topics addressed in these templates are Data Governance, Data Migration, Various Sources. All the content presented in this PPT design is completely editable. Download it and make adjustments in color, background, font etc. as per your unique business setting.

Workforce Analytics Implementation For Advancing Human Resource Agenda Infographics PDF
This slide shows result of implementing workforce analytics in organization to advance HR policies and strategies of an organization. It include three sections such as HR consumerization, Workforce analytics and Advance strategic organization etc. Persuade your audience using this Workforce Analytics Implementation For Advancing Human Resource Agenda Infographics PDF design covers three stages, thus making it a great tool to use. It also caters to a variety of topics including HR Consumerization, Workforce Analytics, Advance Strategic Organization. Download this PPT design now to present a convincing pitch that not only emphasizes the topic but also showcases your presentation skills.
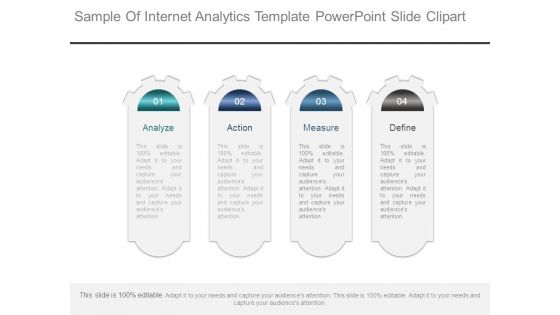
Sample Of Internet Analytics Template Powerpoint Slide Clipart
This is a sample of internet analytics template powerpoint slide clipart. This is a four stage process. The stages in this process are analyze, action, measure, define.
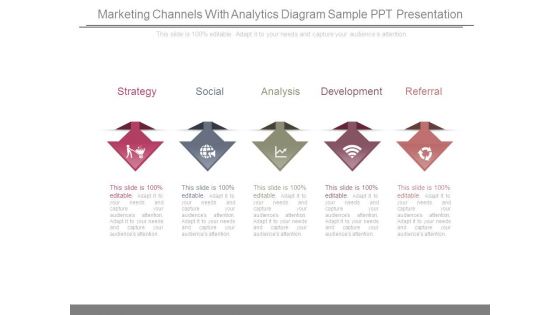
Marketing Channels With Analytics Diagram Sample Ppt Presentation
This is a marketing channels with analytics diagram sample ppt presentation. This is a five stage process. The stages in this process are strategy, social, analysis, development, referral.

Data Analytics Lifecycle Phases Ppt PowerPoint Presentation Example File
This is a data analytics lifecycle phases ppt powerpoint presentation example file. This is a four stage process. The stages in this process are deposit, discover, design, decide.

Key Driver Analytics Template 1 Ppt PowerPoint Presentation Influencers
This is a key driver analytics template 1 ppt powerpoint presentation influencers. This is a four stage process. The stages in this process are fact, marketing, icons, strategy.

Paid Search Analytics Ppt PowerPoint Presentation Portfolio File Formats
This is a paid search analytics ppt powerpoint presentation portfolio file formats. This is a three stage process. The stages in this process are impressions, clicks, conversions, budget.

Paid Search Analytics Ppt PowerPoint Presentation Model Diagrams
This is a paid search analytics ppt powerpoint presentation model diagrams. This is a three stage process. The stages in this process are budget, impressions, clicks, conversions.

Paid Search Analytics Ppt PowerPoint Presentation Summary Infographic Template
This is a paid search analytics ppt powerpoint presentation summary infographic template. This is a four stage process. The stages in this process are impressions, clicks, conversions, budget.

Paid Search Analytics Ppt PowerPoint Presentation Infographics Picture
This is a paid search analytics ppt powerpoint presentation infographics picture. This is a three stage process. The stages in this process are impressions, clicks, conversions, budget.

Paid Search Analytics Ppt PowerPoint Presentation Show Graphics Tutorials
This is a paid search analytics ppt powerpoint presentation show graphics tutorials. This is a four stage process. The stages in this process are impressions, clicks, conversions, budget.
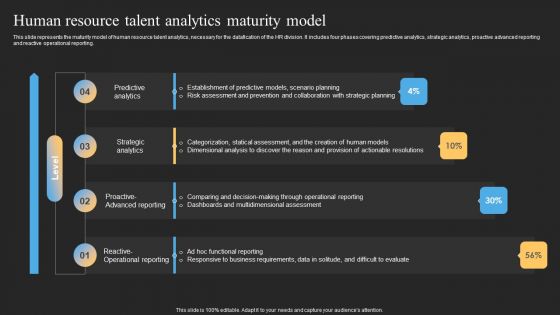
Datafy Human Resource Talent Analytics Maturity Model Microsoft PDF
This slide represents the maturity model of human resource talent analytics, necessary for the datafication of the HR division. It includes four phases covering predictive analytics, strategic analytics, proactive advanced reporting and reactive operational reporting. If your project calls for a presentation, then Slidegeeks is your go-to partner because we have professionally designed, easy-to-edit templates that are perfect for any presentation. After downloading, you can easily edit Datafy Human Resource Talent Analytics Maturity Model Microsoft PDF and make the changes accordingly. You can rearrange slides or fill them with different images. Check out all the handy templates

Projection Model Tools Used For Predictive Analytics Inspiration PDF
This slide depicts the tools used for predictive analytics to perform operations in predictive models. These tools include SPSS statistics, SAS advanced analytics, SAP predictive analytics, TIBCO Statistica, H2O, and Q research. If your project calls for a presentation, then Slidegeeks is your go-to partner because we have professionally designed, easy-to-edit templates that are perfect for any presentation. After downloading, you can easily edit Projection Model Tools Used For Predictive Analytics Inspiration PDF and make the changes accordingly. You can rearrange slides or fill them with different images. Check out all the handy templates
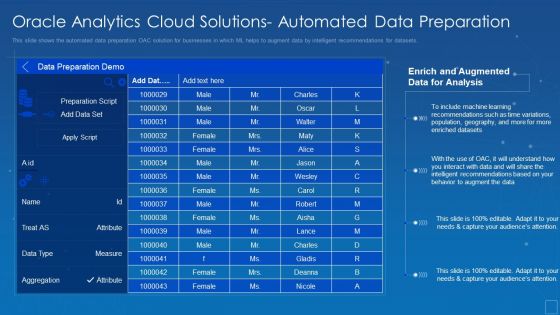
Oracle Analytics Cloud Solutions Automated Data Preparation Formats PDF
This slide shows the automated data preparation OAC solution for businesses in which ML helps to augment data by intelligent recommendations for datasets. Deliver an awe inspiring pitch with this creative oracle analytics cloud solutions automated data preparation formats pdf bundle. Topics like augmented, data, analysis, recommendations, geography can be discussed with this completely editable template. It is available for immediate download depending on the needs and requirements of the user.
Visual Analytics Vector Icon Ppt PowerPoint Presentation Visual Aids Show
Presenting this set of slides with name visual analytics vector icon ppt powerpoint presentation visual aids show. This is a three stage process. The stages in this process are data visualization icon, research analysis, business focus. This is a completely editable PowerPoint presentation and is available for immediate download. Download now and impress your audience.
Projection Model Uses Of Predictive Analytics Credit Icons PDF
This slide describes the usage of predictive analytics in banking and other financial institutions for credit purposes. It is used to calculate the credit score of a person or organization and to ensure that borrower does not fail to return the loan. Crafting an eye-catching presentation has never been more straightforward. Let your presentation shine with this tasteful yet straightforward Projection Model Uses Of Predictive Analytics Credit Icons PDF template. It offers a minimalistic and classy look that is great for making a statement. The colors have been employed intelligently to add a bit of playfulness while still remaining professional. Construct the ideal Projection Model Uses Of Predictive Analytics Credit Icons PDF that effortlessly grabs the attention of your audience Begin now and be certain to wow your customers
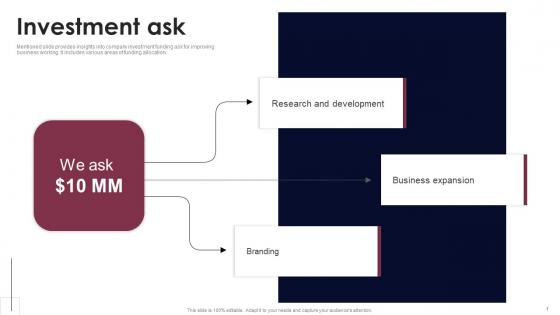
Investment Ask Smart Grid Analytics Investor Fund Raising Template PDF
Mentioned slide provides insights into company investment funding ask for improving business working. It includes various areas of funding allocation. Whether you have daily or monthly meetings, a brilliant presentation is necessary. Investment Ask Smart Grid Analytics Investor Fund Raising Template PDF can be your best option for delivering a presentation. Represent everything in detail using Investment Ask Smart Grid Analytics Investor Fund Raising Template PDF and make yourself stand out in meetings. The template is versatile and follows a structure that will cater to your requirements. All the templates prepared by Slidegeeks are easy to download and edit. Our research experts have taken care of the corporate themes as well. So, give it a try and see the results.
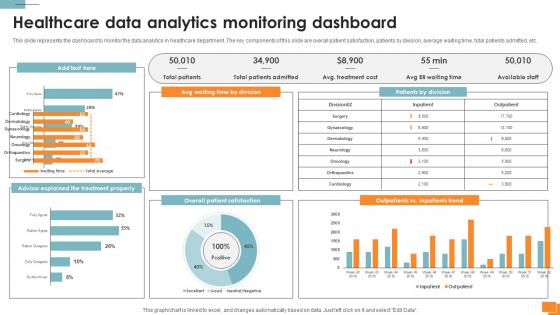
Statistical Tools For Evidence Healthcare Data Analytics Monitoring Dashboard
This slide represents the dashboard to monitor the data analytics in healthcare department. The key components of this slide are overall patient satisfaction, patients by division, average waiting time, total patients admitted, etc. Welcome to our selection of the Statistical Tools For Evidence Healthcare Data Analytics Monitoring Dashboard. These are designed to help you showcase your creativity and bring your sphere to life. Planning and Innovation are essential for any business that is just starting out. This collection contains the designs that you need for your everyday presentations. All of our PowerPoints are 100Percent editable, so you can customize them to suit your needs. This multi-purpose template can be used in various situations. Grab these presentation templates today.
Machine Learning Healthcare Data Analytics Icon Background PDF
Persuade your audience using this Machine Learning Healthcare Data Analytics Icon Background PDF. This PPT design covers Three stages, thus making it a great tool to use. It also caters to a variety of topics including Machine Learning, Healthcare Data, Analytics Icon. Download this PPT design now to present a convincing pitch that not only emphasizes the topic but also showcases your presentation skills.

Customer Behavior Analytics Ppt PowerPoint Presentation Complete Deck With Slides
Boost your confidence and team morale with this well-structured Customer Behavior Analytics Ppt PowerPoint Presentation Complete Deck With Slides. This prefabricated set gives a voice to your presentation because of its well-researched content and graphics. Our experts have added all the components very carefully, thus helping you deliver great presentations with a single click. Not only that, it contains a set of twenty five slides that are designed using the right visuals, graphics, etc. Various topics can be discussed, and effective brainstorming sessions can be conducted using the wide variety of slides added in this complete deck. Apart from this, our PPT design contains clear instructions to help you restructure your presentations and create multiple variations. The color, format, design anything can be modified as deemed fit by the user. Not only this, it is available for immediate download. So, grab it now.

Top Clients Data Analytics Company Outline Pictures PDF
The slide highlights the business clients for company marketing research and insights services. The clients include Google, Facebook, Qualtrics, Alibaba group, samba tv, Twitter, NDR, Hulu, snap.inc, Medallia, comScore, affective, conexance, eyeota, liveramp and Acxiom Find a pre-designed and impeccable Top Clients Data Analytics Company Outline Pictures PDF The templates can ace your presentation without additional effort. You can download these easy-to-edit presentation templates to make your presentation stand out from others. So, what are you waiting for Download the template from Slidegeeks today and give a unique touch to your presentation.

Phases Of Data Analytics Discovery Ppt Infographic Template Outfit PDF
This slide represents the first phase of data science that is understanding business problems and the facts that come under this phase. This is a phases of data analytics discovery ppt infographic template outfit pdf template with various stages. Focus and dispense information on four stages using this creative set, that comes with editable features. It contains large content boxes to add your information on topics like business, analysis, organization, requirements. You can also showcase facts, figures, and other relevant content using this PPT layout. Grab it now.
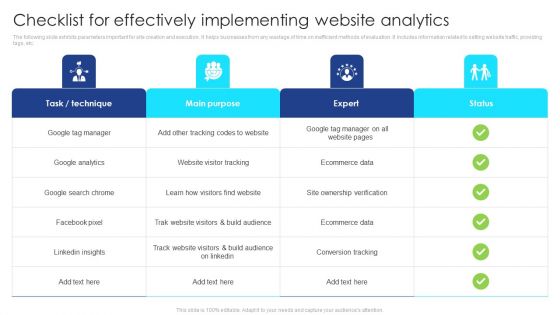
Checklist For Effectively Implementing Website Analytics Guidelines PDF
The following slide exhibits parameters important for site creation and execution. It helps businesses from any wastage of time on inefficient methods of evaluation. It includes information related to setting website traffic, providing tags, etc. Showcasing this set of slides titled Checklist For Effectively Implementing Website Analytics Guidelines PDF. The topics addressed in these templates are Ecommerce Data, Conversion Tracking, Site Ownership Verification. All the content presented in this PPT design is completely editable. Download it and make adjustments in color, background, font etc. as per your unique business setting.
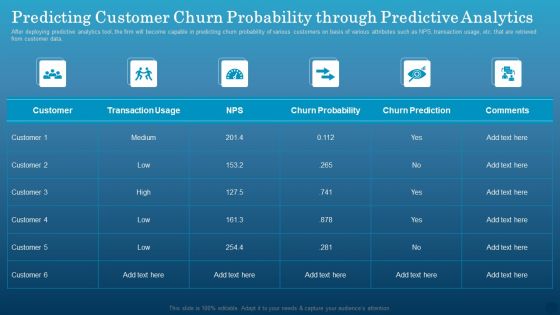
Predicting Customer Churn Probability Through Predictive Analytics Inspiration PDF
After deploying predictive analytics tool, the firm will become capable in predicting churn probability of various customers on basis of various attributes such as NPS, transaction usage, etc. that are retrieved from customer data. Coming up with a presentation necessitates that the majority of the effort goes into the content and the message you intend to convey. The visuals of a PowerPoint presentation can only be effective if it supplements and supports the story that is being told. Keeping this in mind our experts created Predicting Customer Churn Probability Through Predictive Analytics Inspiration PDF to reduce the time that goes into designing the presentation. This way, you can concentrate on the message while our designers take care of providing you with the right template for the situation.

Human Resource Analytics Employee Engagement Key Performance Metrics Inspiration PDF
This slide represents key metrics dashboard to analyze the engagement of employees in the organization. It includes details related to KPIs such as engagement score, response rate, net promoter score etc. Crafting an eye-catching presentation has never been more straightforward. Let your presentation shine with this tasteful yet straightforward Human Resource Analytics Employee Engagement Key Performance Metrics Inspiration PDF template. It offers a minimalistic and classy look that is great for making a statement. The colors have been employed intelligently to add a bit of playfulness while still remaining professional. Construct the ideal Human Resource Analytics Employee Engagement Key Performance Metrics Inspiration PDF that effortlessly grabs the attention of your audience Begin now and be certain to wow your customers.
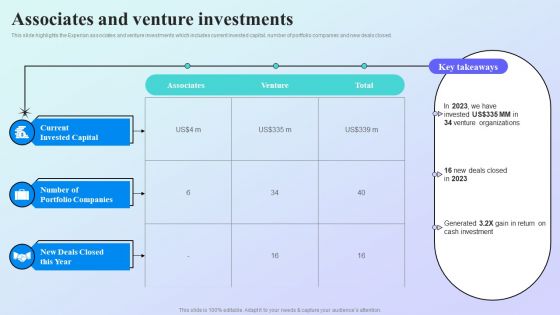
Information Analytics Company Outline Associates And Venture Investments Summary PDF
This slide highlights the Experian associates and venture investments which includes current invested capital, number of portfolio companies and new deals closed. If you are looking for a format to display your unique thoughts, then the professionally designed Information Analytics Company Outline Associates And Venture Investments Summary PDF is the one for you. You can use it as a Google Slides template or a PowerPoint template. Incorporate impressive visuals, symbols, images, and other charts. Modify or reorganize the text boxes as you desire. Experiment with shade schemes and font pairings. Alter, share or cooperate with other people on your work. Download Information Analytics Company Outline Associates And Venture Investments Summary PDF and find out how to give a successful presentation. Present a perfect display to your team and make your presentation unforgettable.
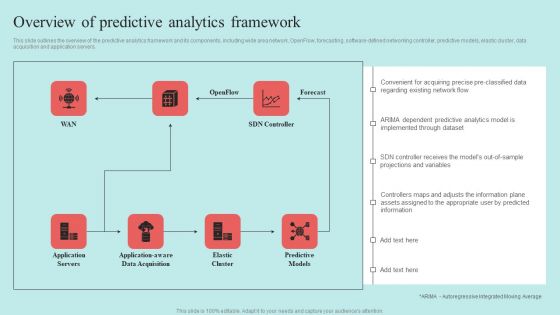
Predictive Data Model Overview Of Predictive Analytics Framework Summary PDF
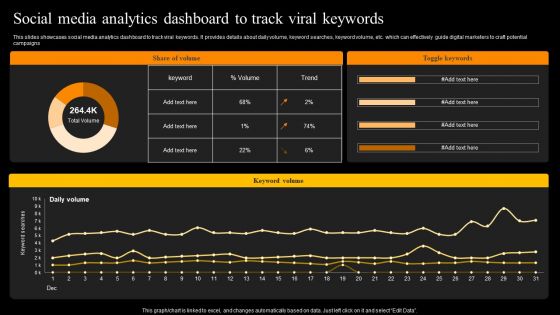
Social Media Analytics Dashboard To Track Viral Keywords Structure PDF
This slides showcases social media analytics dashboard to track viral keywords. It provides details about daily volume, keyword searches, keyword volume, etc. which can effectively guide digital marketers to craft potential campaigns. Slidegeeks is one of the best resources for PowerPoint templates. You can download easily and regulate Social Media Analytics Dashboard To Track Viral Keywords Structure PDF for your personal presentations from our wonderful collection. A few clicks is all it takes to discover and get the most relevant and appropriate templates. Use our Templates to add a unique zing and appeal to your presentation and meetings. All the slides are easy to edit and you can use them even for advertisement purposes.

Warehouse Fleet And Transportation Performance Analytics Dashboard Pictures PDF
This slide represents a warehouse fleet and transportation management dashboard to visualize and optimize logistics operations through advanced data analyses. It monitors KPIs such as fleet status, delivery status, deliveries by location, average delivery time hours0 and route Km, loading time and weight, and profit by location. Do you have to make sure that everyone on your team knows about any specific topic I yes, then you should give Warehouse Fleet And Transportation Performance Analytics Dashboard Pictures PDF a try. Our experts have put a lot of knowledge and effort into creating this impeccable Warehouse Fleet And Transportation Performance Analytics Dashboard Pictures PDF. You can use this template for your upcoming presentations, as the slides are perfect to represent even the tiniest detail. You can download these templates from the Slidegeeks website and these are easy to edit. So grab these today
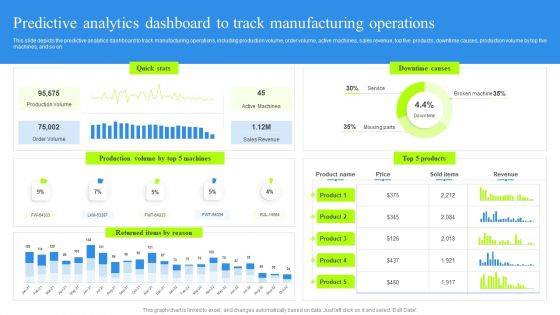
Predictive Analytics Dashboard To Track Manufacturing Operations Rules PDF
This slide depicts the predictive analytics dashboard to track manufacturing operations, including production volume, order volume, active machines, sales revenue, top five products, downtime causes, production volume by top five machines, and so on. Present like a pro with Predictive Analytics Dashboard To Track Manufacturing Operations Rules PDF Create beautiful presentations together with your team, using our easy-to-use presentation slides. Share your ideas in real-time and make changes on the fly by downloading our templates. So whether you are in the office, on the go, or in a remote location, you can stay in sync with your team and present your ideas with confidence. With Slidegeeks presentation got a whole lot easier. Grab these presentations today.
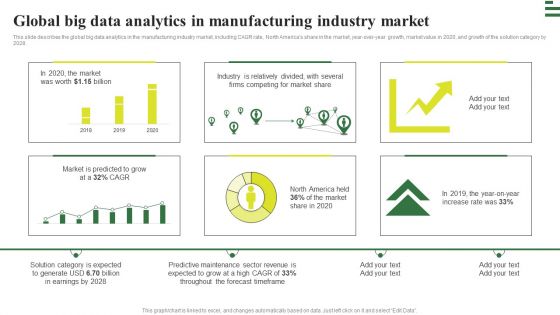
Transforming Manufacturing With Automation Global Big Data Analytics Rules PDF
This slide describes the global big data analytics in the manufacturing industry market, including CAGR rate, North Americas share in the market, year-over-year growth, market value in 2020, and growth of the solution category by 2028. Are you in need of a template that can accommodate all of your creative concepts This one is crafted professionally and can be altered to fit any style. Use it with Google Slides or PowerPoint. Include striking photographs, symbols, depictions, and other visuals. Fill, move around, or remove text boxes as desired. Test out color palettes and font mixtures. Edit and save your work, or work with colleagues. Download Transforming Manufacturing With Automation Global Big Data Analytics Rules PDF and observe how to make your presentation outstanding. Give an impeccable presentation to your group and make your presentation unforgettable.
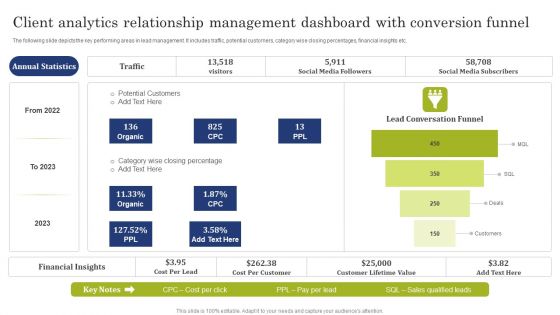
Client Analytics Relationship Management Dashboard With Conversion Funnel Demonstration PDF
The following slide depicts the key performing areas in lead management. It includes traffic, potential customers, category wise closing percentages, financial insights etc. Pitch your topic with ease and precision using this Client Analytics Relationship Management Dashboard With Conversion Funnel Demonstration PDF. This layout presents information on Potential Customers, Social Media Followers, Social Media Subscribers. It is also available for immediate download and adjustment. So, changes can be made in the color, design, graphics or any other component to create a unique layout.
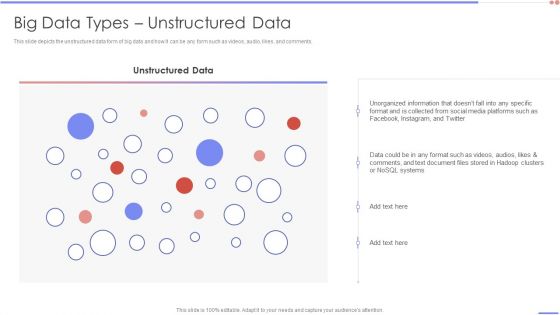
Data Analytics Management Big Data Types Unstructured Data Brochure PDF
This slide depicts the unstructured data form of big data and how it can be any form such as videos, audio, likes, and comments. Deliver and pitch your topic in the best possible manner with this Data Analytics Management Big Data Types Unstructured Data Brochure PDF. Use them to share invaluable insights on Unorganized Information, Format Collected, Document Stored and impress your audience. This template can be altered and modified as per your expectations. So, grab it now.
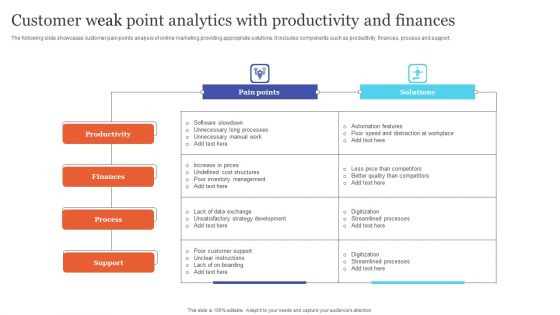
Customer Weak Point Analytics With Productivity And Finances Demonstration PDF
The following slide showcases customer pain points analysis of online marketing providing appropriate solutions. It includes components such as productivity, finances, process and support. Pitch your topic with ease and precision using this Customer Weak Point Analytics With Productivity And Finances Demonstration PDF. This layout presents information on Productivity, Finances, Process. It is also available for immediate download and adjustment. So, changes can be made in the color, design, graphics or any other component to create a unique layout.

Requirement Gathering Techniques Product Feature Analytics Baseline Sample PDF
This slide covers the key performance indicators for analyzing the product features based on baseline target and time frame. Deliver and pitch your topic in the best possible manner with this requirement gathering techniques product feature analytics baseline sample pdf. Use them to share invaluable insights on performance indicator, baseline, target, time frame and impress your audience. This template can be altered and modified as per your expectations. So, grab it now.
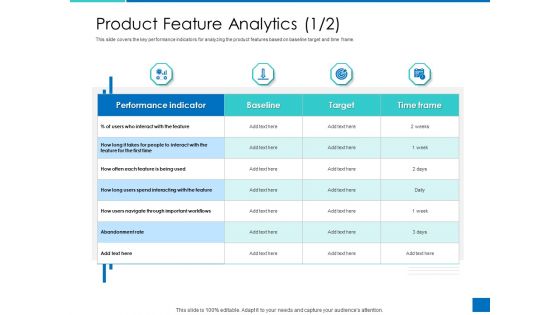
Analyzing Requirement Management Process Product Feature Analytics Baseline Clipart PDF
This slide covers the key performance indicators for analyzing the product features based on baseline target and time frame. Deliver and pitch your topic in the best possible manner with this analyzing requirement management process product feature analytics baseline clipart pdf. Use them to share invaluable insights on performance indicator, baseline, target, time frame and impress your audience. This template can be altered and modified as per your expectations. So, grab it now.
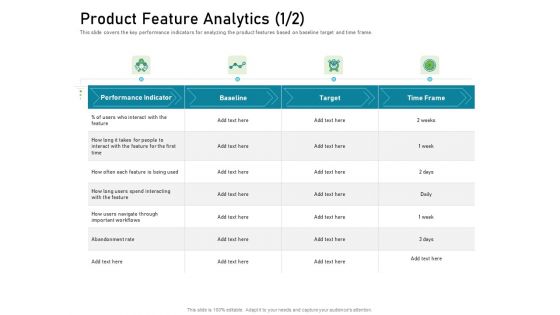
Requirements Governance Plan Product Feature Analytics Rate Microsoft PDF
This slide covers the key performance indicators for analyzing the product features based on baseline target and time frame. Deliver an awe-inspiring pitch with this creative requirements governance plan product feature analytics rate microsoft pdf bundle. Topics like performance indicator, target, time frame can be discussed with this completely editable template. It is available for immediate download depending on the needs and requirements of the user.
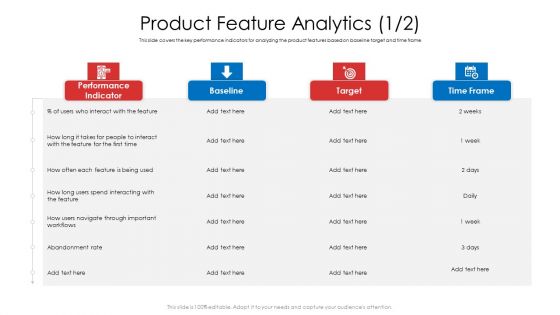
Product Demand Document Product Feature Analytics Rate Formats PDF
This slide covers the key performance indicators for analyzing the product features based on baseline target and time frame. Deliver an awe-inspiring pitch with this creative product demand document product feature analytics rate formats pdf bundle. Topics like performance indicator, baseline, target, time frame can be discussed with this completely editable template. It is available for immediate download depending on the needs and requirements of the user.
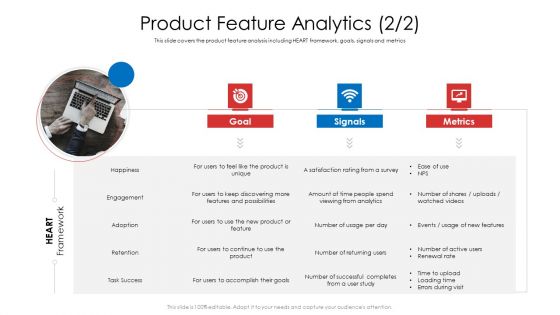
Product Demand Document Product Feature Analytics Information PDF
This slide covers the product feature analysis including HEART framework, goals, signals and metrics. Deliver and pitch your topic in the best possible manner with this product demand document product feature analytics information pdf. Use them to share invaluable insights on metrics, goal, engagement, retention, task success and impress your audience. This template can be altered and modified as per your expectations. So, grab it now.

Customer Behavioral Data And Analytics Customer Retention Rate Graphics PDF
Customer Retention Rate measures how many customers continue to be customers in the subsequent year. You get to know if your retention strategies are working or not. Deliver and pitch your topic in the best possible manner with this customer behavioral data and analytics customer retention rate graphics pdf. Use them to share invaluable insights on customer retention rate and impress your audience. This template can be altered and modified as per your expectations. So, grab it now.
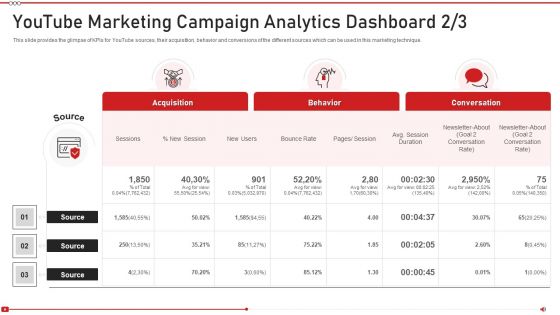
Advertising On Youtube Platform Youtube Marketing Campaign Analytics Elements PDF
This slide provides the glimpse of KPIs for YouTube sources, their acquisition, behavior and conversions of the different sources which can be used in this marketing technique. Deliver an awe inspiring pitch with this creative advertising on youtube platform youtube marketing campaign analytics elements pdf bundle. Topics like acquisition, behavior, conversions can be discussed with this completely editable template. It is available for immediate download depending on the needs and requirements of the user.
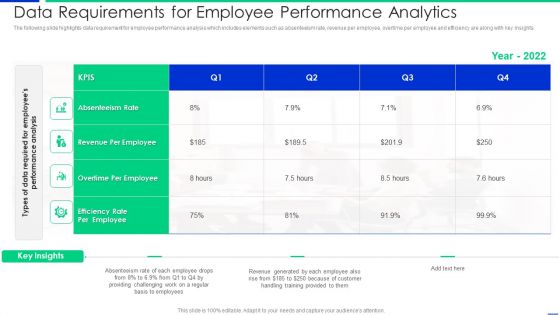
Data Requirements For Employee Performance Analytics Graphics PDF
The following slide highlights data requirement for employee performance analysis which includes elements such as absenteeism rate, revenue per employee, overtime per employee and efficiency are along with key insights. Pitch your topic with ease and precision using this data requirements for employee performance analytics graphics pdf. This layout presents information on revenue, employee, rate. It is also available for immediate download and adjustment. So, changes can be made in the color, design, graphics or any other component to create a unique layout.
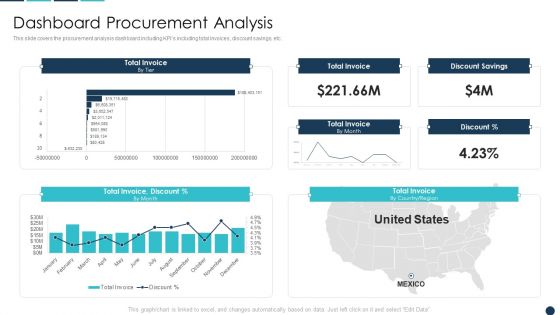
Procurement Analytics Tools And Strategies Dashboard Procurement Analysis Inspiration PDF
This slide covers the procurement analysis dashboard including KPIs including total invoices, discount savings, etc. Deliver and pitch your topic in the best possible manner with this Procurement Analytics Tools And Strategies Dashboard Procurement Analysis Inspiration PDF. Use them to share invaluable insights on Total Invoice, Discount Savings, Invoice Discount and impress your audience. This template can be altered and modified as per your expectations. So, grab it now.

Procurement Analytics Tools And Strategies Enterprise Procurement Reporting Infographics PDF
This slide covers procurement reporting and analysis dashboard including KPI metrices such as spend, transactions, PO, PR and invoice count, invoices information, due dates, spend by payment terms, supplier payment terms etc. Deliver an awe inspiring pitch with this creative Procurement Analytics Tools And Strategies Enterprise Procurement Reporting Infographics PDF bundle. Topics like Spend By Country, Spend Category, Vendor Country can be discussed with this completely editable template. It is available for immediate download depending on the needs and requirements of the user.

Procurement Analytics Tools And Strategies Procurement Spend Analysis Graphics PDF
This slide covers procurement spend analysis dashboard including KPIs such as invoice count, invoices information, due dates, spend by payment terms, supplier payment terms, spend by entity, spend by category, spend by country.Deliver an awe inspiring pitch with this creative Procurement Analytics Tools And Strategies Procurement Spend Analysis Graphics PDF bundle. Topics like Transactions, Invoice Count, Spend Category can be discussed with this completely editable template. It is available for immediate download depending on the needs and requirements of the user.

Data Analytics Management Complexity Of Managing Data Quality Summary PDF
This slide depicts another big data challenge that is the complexity of managing data quality due to different data formats and sources of information.Deliver an awe inspiring pitch with this creative Data Analytics Management Complexity Of Managing Data Quality Summary PDF bundle. Topics like Received In Multiple, Accurate Reliable, Information Duplicate can be discussed with this completely editable template. It is available for immediate download depending on the needs and requirements of the user.

 Home
Home