Budget Gap Analysis
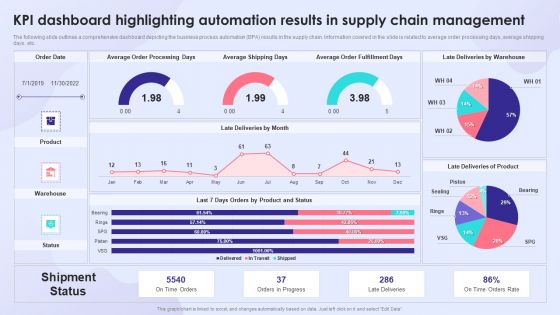
KPI Dashboard Highlighting Automation Results In Supply Chain Management Rules PDF
The following slide outlines a comprehensive dashboard depicting the business process automation BPA results in the supply chain. Information covered in the slide is related to average order processing days, average shipping days, etc. Deliver and pitch your topic in the best possible manner with this KPI Dashboard Highlighting Automation Results In Supply Chain Management Rules PDF. Use them to share invaluable insights on Average Order Fulfillment Days, Average Shipping Days, Average Order Processing Days and impress your audience. This template can be altered and modified as per your expectations. So, grab it now.

Determining The Actors Behind Most Significant Cyber Attack Download PDF
The purpose of this slide is to outline different actors who are involved in the most critical cyber attack. Online criminals, foreign governments, hackers and malicious insiders are some of the key players who are responsible for cyber attack. Deliver and pitch your topic in the best possible manner with this Determining The Actors Behind Most Significant Cyber Attack Download PDF. Use them to share invaluable insights on Online Criminals, Causing Disruption, Government Officials and impress your audience. This template can be altered and modified as per your expectations. So, grab it now.
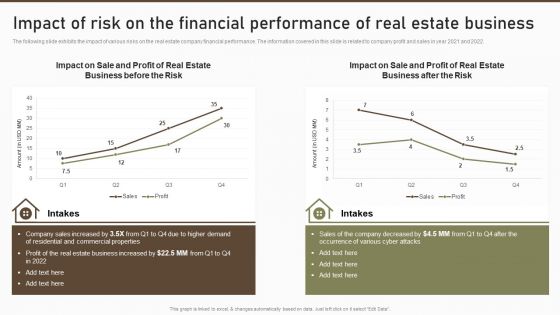
Impact Of Risk On The Financial Performance Of Real Estate Business Summary PDF
The following slide exhibits the impact of various risks on the real estate company financial performance. The information covered in this slide is related to company profit and sales in year 2021 and 2022. Deliver and pitch your topic in the best possible manner with this Impact Of Risk On The Financial Performance Of Real Estate Business Summary PDF. Use them to share invaluable insights on Commercial Properties, Estate Business, Real Estate and impress your audience. This template can be altered and modified as per your expectations. So, grab it now.
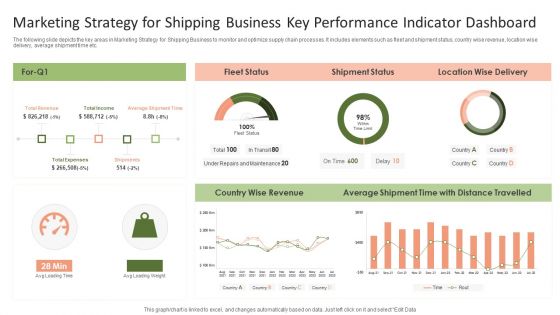
Marketing Strategy For Shipping Business Key Performance Indicator Dashboard Graphics PDF
The following slide depicts the key areas in Marketing Strategy for Shipping Business to monitor and optimize supply chain processes. It includes elements such as fleet and shipment status, country wise revenue, location wise delivery, average shipment time etc.Pitch your topic with ease and precision using this Marketing Strategy For Shipping Business Key Performance Indicator Dashboard Graphics PDF. This layout presents information on Shipment Status, Average Shipment, Wise Revenue. It is also available for immediate download and adjustment. So, changes can be made in the color, design, graphics or any other component to create a unique layout.
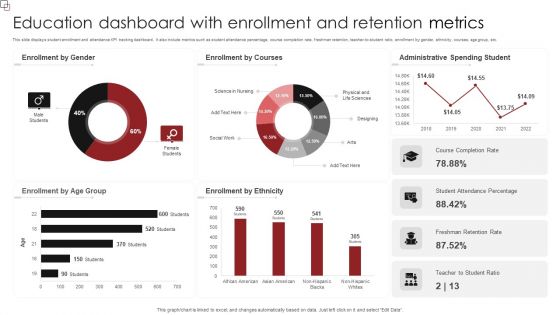
Education Dashboard With Enrollment And Retention Metrics Sample PDF
This slide displays student enrollment and attendance KPI tracking dashboard. It also include metrics such as student attendance percentage, course completion rate, freshman retention, teacher-to-student ratio, enrollment by gender, ethnicity, courses, age group, etc. Pitch your topic with ease and precision using this Education Dashboard With Enrollment And Retention Metrics Sample PDF. This layout presents information on Enrollment Gender, Enrollment Courses, Administrative Spending Student. It is also available for immediate download and adjustment. So, changes can be made in the color, design, graphics or any other component to create a unique layout.

Quarterly Sales Performance With Kpi Dashboard Introduction PDF
The following slide highlights the quarter wise sales performance of a company to evaluate plan and strategies implemented. It includes metrics such as market share, actual vs target sales, gross and net profit etc. Pitch your topic with ease and precision using this Quarterly Sales Performance With Kpi Dashboard Introduction PDF. This layout presents information on Market Share, Net Profit, Target. It is also available for immediate download and adjustment. So, changes can be made in the color, design, graphics or any other component to create a unique layout.
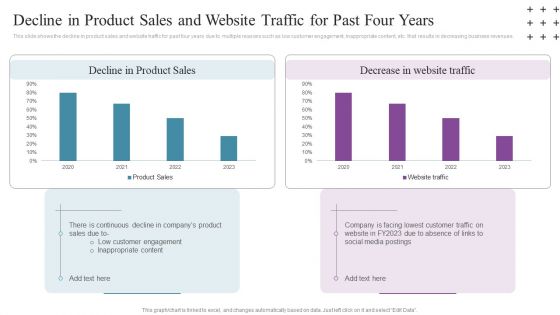
Social Networking Program Decline In Product Sales And Website Traffic For Past Four Years Microsoft PDF
This slide shows the decline in product sales and website traffic for past four years due to multiple reasons such as low customer engagement, inappropriate content, etc. that results in decreasing business revenues. Deliver an awe inspiring pitch with this creative Social Networking Program Decline In Product Sales And Website Traffic For Past Four Years Microsoft PDF bundle. Topics like Decline Product Sales, Decrease Website Traffic, 2020 To 2023 can be discussed with this completely editable template. It is available for immediate download depending on the needs and requirements of the user.
Dashboard For Tracking Customer Service Team Performance Clipart PDF
This slide covers the KPI dashboard for analyzing the performance of client support department. It includes metrics such as first call resolution, unresolved calls, average response rate, the best day to call, average time to solve issues, etc. Deliver an awe inspiring pitch with this creative Dashboard For Tracking Customer Service Team Performance Clipart PDF bundle. Topics like Dashboard For Tracking Customer, Service Team Performance can be discussed with this completely editable template. It is available for immediate download depending on the needs and requirements of the user.

KPI Dashboard Highlighting Automation Results In Supply Achieving Operational Efficiency Graphics PDF
The following slide outlines a comprehensive dashboard depicting the business process automation BPA results in the supply chain. Information covered in the slide is related to average order processing days, average shipping days, etc.Deliver and pitch your topic in the best possible manner with this KPI Dashboard Highlighting Automation Results In Supply Achieving Operational Efficiency Graphics PDF. Use them to share invaluable insights on Orders Progress, Late Deliveries, Deliveries Warehouse and impress your audience. This template can be altered and modified as per your expectations. So, grab it now.
Developing Significant Business Product And Customer Performance Tracking Clipart PDF
This slide provides information regarding dashboard utilized by firm to monitor performance of products offered and customer associated. The performance is tracked through revenues generated, new customer acquired, customer satisfaction, sales comparison, etc. Deliver and pitch your topic in the best possible manner with this Developing Significant Business Product And Customer Performance Tracking Clipart PDF. Use them to share invaluable insights on Revenue, New Customer, Revenue and impress your audience. This template can be altered and modified as per your expectations. So, grab it now.

Key Statistics Highlighting Various Risks Faced By Real Estate Managers Mockup PDF
The following slide exhibits major statistics illustrating the different risks faced by the real estate owners and managers in two years. Information covered in this slide is related to physical property damager, tenant risks, administrative risks, cyber risks and employment issues. Deliver and pitch your topic in the best possible manner with this Key Statistics Highlighting Various Risks Faced By Real Estate Managers Mockup PDF. Use them to share invaluable insights on Key Statistics Highlighting, Various Risks, Real Estate Managers and impress your audience. This template can be altered and modified as per your expectations. So, grab it now.
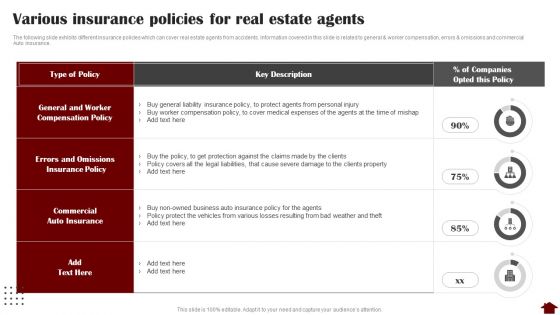
Various Insurance Policies For Real Estate Agents Ideas PDF
The following slide exhibits different insurance policies which can cover real estate agents from accidents. Information covered in this slide is related to general and worker compensation, errors and omissions and commercial Auto insurance. Deliver and pitch your topic in the best possible manner with this Various Insurance Policies For Real Estate Agents Ideas PDF. Use them to share invaluable insights on Insurance, Business, Expenses and impress your audience. This template can be altered and modified as per your expectations. So, grab it now.

Impact Of Risk On The Financial Performance Of Real Managing Commercial Property Risks Sample PDF
The following slide exhibits the impact of various risks on the real estate company financial performance. The information covered in this slide is related to company profit and sales in year 2021 and 2022. Deliver and pitch your topic in the best possible manner with this Impact Of Risk On The Financial Performance Of Real Managing Commercial Property Risks Sample PDF. Use them to share invaluable insights on Estate Business, Business Increased, Company Decreased and impress your audience. This template can be altered and modified as per your expectations. So, grab it now.
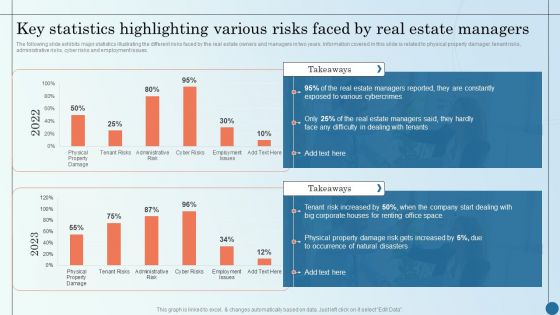
Key Statistics Highlighting Various Risks Faced By Real Managing Commercial Property Risks Elements PDF
The following slide exhibits major statistics illustrating the different risks faced by the real estate owners and managers in two years. Information covered in this slide is related to physical property damager, tenant risks, administrative risks, cyber risks and employment issues. Deliver and pitch your topic in the best possible manner with this Key Statistics Highlighting Various Risks Faced By Real Managing Commercial Property Risks Elements PDF. Use them to share invaluable insights on Various Cybercrimes, Estate Managers, Natural Disasters and impress your audience. This template can be altered and modified as per your expectations. So, grab it now.
Dashboard For Tracking Customer Service Team Performance Information PDF
This slide covers the KPI dashboard for analyzing the performance of client support department. It includes metrics such as first call resolution, unresolved calls, average response rate, the best day to call, average time to solve issues, etc. Deliver an awe inspiring pitch with this creative Dashboard For Tracking Customer Service Team Performance Information PDF bundle. Topics like Dashboard For Tracking Customer, Service Team Performance can be discussed with this completely editable template. It is available for immediate download depending on the needs and requirements of the user.

Workforce Communication And Engagement Dashboard With Suggestions And Response Rate Microsoft PDF
This slide showcases dashboard to identify key improvement areas in implementation of workforce engagement and communication initiatives by company. It includes KPIs such as factors, highlights, focus areas, etc. Pitch your topic with ease and precision using this Workforce Communication And Engagement Dashboard With Suggestions And Response Rate Microsoft PDF. This layout presents information on Key Factors, Since Last Measured, Factors And Que. It is also available for immediate download and adjustment. So, changes can be made in the color, design, graphics or any other component to create a unique layout.
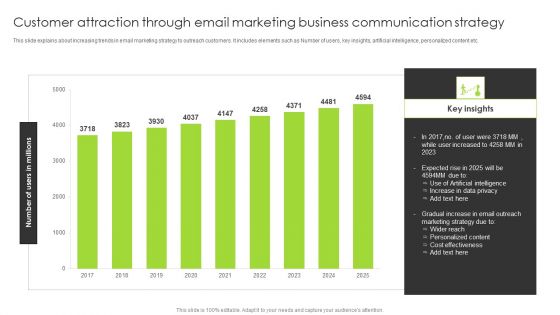
Customer Attraction Through Email Marketing Business Communication Strategy Portrait PDF
This slide explains about increasing trends in email marketing strategy to outreach customers. It includes elements such as Number of users, key insights, artificial intelligence, personalized content etc. Pitch your topic with ease and precision using this Customer Attraction Through Email Marketing Business Communication Strategy Portrait PDF. This layout presents information on Gradual Increase, Email Outreach, Marketing Strategy. It is also available for immediate download and adjustment. So, changes can be made in the color, design, graphics or any other component to create a unique layout.
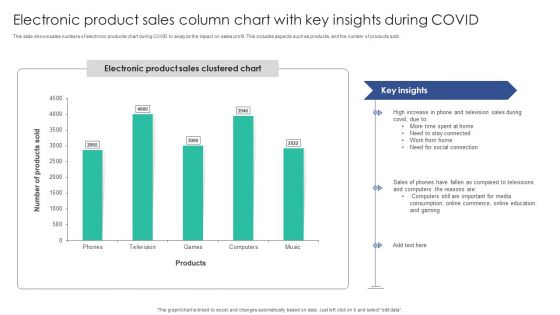
Electronic Product Sales Column Chart With Key Insights During COVID Microsoft PDF
This slide shows sales numbers of electronic products chart during COVID to analyze the impact on sales profit. This includes aspects such as products, and the number of products sold. Pitch your topic with ease and precision using this Electronic Product Sales Column Chart With Key Insights During COVID Microsoft PDF. This layout presents information on Stay Connected, Social Connection, Compared Televisions. It is also available for immediate download and adjustment. So, changes can be made in the color, design, graphics or any other component to create a unique layout.

Monthly Company Sales And Expenses Column Chart With Key Insights Mockup PDF
This slide depicts monthly comparative column chart of sales and expenses in a company to analyze organizational profits. It includes aspects such as months vs. revenue generatedPitch your topic with ease and precision using this Monthly Company Sales And Expenses Column Chart With Key Insights Mockup PDF. This layout presents information on Sales Channels, Counterproductive Policies, Sales Commission. It is also available for immediate download and adjustment. So, changes can be made in the color, design, graphics or any other component to create a unique layout.
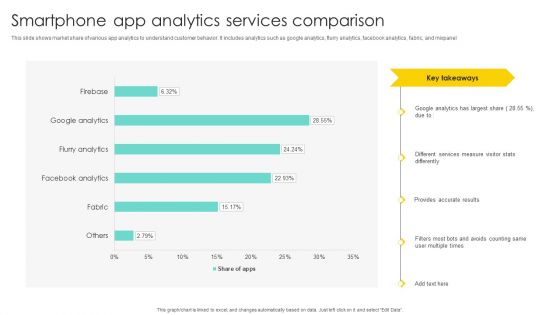
Smartphone App Analytics Services Comparison Brochure PDF
This slide shows market share of various app analytics to understand customer behavior. It includes analytics such as google analytics, flurry analytics, facebook analytics, fabric, and mixpanel. Pitch your topic with ease and precision using this Smartphone App Analytics Services Comparison Brochure PDF. This layout presents information on Different Services Measure, Visitor Stats Differently, Provides Accurate Results. It is also available for immediate download and adjustment. So, changes can be made in the color, design, graphics or any other component to create a unique layout.

Customer Rating And Reviews For Retail Store With Net Promoter Score Demonstration PDF
The following slide shows analytics for average consumer feedback for first quarter to help organization improve overall customer experience. It further includes details such as NPS score, open and pending issues, happy visits, complaints, etc. Pitch your topic with ease and precision using this Customer Rating And Reviews For Retail Store With Net Promoter Score Demonstration PDF. This layout presents information on Average Feedback, Happy Visits, Complains. It is also available for immediate download and adjustment. So, changes can be made in the color, design, graphics or any other component to create a unique layout.

Positive Negative Customer Ratings For Ecommerce Business Rules PDF
This slide displays statistics for overall favourable and unfavourable customer reviews received by company in major segments such as products, delivery, order checkout, cancellations and billing to identify problematic areas and devise strategies for its improvement. Pitch your topic with ease and precision using this Positive Negative Customer Ratings For Ecommerce Business Rules PDF. This layout presents information on Customer Reviews Received, Average Customer Rating, Target For Current Year. It is also available for immediate download and adjustment. So, changes can be made in the color, design, graphics or any other component to create a unique layout.
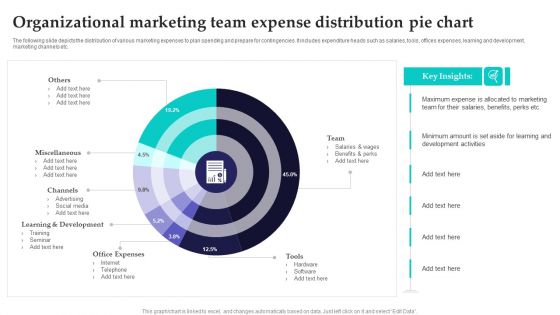
Organizational Marketing Team Expense Distribution Pie Chart Infographics PDF
The following slide depicts the distribution of various marketing expenses to plan spending and prepare for contingencies. It includes expenditure heads such as salaries, tools, offices expenses, learning and development, marketing channels etc. Pitch your topic with ease and precision using this Organizational Marketing Team Expense Distribution Pie Chart Infographics PDF. This layout presents information on Development, Office Expenses, Internet. It is also available for immediate download and adjustment. So, changes can be made in the color, design, graphics or any other component to create a unique layout.

Dashboard Showcasing Impact Of Blog Content Marketing Plan Summary PDF
This slide illustrates dashboard showcasing impact of blog content marketing strategy implemented to increase product awareness and conversion rates. It provides various KPIs such as, followers, likes, reach, user engagement, website visits etc. Pitch your topic with ease and precision using this Dashboard Showcasing Impact Of Blog Content Marketing Plan Summary PDF. This layout presents information on User Engagement, Monthly Website Visits, Spend Lifetime Value, Payback Time. It is also available for immediate download and adjustment. So, changes can be made in the color, design, graphics or any other component to create a unique layout.
Executive Dashboards For Tracking Financial Health Of Enterprise Diagrams PDF
This slide represents the CEO dashboard to track the financial health of an organization. It includes key performance indicators such as revenue, expenses, activity ratio, gross profit margin, EBIT etc. Pitch your topic with ease and precision using this Executive Dashboards For Tracking Financial Health Of Enterprise Diagrams PDF. This layout presents information on Revenue, Expense, Activity Ratio. It is also available for immediate download and adjustment. So, changes can be made in the color, design, graphics or any other component to create a unique layout.
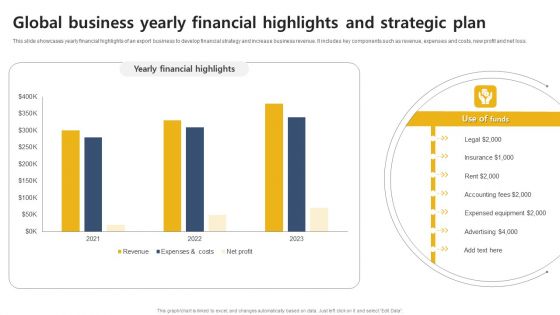
Global Business Yearly Financial Highlights And Strategic Plan Themes PDF
This slide highlights statistical presentation of import export business to quarterly evaluate balance of trade. It includes key components such as export, import, quarterly trends and balance of trade. Pitch your topic with ease and precision using this Global Business Yearly Financial Highlights And Strategic Plan Themes PDF. This layout presents information on Global Business, Yearly Financial Highlights, Strategic Plan. It is also available for immediate download and adjustment. So, changes can be made in the color, design, graphics or any other component to create a unique layout.

Transaction Overview Dashboard For Ecommerce Industry Summary PDF
This slide showcases transaction summary dashboard to help company track and monitor major KPIs. It includes key elements such as online and store orders, product wise revenue, comparison, inventory turnover ratio, etc. Pitch your topic with ease and precision using this Transaction Overview Dashboard For Ecommerce Industry Summary PDF. This layout presents information on Revenue, Inventory Outstanding, Transaction. It is also available for immediate download and adjustment. So, changes can be made in the color, design, graphics or any other component to create a unique layout.
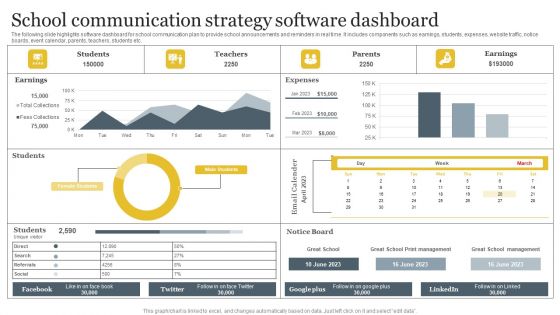
School Communication Strategy Software Dashboard Template PDF
The following slide highlights software dashboard for school communication plan to provide school announcements and reminders in real time. It includes components such as earnings, students, expenses, website traffic, notice boards, event calendar, parents, teachers, students etc. Pitch your topic with ease and precision using this School Communication Strategy Software Dashboard Template PDF. This layout presents information on Earnings, Students, Teachers, Parents. It is also available for immediate download and adjustment. So, changes can be made in the color, design, graphics or any other component to create a unique layout.

Reasons For Consumer Unsubscription In Email Permission Advertising Diagrams PDF
This slide represents major reasons of consumers to unsubscribe from email marketing and communications that affects brand goodwill negatively. It include reasons such as spam, irrelevant emails, bad experience etc. Pitch your topic with ease and precision using this Reasons For Consumer Unsubscription In Email Permission Advertising Diagrams PDF. This layout presents information on Irrelevant Emails, Customer Interest, Target Audience. It is also available for immediate download and adjustment. So, changes can be made in the color, design, graphics or any other component to create a unique layout.

Milk Shop Inventory Stock Report Structure PDF
This slide illustrate stock availability summary report of milk shop in order to fulfill the demand of end consumer with any shortage and minizine wastage. It includes elements such as product stock list, revenue, expense, loss, stock status, quantity required etc. Pitch your topic with ease and precision using this Milk Shop Inventory Stock Report Structure PDF. This layout presents information on Stock Summary Report, Analytics Overview, Product Stock List. It is also available for immediate download and adjustment. So, changes can be made in the color, design, graphics or any other component to create a unique layout.
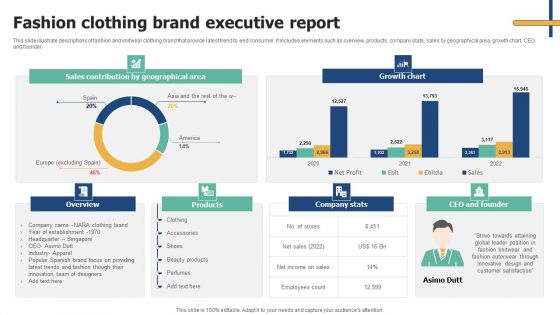
Fashion Clothing Brand Executive Report Download PDF
This slide illustrate descriptions of fashion and knitwear clothing brand that provide latest trend to end consumer. It includes elements such as overview, products, company stats, sales by geographical area, growth chart, CEO and founder. Pitch your topic with ease and precision using this Fashion Clothing Brand Executive Report Download PDF. This layout presents information on Sales Contribution, Geographical Area, Growth Chart. It is also available for immediate download and adjustment. So, changes can be made in the color, design, graphics or any other component to create a unique layout.

Brand Recommendation Influence On Business Growth Diagrams PDF
Following slide demonstrates impact of brand endorsement on business market share to determine level of increased brand market share. This includes impacts on business such as leverage reputation, independent positioning, increase customer base and reduce. Pitch your topic with ease and precision using this Brand Recommendation Influence On Business Growth Diagrams PDF. This layout presents information on Leverage Reputation, Independent Positioning, Increase Customer Base, Customer Loyalty. It is also available for immediate download and adjustment. So, changes can be made in the color, design, graphics or any other component to create a unique layout.
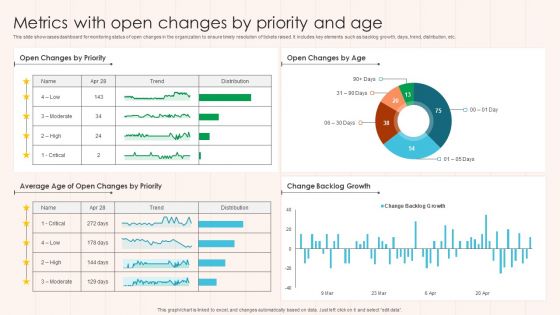
Metrics With Open Changes By Priority And Age Guidelines PDF
This slide showcases dashboard for monitoring status of open changes in the organization to ensure timely resolution of tickets raised. It includes key elements such as backlog growth, days, trend, distribution, etc. Pitch your topic with ease and precision using this Metrics With Open Changes By Priority And Age Guidelines PDF This layout presents information on Change Backlog Growth, Priority, Age. It is also available for immediate download and adjustment. So, changes can be made in the color, design, graphics or any other component to create a unique layout.

Company Production Units In Decade Linear Chart Designs PDF
This slide depicts a number of production units in a decade to ensure demand and supply product. It includes parts such as years and production units Pitch your topic with ease and precision using this Company Production Units In Decade Linear Chart Designs PDF. This layout presents information on Key Insights, Production Units Chart, Linear Chart. It is also available for immediate download and adjustment. So, changes can be made in the color, design, graphics or any other component to create a unique layout.
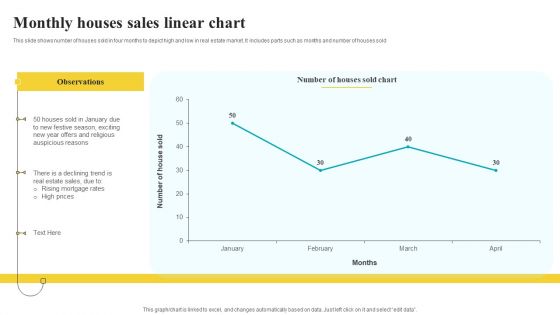
Monthly Houses Sales Linear Chart Pictures PDF
This slide shows number of houses sold in four months to depict high and low in real estate market. It includes parts such as months and number of houses sold Pitch your topic with ease and precision using this Monthly Houses Sales Linear Chart Pictures PDF. This layout presents information on Observations, Auspicious Reasons, Sales Linear Chart. It is also available for immediate download and adjustment. So, changes can be made in the color, design, graphics or any other component to create a unique layout.

Business Intelligence Dashboard For Food And Beverage Industry Diagrams PDF
This slide showcases BI dashboard to track overall performance of business operations. It further includes elements such as sales, total transactions, non labor margin, expenses by category, etc. Pitch your topic with ease and precision using this Business Intelligence Dashboard For Food And Beverage Industry Diagrams PDF. This layout presents information on Expenses, Sales, Business Intelligence Dashboard. It is also available for immediate download and adjustment. So, changes can be made in the color, design, graphics or any other component to create a unique layout.
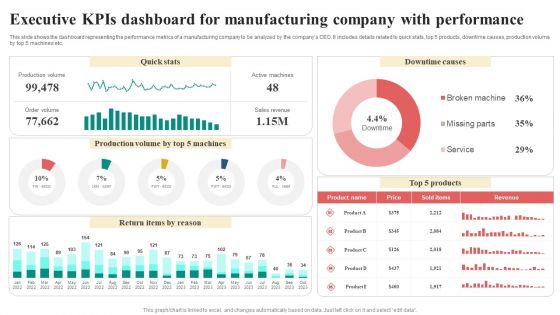
Executive Kpis Dashboard For Manufacturing Company With Performance Infographics PDF
This slide shows the dashboard representing the performance metrics of a manufacturing company to be analyzed by the companys CEO. It includes details related to quick stats, top 5 products, downtime causes, production volume by top 5 machines etc. Showcasing this set of slides titled Executive Kpis Dashboard For Manufacturing Company With Performance Infographics PDF. The topics addressed in these templates are Return Items By Reason, Quick Stats, Downtime Causes, Revenue. All the content presented in this PPT design is completely editable. Download it and make adjustments in color, background, font etc. as per your unique business setting.
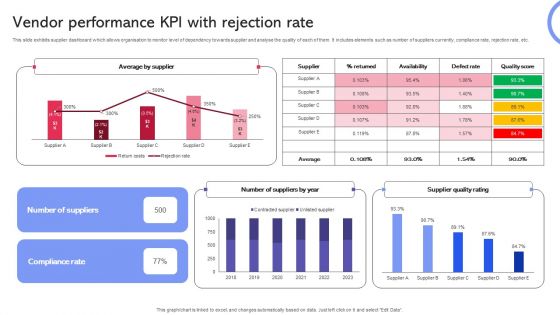
Vendor Performance KPI With Rejection Rate Inspiration PDF
This slide exhibits supplier dashboard which allows organisation to monitor level of dependency towards supplier and analyse the quality of each of them. It includes elements such as number of suppliers currently, compliance rate, rejection rate, etc. Pitch your topic with ease and precision using this Vendor Performance KPI With Rejection Rate Inspiration PDF. This layout presents information on Vendor Performance KPI, Rejection Rate. It is also available for immediate download and adjustment. So, changes can be made in the color, design, graphics or any other component to create a unique layout.
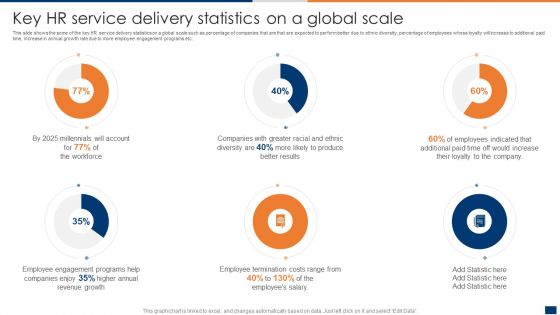
Key HR Service Delivery Statistics On A Global Scale Ppt PowerPoint Presentation File Professional PDF
This slide shows the some of the key HR service delivery statistics on a global scale such as percentage of companies that are that are expected to perform better due to ethnic diversity, percentage of employees whose loyalty will increase to additional paid time, increase in annual growth rate due to more employee engagement programs etc. Welcome to our selection of the Key HR Service Delivery Statistics On A Global Scale Ppt PowerPoint Presentation File Professional PDF. These are designed to help you showcase your creativity and bring your sphere to life. Planning and Innovation are essential for any business that is just starting out. This collection contains the designs that you need for your everyday presentations. All of our PowerPoints are 100 percent editable, so you can customize them to suit your needs. This multi purpose template can be used in various situations. Grab these presentation templates today.
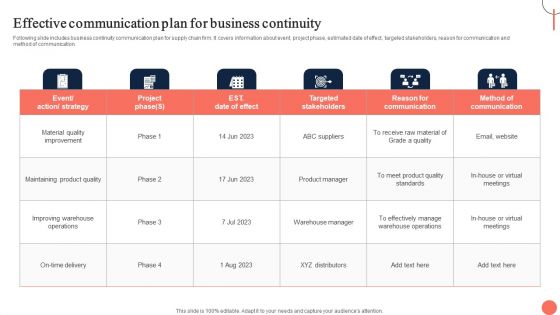
Strategies For Dynamic Supply Chain Agility Effective Communication Plan For Business Continuity Formats PDF
Following slide includes business continuity communication plan for supply chain firm. It covers information about event, project phase, estimated date of effect, targeted stakeholders, reason for communication and method of communication. Are you in need of a template that can accommodate all of your creative concepts This one is crafted professionally and can be altered to fit any style. Use it with Google Slides or PowerPoint. Include striking photographs, symbols, depictions, and other visuals. Fill, move around, or remove text boxes as desired. Test out color palettes and font mixtures. Edit and save your work, or work with colleagues. Download Strategies For Dynamic Supply Chain Agility Effective Communication Plan For Business Continuity Formats PDF and observe how to make your presentation outstanding. Give an impeccable presentation to your group and make your presentation unforgettable.

Business Charts Examples 3d Men Changing Team Teamwork PowerPoint Templates
We present our business charts examples 3d men changing team teamwork PowerPoint templates.Download and present our People PowerPoint Templates because Our PowerPoint Templates and Slides will steer your racing mind. Hit the right buttons and spur on your audience. Present our Business PowerPoint Templates because They will bring a lot to the table. Their alluring flavours will make your audience salivate. Use our Metaphors-Visual Concepts PowerPoint Templates because you should Experience excellence with our PowerPoint Templates and Slides. They will take your breath away. Present our Leadership PowerPoint Templates because Our PowerPoint Templates and Slides will let your ideas bloom. Create a bed of roses for your audience. Use our Shapes PowerPoint Templates because Our PowerPoint Templates and Slides will let you Hit the target. Go the full distance with ease and elan.Use these PowerPoint slides for presentations relating to 3d, abandon, achievement, away, betray, business, career, change, company,corporation, different, diversity, exchange, figure, graphic, group, guy, human,illustration, image, important, individuality, job, jumping, leave, male, man,organization, people, person, promotion, quit, render, rendered, side, strategy,success, successful, switch, team, teamwork, three-dimensional, white. The prominent colors used in the PowerPoint template are Blue , White, Gray. Customers tell us our business charts examples 3d men changing team teamwork PowerPoint templates look good visually. We assure you our career PowerPoint templates and PPT Slides effectively help you save your valuable time. Customers tell us our business charts examples 3d men changing team teamwork PowerPoint templates are effectively colour coded to prioritise your plans They automatically highlight the sequence of events you desire. Use our away PowerPoint templates and PPT Slides will make the presenter successul in his career/life. PowerPoint presentation experts tell us our business charts examples 3d men changing team teamwork PowerPoint templates are second to none. You can be sure our achievement PowerPoint templates and PPT Slides provide great value for your money. Be assured of finding the best projection to highlight your words.
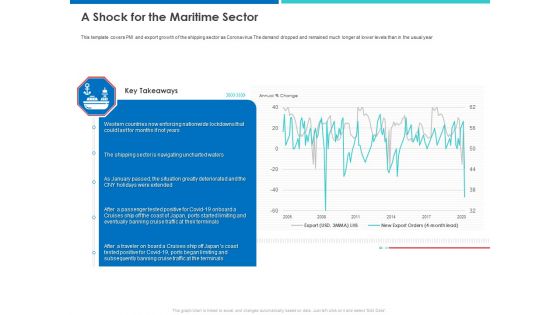
Accelerating COVID 19 Recovery In Maritime Sector A Shock For The Maritime Sector Brochure PDF
This template covers PMI and export growth of the shipping sector as Coronavirus The demand dropped and remained much longer at lower levels than in the usual year.Deliver an awe inspiring pitch with this creative accelerating COVID 19 recovery in maritime sector a shock for the maritime sector brochure pdf. bundle. Topics like annual persent change, the shipping sector is navigating uncharted waters, 2005 to 2020 can be discussed with this completely editable template. It is available for immediate download depending on the needs and requirements of the user.

Maximizing Profitability Earning Through Sales Initiatives Current Sales Revenue Of The Company In Absence Of Effective Sales Strategy Structure PDF
This slide shows details about the declining Sales Revenue of the Company in the past 3 years. The Revenue of the Company is constantly declining due to reasons such as absence of an effective sales strategy, poor online presence, poor marketing and sales alignment etc. Deliver an awe inspiring pitch with this creative maximizing profitability earning through sales initiatives current sales revenue of the company in absence of effective sales strategy structure pdf bundle. Topics like marketing and sales alignment, sales strategies, product service awareness, revenue, key takeaways can be discussed with this completely editable template. It is available for immediate download depending on the needs and requirements of the user.
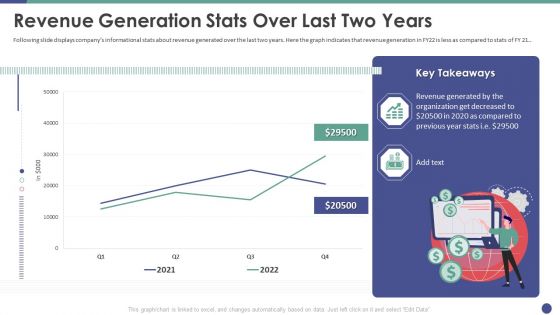
QC Engineering Revenue Generation Stats Over Last Two Years Ppt Portfolio Graphics Tutorials PDF
Following slide displays companys informational stats about revenue generated over the last two years. Here the graph indicates that revenue generation in FY22 is less as compared to stats of FY21. Deliver an awe inspiring pitch with this creative qc engineering revenue generation stats over last two years ppt portfolio graphics tutorials pdf bundle. Topics like revenue generation stats over last two years can be discussed with this completely editable template. It is available for immediate download depending on the needs and requirements of the user.

Sequoia Company Capital Raising Elevator What Are Our Financials Clipart PDF
Purpose of the following slide is to show the key organization financials which displays key KPIs such as the Net Sales, Gross Margin, EBITDA etc. The following slide also highlights a world map that display the organization revenue by geography. Deliver an awe inspiring pitch with this creative sequoia company capital raising elevator what are our financials clipart pdf bundle. Topics like revenues, geographical, potential, organization can be discussed with this completely editable template. It is available for immediate download depending on the needs and requirements of the user.

Fall In On Time Delivery Percentage Of HCL Plus Logistics Company Download PDF
This slide shows a fall in the On-time Delivery Percentage of HCL Plus Logistics Company. Reasons for the fall is due to factors such as Poor Production Efficiency, Poor Fright Carrier Performance, Faulty Material Handling Procedures, Faulty Scheduling Procedures and Softwares etc. Deliver an awe inspiring pitch with this creative fall in on time delivery percentage of hcl plus logistics company download pdf bundle. Topics like production, efficiency, performance, handling, procedures can be discussed with this completely editable template. It is available for immediate download depending on the needs and requirements of the user.

Developing New Product Messaging Canvas Determining Its USP Understanding Our Product Lifecycle Background PDF
Purpose of the following slide is to displays the lifecycle of the product as the provided graph displays, key stages of product lifecycle. These stages are product development, introduction, growth , maturity and decline along with the total sales and profit the product has generated Deliver an awe inspiring pitch with this creative developing new product messaging canvas determining its usp understanding our product lifecycle background pdf bundle. Topics like understanding our product lifecycle can be discussed with this completely editable template. It is available for immediate download depending on the needs and requirements of the user.
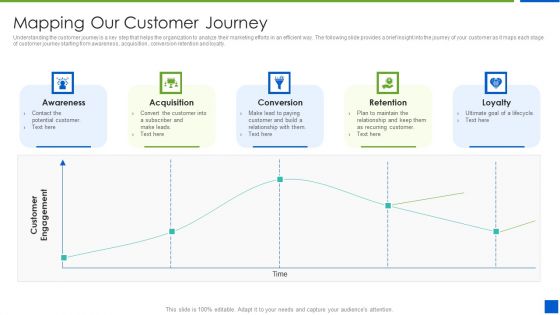
Improving Brand Recognition With Message And Differentiation Strategy Mapping Our Customer Journey Microsoft PDF
Understanding the customer journey is a key step that helps the organization to analyze their marketing efforts in an efficient way. The following slide provides a brief insight into the journey of your customer as it maps each stage of customer journey starting from awareness , acquisition , conversion retention and loyalty. Deliver an awe inspiring pitch with this creative improving brand recognition with message and differentiation strategy mapping our customer journey microsoft pdf bundle. Topics like awareness, acquisition, conversion, retention, loyalty can be discussed with this completely editable template. It is available for immediate download depending on the needs and requirements of the user.
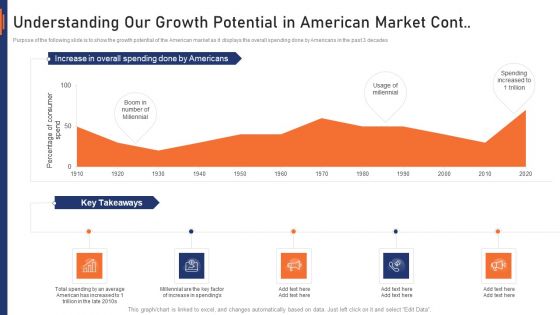
VR Market Capital Raising Elevator Pitch Deck Understanding Our Growth Potential In American Market Cont Sample PDF
Purpose of the following slide is to show the growth potential of the American market as it displays the overall spending done by Americans in the past 3 decades. Deliver an awe inspiring pitch with this creative vr market capital raising elevator pitch deck understanding our growth potential in american market cont sample pdf bundle. Topics like understanding our growth potential in american market cont can be discussed with this completely editable template. It is available for immediate download depending on the needs and requirements of the user.

Marketing Communication Channels For Increasing Brand Awarenes Mapping Our Customer Journey Infographics PDF
Understanding the customer journey is a key step that helps the organization to analyze their marketing efforts in an efficient way. The following slide provides a brief insight into the journey of your customer as it maps each stage of customer journey starting from awareness, acquisition, conversion retention and loyalty. Deliver an awe inspiring pitch with this creative marketing communication channels for increasing brand awarenes mapping our customer journey infographics pdf bundle. Topics like mapping our customer journey can be discussed with this completely editable template. It is available for immediate download depending on the needs and requirements of the user.
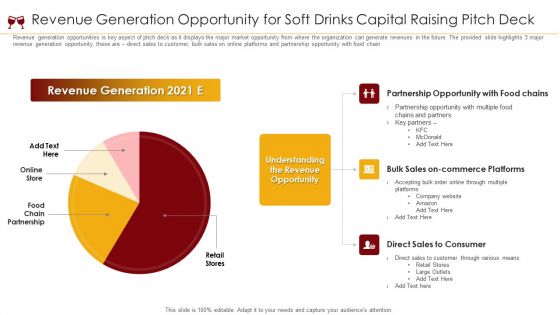
Revenue Generation Opportunity For Soft Drinks Capital Raising Pitch Deck Ppt Infographic Template Slides PDF
Revenue generation opportunities is key aspect of pitch deck as it displays the major market opportunity from where the organization can generate revenues in the future. The provided slide highlights 3 major revenue generation opportunity, these are direct sales to customer, bulk sales on online platforms and partnership opportunity with food chain. Deliver an awe inspiring pitch with this creative revenue generation opportunity for soft drinks capital raising pitch deck ppt infographic template slides pdf bundle. Topics like revenue generation 2021, online store, food chain partnership, retail stores can be discussed with this completely editable template. It is available for immediate download depending on the needs and requirements of the user.
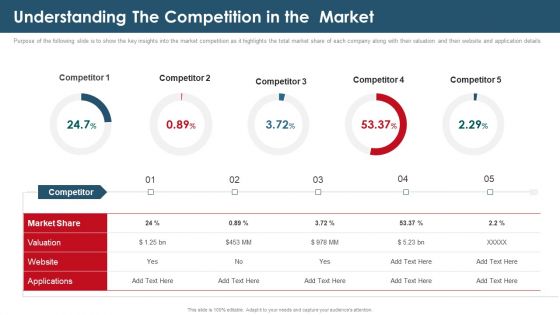
Investor Capital Raising Elevator Understanding The Competition In The Market Mockup PDF
Purpose of the following slide is to show the key insights into the market competition as it highlights the total market share of each company along with their valuation and their website and application details. Deliver an awe inspiring pitch with this creative investor capital raising elevator understanding the competition in the market mockup pdf bundle. Topics like market share, valuation, applications can be discussed with this completely editable template. It is available for immediate download depending on the needs and requirements of the user.
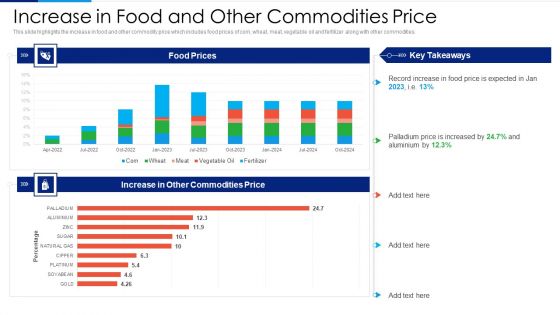
Russia Ukraine Conflict Effect Increase In Food And Other Commodities Price Pictures PDF
This slide highlights the global inflation rises and weakens in global GDP which includes line graph with two scenarios highlighting if disruption is limited and if the military conflict is lengthy. Deliver and pitch your topic in the best possible manner with this Russia Ukraine Conflict Effect Increase In Food And Other Commodities Price Pictures PDF. Use them to share invaluable insights on Global Inflation Rises, Global GDP Weakens, Feb Baseline, Limited Disruption and impress your audience. This template can be altered and modified as per your expectations. So, grab it now.
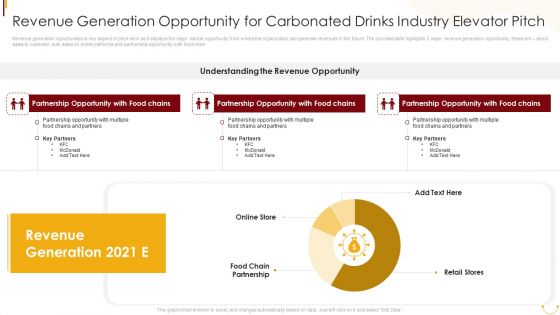
Revenue Generation Opportunity For Carbonated Drinks Industry Elevator Pitch Microsoft PDF
Revenue generation opportunities is key aspect of pitch deck as it displays the major market opportunity from where the organization can generate revenues in the future. The provided slide highlights 3 major revenue generation opportunity, these are direct sales to customer, bulk sales on online platforms and partnership opportunity with food chain. Deliver an awe inspiring pitch with this creative Revenue Generation Opportunity For Carbonated Drinks Industry Elevator Pitch Microsoft PDF bundle. Topics like Understanding Revenue Opportunity, Partnership Opportunity, Food Chains can be discussed with this completely editable template. It is available for immediate download depending on the needs and requirements of the user.
Social Media Performance Tracking And Monitoring Dashboard Mockup PDF
The following slide showcases a dashboard to track and measure social media platforms performance. It includes key elements such as website traffic, social media referral rate, site revenue, social media site revenue, etc. This Social Media Performance Tracking And Monitoring Dashboard Mockup PDF is perfect for any presentation, be it in front of clients or colleagues. It is a versatile and stylish solution for organizing your meetings. The product features a modern design for your presentation meetings. The adjustable and customizable slides provide unlimited possibilities for acing up your presentation. Slidegeeks has done all the homework before launching the product for you. So, do not wait, grab the presentation templates today
Social Media Performance Tracking And Monitoring Dashboard Information PDF
The following slide showcases a dashboard to track and measure social media platforms performance. It includes key elements such as website traffic, social media referral rate, site revenue, social media site revenue, etc. This Social Media Performance Tracking And Monitoring Dashboard Information PDF is perfect for any presentation, be it in front of clients or colleagues. It is a versatile and stylish solution for organizing your meetings. The product features a modern design for your presentation meetings. The adjustable and customizable slides provide unlimited possibilities for acing up your presentation. Slidegeeks has done all the homework before launching the product for you. So, do not wait, grab the presentation templates today

Artificial Intelligence Playbook Stage Three Solution Section Checklist And Its Outcomes Microsoft PDF
Purpose of this slide is to showcases solution selection checklist that can be used by businesses to ensure that AI technology is best fit for their organization and will assist them in meeting the business goals. Deliver and pitch your topic in the best possible manner with this artificial intelligence playbook stage three solution section checklist and its outcomes microsoft pdf. Use them to share invaluable insights on questions related to data, resource related questions, business architecture and impress your audience. This template can be altered and modified as per your expectations. So, grab it now.
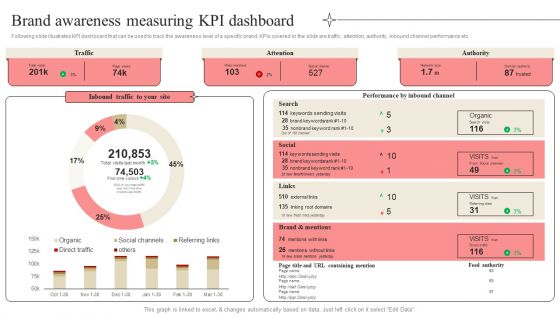
Developing Market Leading Businesses Brand Awareness Measuring KPI Dashboard Themes PDF
Following slide illustrates KPI dashboard that can be used to track the awareness level of a specific brand. KPIs covered in the slide are traffic, attention, authority, inbound channel performance etc. Are you in need of a template that can accommodate all of your creative concepts This one is crafted professionally and can be altered to fit any style. Use it with Google Slides or PowerPoint. Include striking photographs, symbols, depictions, and other visuals. Fill, move around, or remove text boxes as desired. Test out color palettes and font mixtures. Edit and save your work, or work with colleagues. Download Developing Market Leading Businesses Brand Awareness Measuring KPI Dashboard Themes PDF and observe how to make your presentation outstanding. Give an impeccable presentation to your group and make your presentation unforgettable.
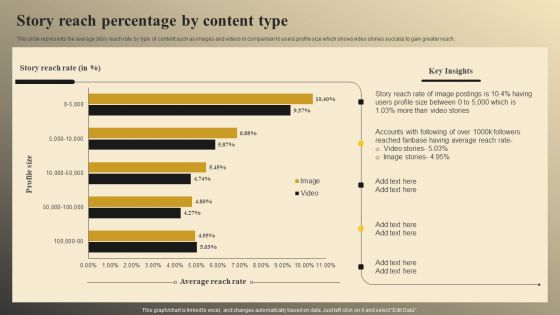
Online Video Model Company Profile Story Reach Percentage By Content Type Pictures PDF
This slide represents the average story reach rate by type of content such as images and videos in comparison to users profile size which shows video stories success to gain greater reach. Coming up with a presentation necessitates that the majority of the effort goes into the content and the message you intend to convey. The visuals of a PowerPoint presentation can only be effective if it supplements and supports the story that is being told. Keeping this in mind our experts created Online Video Model Company Profile Story Reach Percentage By Content Type Pictures PDF to reduce the time that goes into designing the presentation. This way, you can concentrate on the message while our designers take care of providing you with the right template for the situation.

Brand Awareness Measuring KPI Dashboard Ppt Show Format Ideas PDF
Following slide illustrates KPI dashboard that can be used to track the awareness level of a specific brand. KPIs covered in the slide are traffic, attention, authority, inbound channel performance etc. Are you in need of a template that can accommodate all of your creative concepts This one is crafted professionally and can be altered to fit any style. Use it with Google Slides or PowerPoint. Include striking photographs, symbols, depictions, and other visuals. Fill, move around, or remove text boxes as desired. Test out color palettes and font mixtures. Edit and save your work, or work with colleagues. Download Brand Awareness Measuring KPI Dashboard Ppt Show Format Ideas PDF and observe how to make your presentation outstanding. Give an impeccable presentation to your group and make your presentation unforgettable.

 Home
Home