Benefit Infographic
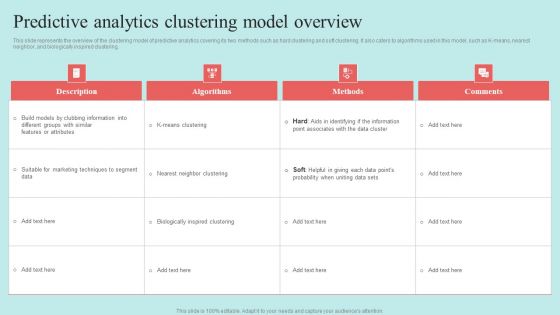
Predictive Data Model Predictive Analytics Clustering Model Overview Infographics PDF

Cybersecurity Operations Cybersecops Checklist For Secops Implementation Infographics PDF
This slide represents the checklist to implement security operations in an organization. The purpose of this slide is to demonstrate the various guidelines to keep in mind while implementing SecOps in a company, including defining the SecOps scope, building repeatable workflows, and so on. Want to ace your presentation in front of a live audience Our Cybersecurity Operations Cybersecops Checklist For Secops Implementation Infographics PDF can help you do that by engaging all the users towards you. Slidegeeks experts have put their efforts and expertise into creating these impeccable powerpoint presentations so that you can communicate your ideas clearly. Moreover, all the templates are customizable, and easy to edit and downloadable. Use these for both personal and commercial use.
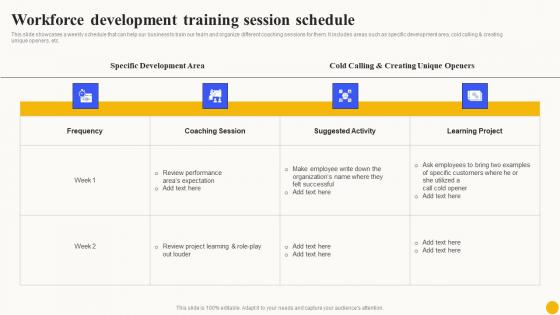
Workforce Development Training Planned Workforce Enhancement Infographics Pdf
This slide showcases a weekly schedule that can help our business to train our team and organize different coaching sessions for them. It includes areas such as specific development area, cold calling creating unique openers, etc.Retrieve professionally designed Workforce Development Training Planned Workforce Enhancement Infographics Pdf to effectively convey your message and captivate your listeners. Save time by selecting pre-made slideshows that are appropriate for various topics, from business to educational purposes. These themes come in many different styles, from creative to corporate, and all of them are easily adjustable and can be edited quickly. Access them as PowerPoint templates or as Google Slides themes. You do not have to go on a hunt for the perfect presentation because Slidegeeks got you covered from everywhere.
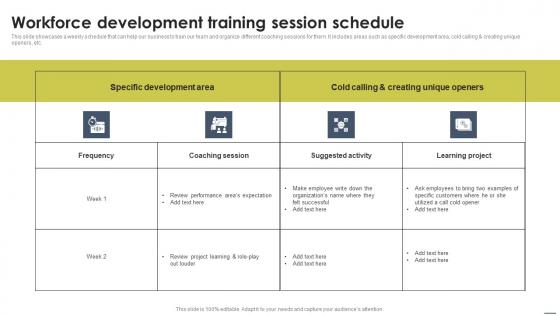
Workforce Development Training Session Schedule Staff Management Approache Infographics Pdf
This slide showcases a weekly schedule that can help our business to train our team and organize different coaching sessions for them. It includes areas such as specific development area, cold calling and creating unique openers, etc. Retrieve professionally designed Workforce Development Training Session Schedule Staff Management Approache Infographics Pdf to effectively convey your message and captivate your listeners. Save time by selecting pre-made slideshows that are appropriate for various topics, from business to educational purposes. These themes come in many different styles, from creative to corporate, and all of them are easily adjustable and can be edited quickly. Access them as PowerPoint templates or as Google Slides themes. You do not have to go on a hunt for the perfect presentation because Slidegeeks got you covered from everywhere.

Market Statistics Insurance Agency Business Automobile Insurance Agency Infographics Pdf
This slide provides a glimpse of industry overview of the insurance agency. The purpose of this slide is concerning with the overview of insurance, its growth, demand and its forecasting in the market. Welcome to our selection of the Market Statistics Insurance Agency Business Automobile Insurance Agency Infographics Pdf. These are designed to help you showcase your creativity and bring your sphere to life. Planning and Innovation are essential for any business that is just starting out. This collection contains the designs that you need for your everyday presentations. All of our PowerPoints are 100 percent editable, so you can customize them to suit your needs. This multi-purpose template can be used in various situations. Grab these presentation templates today.

Audit System Events Ppt PowerPoint Presentation Visual Aids Infographics
This is a audit system events ppt powerpoint presentation visual aids infographics. This is a five stage process. The stages in this process are windows settings, security settings, local policies.

Timeline For Csr Strategy Ppt PowerPoint Presentation Visual Aids Infographics
This is a timeline for csr strategy ppt powerpoint presentation visual aids infographics. This is a two stage process. The stages in this process are Strategic, planning, timeline, strategy, business, management.

Who Is Your Buyer Ppt PowerPoint Presentation Visual Aids Infographics
This is a who is your buyer ppt powerpoint presentation visual aids infographics. This is a six stage process. The stages in this process are demographics, psychographics, biographies, relationships, motivation.

Customer Acquisition Management Ppt PowerPoint Presentation Visual Aids Infographics
This is a customer acquisition management ppt powerpoint presentation visual aids infographics. This is a four stage process. The stages in this process are build connections, response management, execute campaigns, data.

Our Location Global Presence Ppt PowerPoint Presentation Visual Aids Infographics
This is a our location global presence ppt powerpoint presentation visual aids infographics. This is a one stage process. The stages in this process are business, marketing, strategy, location, planning.
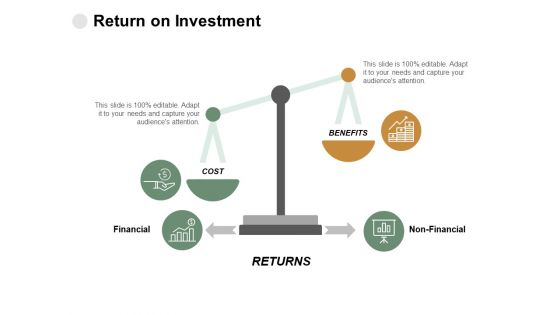
Return On Investment Ppt PowerPoint Presentation Visual Aids Infographics
This is a return on investment ppt powerpoint presentation visual aids infographics. This is a three stage process. The stages in this process are finance, analysis, business, investment, marketing.

Our Team Communication Ppt PowerPoint Presentation Visual Aids Infographics
This is a our team communication ppt powerpoint presentation visual aids infographics. This is a three stage process. The stages in this process are our team, communication, management, business, planning.

Infographics Options Banner For Web Design Powerpoint Template
This PowerPoint template has been designed with arrow options banners. This PowerPoint template may be used to align business activities. Prove the viability of your ideas using this impressive slide.
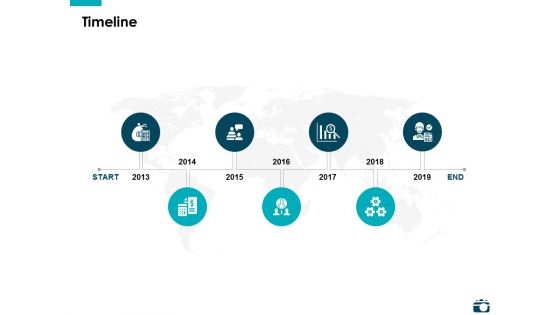
Timeline 2013 To 2019 Ppt PowerPoint Presentation Visual Aids Infographics
Presenting this set of slides with name timeline 2013 to 2019 ppt powerpoint presentation visual aids infographics. This is a seven stage process. The stages in this process are timeline, process, management, planning, business. This is a completely editable PowerPoint presentation and is available for immediate download. Download now and impress your audience.

Roadmap Process Marketing Ppt PowerPoint Presentation Visual Aids Infographics
Presenting this set of slides with name roadmap process marketing ppt powerpoint presentation visual aids infographics. This is a six stage process. The stages in this process are timeline, business, planning, management, process. This is a completely editable PowerPoint presentation and is available for immediate download. Download now and impress your audience.

Business Diagram Infographics Design With Five Options Presentation Template
Five staged info graphics has been used to craft this power point template diagram. This PPT diagram contains the concept of data flow and data technology. Use this PPT for business and data related presentations.

Business Diagram Infographics Design With Four Options Presentation Template
Four staged info graphics has been used to design this power point template. This PPT diagram contains the concept of data flow. Use this PPT for business and marketing data related topics in any presentation.
Business Diagram Infographics Design With Six Options Presentation Template
Graphic of six staged info graphics has been used to design this power point template. This PPT diagram contains the concept of data flow and representation. Use this PPT for data technology related presentations.

Business Diagram Infographics Design With Three Options Presentation Template
Three staged info graphics has been used to craft this power point template diagram. This PPT diagram contains the concept of data flow and storage. Use this PPT for business and data related presentations.

Competitor Comparison Template 1 Ppt PowerPoint Presentation Pictures Infographics
This is a competitor comparison template 1 ppt powerpoint presentation pictures infographics. This is a five stage process. The stages in this process are competitor, profit, revenue.
Building Maintenance Icon Ppt Powerpoint Presentation Slides Infographics
This is a building maintenance icon ppt powerpoint presentation slides infographics. This is a three stage process. The stages in this process are fm, facilities management, support management.

Summary Financials Revenue Ebitda Pat Ppt PowerPoint Presentation Outline Infographics
This is a summary financials revenue ebitda pat ppt powerpoint presentation outline infographics. This is a three stage process. The stages in this process are revenue and gross profit, ebitda and ebitda margin, pat and pat margin, business, marketing.

Identify The Risk Categories Ppt PowerPoint Presentation Professional Infographics
This is a identify the risk categories ppt powerpoint presentation professional infographics. This is a three stage process. The stages in this process are business, marketing, financial, operational, strategic, profitable growth.
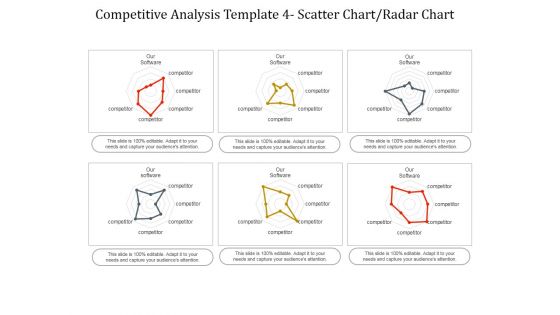
Competitive Analysis Scatter Chart Radar Chart Ppt PowerPoint Presentation Infographics
This is a competitive analysis scatter chart radar chart ppt powerpoint presentation infographics. This is a eight stage process. The stages in this process are users interface, data import, example, pricing, support, update, tutorials, easy to use.
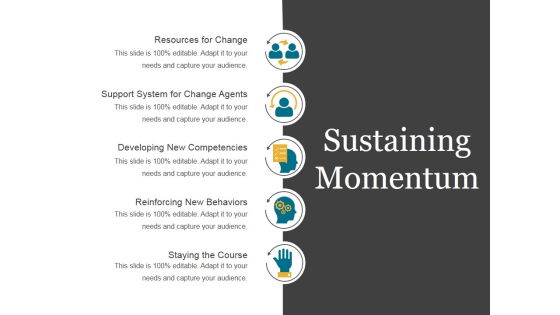
Sustaining Momentum Template 2 Ppt PowerPoint Presentation Infographics
This is a sustaining momentum template 2 ppt powerpoint presentation infographics. This is a five stage process. The stages in this process are resources for change, support system for change agents, developing new competencies, reinforcing new behaviors, staying the course.
Direct Sales Strategy Ppt PowerPoint Presentation Visual Aids Infographics
This is a business entity form ppt powerpoint presentation model clipart images. This is a six stage process. The stages in this process are business entity form.
Mobile Customer Retention Ppt PowerPoint Presentation Model Infographics
Presenting this set of slides with name mobile customer retention ppt powerpoint presentation model infographics. This is an editable Powerpoint four stages graphic that deals with topics like mobile customer retention to help convey your message better graphically. This product is a premium product available for immediate download, and is 100 percent editable in Powerpoint. Download this now and use it in your presentations to impress your audience.
Team Building Experiences Ppt PowerPoint Presentation File Infographics
Presenting this set of slides with name team building experiences ppt powerpoint presentation file infographics. This is an editable Powerpoint five stages graphic that deals with topics like team building experiences to help convey your message better graphically. This product is a premium product available for immediate download, and is 100 percent editable in Powerpoint. Download this now and use it in your presentations to impress your audience.
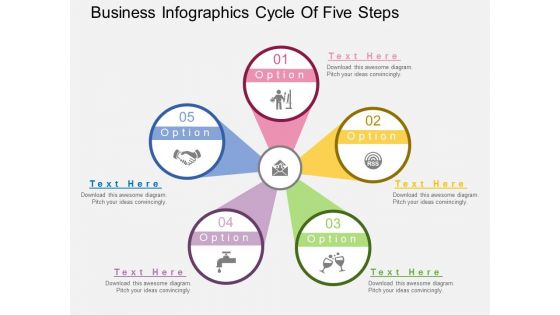
Business Infographics Cycle Of Five Steps Powerpoint Template
Our above business slide has been designed with cycle diagram of five options. This slide is suitable to present business management and strategy. Use our creative PowerPoint template to lay down your views.
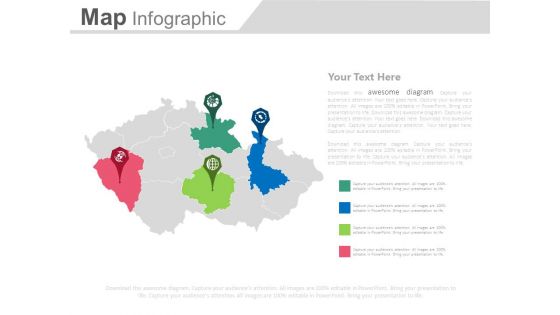
Map Infographics With Four Location Pointers Powerpoint Slides
This professionally designed PowerPoint template is as an effective tool for geography related presentations. You can download this diagram to visually support your content. Above PPT slide is suitable for business presentation.
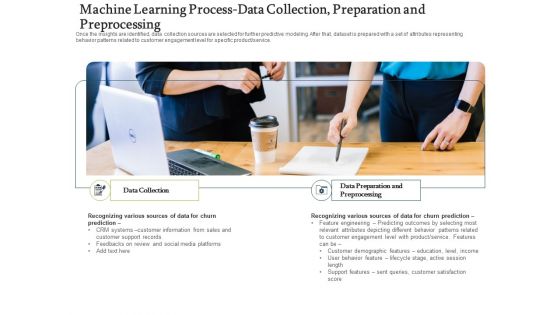
Machine Learning Process Data Collection Preparation And Preprocessing Infographics PDF
Presenting forecasting managing consumer attrition business advantage acquisition strategy churned customer sample pdf to provide visual cues and insights. Share and navigate important information on two stages that need your due attention. This template can be used to pitch topics like recognizing various sources of data for churn prediction, recognizing various sources of data for churn prediction, data preparation and preprocessing. In addtion, this PPT design contains high resolution images, graphics, etc, that are easily editable and available for immediate download.
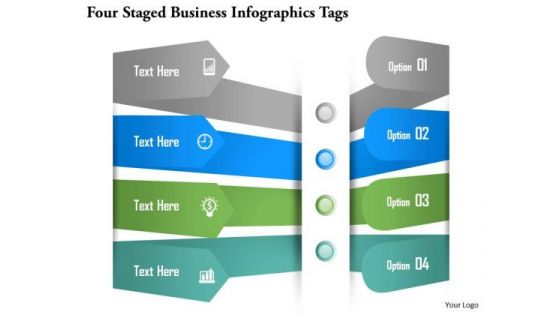
Business Diagram Four Staged Business Infographics Tags Presentation Template
Download this diagram to display business development strategies, business plans, decisions, and stages. This Business PowerPoint diagram contains graphics of four options text boxes with icons. Present your views using this innovative slide and be assured of leaving a lasting impression.

Bar Graph Infographics For Business Analysis Powerpoint Template
This PowerPoint template contains bar graph with icons. This PPT slide helps to exhibit concepts like strategy, direction and success. Use this business slide to make impressive presentations.

Interviewing Tips Managers Ppt PowerPoint Presentation Show Infographics Cpb
Presenting this set of slides with name interviewing tips managers ppt powerpoint presenta. This is an editable Powerpoint four stages graphic that deals with topics like interviewing tips managers to help convey your message better graphically. This product is a premium product available for immediate download and is 100 percent editable in Powerpoint. Download this now and use it in your presentations to impress your audience.
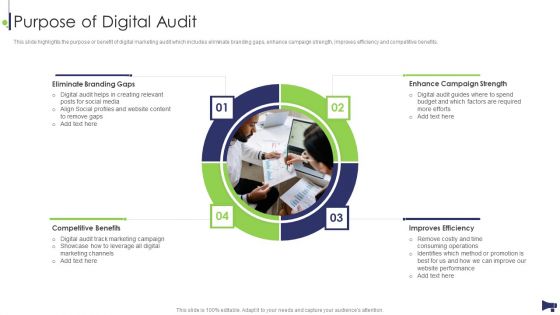
Website And Social Media Purpose Of Digital Audit Ppt Infographics Backgrounds PDF
This slide highlights the purpose or benefit of digital marketing audit which includes eliminate branding gaps, enhance campaign strength, improves efficiency and competitive benefits. This is a Website And Social Media Purpose Of Digital Audit Ppt Infographics Backgrounds PDF template with various stages. Focus and dispense information on four stages using this creative set, that comes with editable features. It contains large content boxes to add your information on topics like Eliminate Branding Gaps, Competitive Benefits, Improves Efficiency, Enhance Campaign Strength. You can also showcase facts, figures, and other relevant content using this PPT layout. Grab it now.
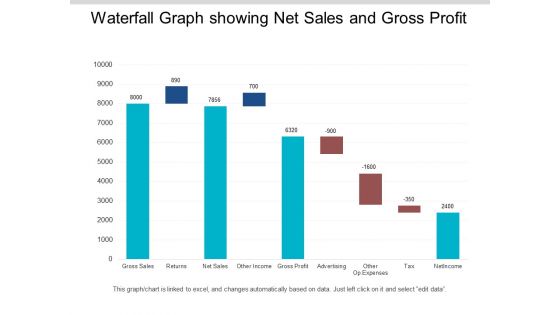
Waterfall Graph Showing Net Sales And Gross Profit Ppt PowerPoint Presentation Infographics Format
This is a waterfall graph showing net sales and gross profit ppt powerpoint presentation infographics format. This is a three stage process. The stages in this process are profit and loss, balance sheet, income statement, benefit and loss.
Three Types Of Economic Analysis With Icons Ppt PowerPoint Presentation Infographics Template PDF
Presenting this set of slides with name three types of economic analysis with icons ppt powerpoint presentation infographics template pdf. This is a three stage process. The stages in this process are cost benefit analysis, cost effective analysis, weigh effectiveness, cost minimization analysis. This is a completely editable PowerPoint presentation and is available for immediate download. Download now and impress your audience.
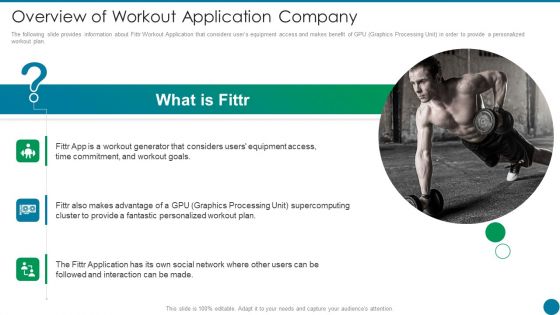
Overview Of Workout Application Company Ppt PowerPoint Presentation Infographics Graphic Tips PDF
The following slide provides information about Fittr Workout Application that considers users equipment access and makes benefit of GPU Graphics Processing Unit in order to provide a personalized workout plan. Deliver an awe inspiring pitch with this creative Overview Of Workout Application Company Ppt PowerPoint Presentation Infographics Graphic Tips PDF bundle. Topics like Workout Generator, Fantastic Personalized, Graphics Processing can be discussed with this completely editable template. It is available for immediate download depending on the needs and requirements of the user.
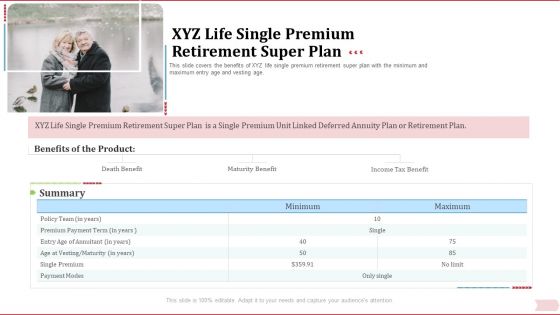
Key Factor In Retirement Planning XYZ Life Single Premium Retirement Super Plan Infographics PDF
This slide covers the benefits of XYZ life single premium retirement super plan with the minimum and maximum entry age and vesting age. Deliver and pitch your topic in the best possible manner with this key factor in retirement planning xyz life single premium retirement super plan infographics pdf. Use them to share invaluable insights on death benefit, maturity benefit, income tax and impress your audience. This template can be altered and modified as per your expectations. So, grab it now.

Pension Plan XYZ Life Single Premium Retirement Super Plan Ppt Layouts Infographics PDF
This slide covers the benefits of XYZ life single premium retirement super plan with the minimum and maximum entry age and vesting age. Deliver and pitch your topic in the best possible manner with this pension plan xyz life single premium retirement super plan ppt layouts infographics pdf. Use them to share invaluable insights on death benefit, maturity benefit, income tax and impress your audience. This template can be altered and modified as per your expectations. So, grab it now.
Eight Vs Of Big Data Profiling Solutions Ppt Infographics Icon PDF
This slide showcase eight vs of big fata profiling which can benefit IT firms in integrating various practices and techniques to handle data quality aspects. It contains information about volume, value, veracity, visualization, variety, velocity, viscosity and virality. Persuade your audience using this Eight Vs Of Big Data Profiling Solutions Ppt Infographics Icon PDF. This PPT design covers eight stages, thus making it a great tool to use. It also caters to a variety of topics including Virality, Viscosity, Velocity, Variety. Download this PPT design now to present a convincing pitch that not only emphasizes the topic but also showcases your presentation skills.
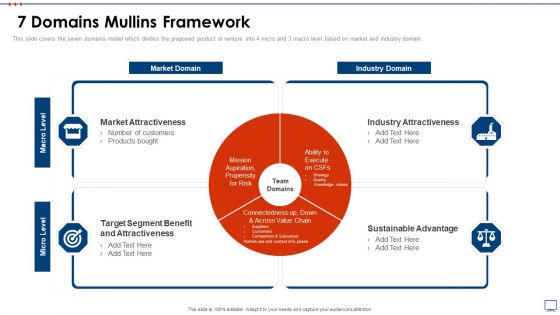
Strategic Business Plan Effective Tools 7 Domains Mullins Framework Infographics PDF
This slide covers the seven domains model which divides the proposed product or venture into 4 micro and 3 macro level based on market and industry domain. Presenting strategic business plan effective tools 7 domains mullins framework infographics pdf to provide visual cues and insights. Share and navigate important information on four stages that need your due attention. This template can be used to pitch topics like market attractiveness, industry attractiveness, target segment benefit and attractiveness, sustainable advantage. In addtion, this PPT design contains high resolution images, graphics, etc, that are easily editable and available for immediate download.

What Can Quantum Computing Do To Healthcare Ppt Infographics Templates PDF
This slide represents the use of quantum computers in the healthcare field and how it will benefit scientists, patients, and researchers in invention and experiment. This is a What Can Quantum Computing Do To Healthcare Ppt Infographics Templates PDF template with various stages. Focus and dispense information on five stages using this creative set, that comes with editable features. It contains large content boxes to add your information on topics like Sequencing And Analyzing, Decision Support Network, Supersonic Medication Plan. You can also showcase facts, figures, and other relevant content using this PPT layout. Grab it now.

Online Reviews For Building Customer Confidence Consumer Contact Point Guide Infographics PDF
This slide covers the benefit of using online reviews for improved customer trust. It also includes key insights such as clients trusting online reviews as much as personal recommendations, companies losing customers due to unfavorable articles, the weightage of online reviews, etc. From laying roadmaps to briefing everything in detail, our templates are perfect for you. You can set the stage with your presentation slides. All you have to do is download these easy-to-edit and customizable templates. Online Reviews For Building Customer Confidence Consumer Contact Point Guide Infographics PDF will help you deliver an outstanding performance that everyone would remember and praise you for. Do download this presentation today.
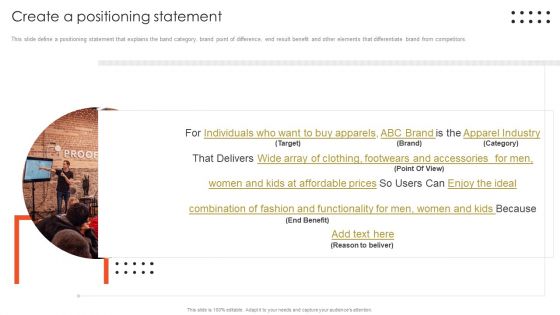
Retail Marketing Campaign Effective Techniques Create A Positioning Statement Infographics PDF
This slide define a positioning statement that explains the band category, brand point of difference, end result benefit and other elements that differentiate brand from competitors. From laying roadmaps to briefing everything in detail, our templates are perfect for you. You can set the stage with your presentation slides. All you have to do is download these easy to edit and customizable templates. Retail Marketing Campaign Effective Techniques Create A Positioning Statement Infographics PDF will help you deliver an outstanding performance that everyone would remember and praise you for. Do download this presentation today.

Strategy To Be Adopted 3 Use Warehousing Services Ppt Infographics Display PDF
This slide shows the strategy to be adopted by the company i.e. Use Warehousing Services along with the need of such strategy and how it is to be implemented that will give benefit to the company. Deliver an awe inspiring pitch with this creative strategy to be adopted 3 use warehousing services ppt infographics display pdf bundle. Topics like budget, equipment, expense, warehousing, customers can be discussed with this completely editable template. It is available for immediate download depending on the needs and requirements of the user.
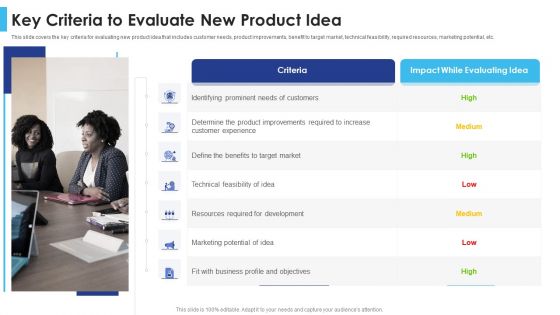
Satisfying Consumers Through Strategic Product Building Plan Key Criteria To Evaluate New Product Idea Infographics PDF
This slide covers the key criteria for evaluating new product idea that includes customer needs, product improvements, benefit to target market, technical feasibility, required resources, marketing potential, etc. Presenting satisfying consumers through strategic product building plan key criteria to evaluate new product idea infographics pdf to provide visual cues and insights. Share and navigate important information on seven stages that need your due attention. This template can be used to pitch topics like key criteria to evaluate new product idea. In addtion, this PPT design contains high resolution images, graphics, etc, that are easily editable and available for immediate download.

Impact On IT Department Business Operational Expenditure Post Introducing Cloud Computing Infographics PDF
This slide showcases impact on information technology IT department operating expenses OPEX post introduction of cloud computing which can benefit them in evaluating affects and making related changes to their budget for technology. It includes information about hardware, software, repair and maintenance, backup and disaster recovery, storage, etc. Showcasing this set of slides titled Impact On IT Department Business Operational Expenditure Post Introducing Cloud Computing Infographics PDF. The topics addressed in these templates are Software, Hardware, Storage. All the content presented in this PPT design is completely editable. Download it and make adjustments in color, background, font etc. as per your unique business setting.

Key Statistics Of Artifical Intelligence Advantages To Improve Business Efficiency Infographics PDF
This slide signifies the key statistics of artificial intelligence benefits used to increase organisation efficiency. It covers information about optimizing internal operations, task automation, new market and better decision making Showcasing this set of slides titled Key Statistics Of Artifical Intelligence Advantages To Improve Business Efficiency Infographics PDF. The topics addressed in these templates are Greatest AI Benefit, Managers Stated, Benefits External Processes. All the content presented in this PPT design is completely editable. Download it and make adjustments in color, background, font etc. as per your unique business setting.
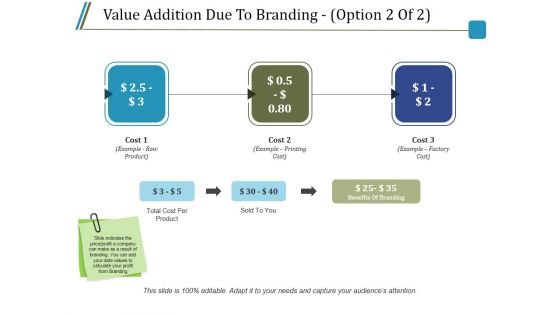
Value Addition Due To Branding Template 2 Ppt PowerPoint Presentation Infographics Background Images
This is a value addition due to branding template 2 ppt powerpoint presentation infographics background images. This is a three stage process. The stages in this process are total cost per product, sold to you, benefits of branding, cost.
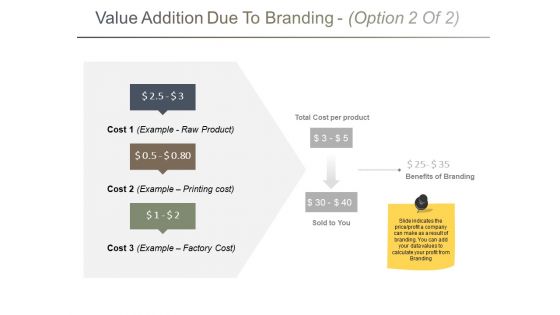
Value Addition Due To Branding Template 2 Ppt PowerPoint Presentation Infographics Influencers
This is a value addition due to branding template 2 ppt powerpoint presentation infographics influencers. This is a three stage process. The stages in this process are cost per product, sold to you, benefits of branding, business, finance, marketing.

Value Addition Due To Branding Template 2 Ppt PowerPoint Presentation Infographics Model
This is a value addition due to branding template 2 ppt powerpoint presentation infographics model. This is a three stage process. The stages in this process are total cost per product, sold to you, benefits of branding, cost.
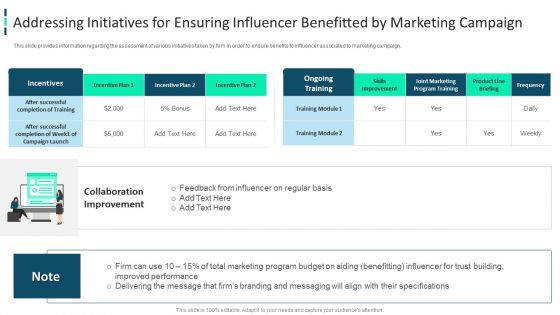
Improving Brand Awareness Through WOM Marketing Addressing Initiatives For Ensuring Infographics PDF
This slide provides information regarding the assessment of various initiatives taken by firm in order to ensure benefits to influencer associated to marketing campaign. Deliver an awe inspiring pitch with this creative improving brand awareness through wom marketing addressing initiatives for ensuring infographics pdf bundle. Topics like addressing initiatives for ensuring influencer benefitted by marketing campaign can be discussed with this completely editable template. It is available for immediate download depending on the needs and requirements of the user.

How AI And Machine Learning Can Revolutionize Sales And Marketing Infographics PDF
This template covers the benefits of AI for the Sales and Marketing team. AI and Machine Learning benefits in the area of lead quality, engagement, and better understanding of buyer intent.Deliver an awe inspiring pitch with this creative How AI And Machine Learning Can Revolutionize Sales And Marketing Infographics PDF bundle. Topics like Anticipated Emotions, Strategies To Enhance, Index Recommend can be discussed with this completely editable template. It is available for immediate download depending on the needs and requirements of the user.
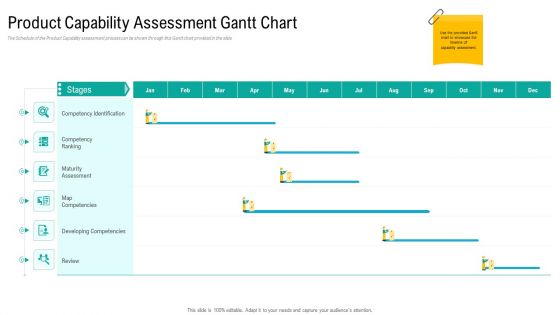
Product USP Product Capability Assessment Gantt Chart Ppt Infographics Pictures PDF
The Schedule of the Product Capability assessment process can be shown through this Gantt chart provided in the slide. Elucidate your project plan using our product usp product capability assessment gantt chart ppt infographics pictures pdf. Capture the timeframe for every release by outlining crucial details like project beginning and end date, status, and assigned team. Establish coordination with other team members, share your product plans, and discuss the project progress with the executives using this template. Furthermore, this task management chart helps you align your activities efficiently. Utilize the versatile nature of this template to initiate high-level resource planning and implement it flexibly for the benefit of your business. The slide is easy-to-edit so download it and schedule your projects resourcefully.

Strategy To Be Adopted 1 Customer Loyalty And Reward Program Infographics PDF
This slide shows the strategy to be adopted by the company i.e. Implement Customer Loyalty and Reward Programs to improve relationship building and help to improve Customer Retention Rate along with the need of such strategy and how it is to be implemented that will give benefit to the company.This is a strategy to be adopted 1 customer loyalty and reward program infographics pdf. template with various stages. Focus and dispense information on three stages using this creative set, that comes with editable features. It contains large content boxes to add your information on topics like the company must implement customer loyalty and reward, develop a loyalty program. You can also showcase facts, figures, and other relevant content using this PPT layout. Grab it now.

Strategy To Be Adopted 2 Contract With A Logistic Supplier Necessary Infographics PDF
This slide shows the strategy to be adopted by the company i.e. Enter into a Contract with an External Logistic Supplier minimize outsourcing costs along with the need of such strategy and how it is to be implemented that will give benefit to the company.Presenting strategy to be adopted 2 contract with a logistic supplier necessary infographics pdf. to provide visual cues and insights. Share and navigate important information on three stages that need your due attention. This template can be used to pitch topics like strategy to be adopted 2 contract with a logistic supplier. In addtion, this PPT design contains high resolution images, graphics, etc, that are easily editable and available for immediate download.
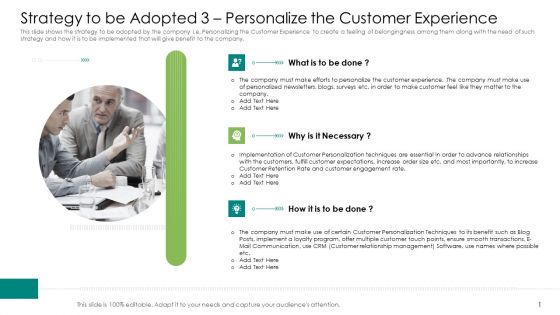
Strategy To Be Adopted 3 Personalize The Customer Experience Ppt Infographics Graphics Template PDF
This slide shows the strategy to be adopted by the company i.e. Personalizing the Customer Experience to create a feeling of belongingness among them along with the need of such strategy and how it is to be implemented that will give benefit to the company.This is a strategy to be adopted 3 personalize the customer experience ppt infographics graphics template pdf. template with various stages. Focus and dispense information on three stages using this creative set, that comes with editable features. It contains large content boxes to add your information on topics like strategy to be adopted 3 personalize the customer experience. You can also showcase facts, figures, and other relevant content using this PPT layout. Grab it now.
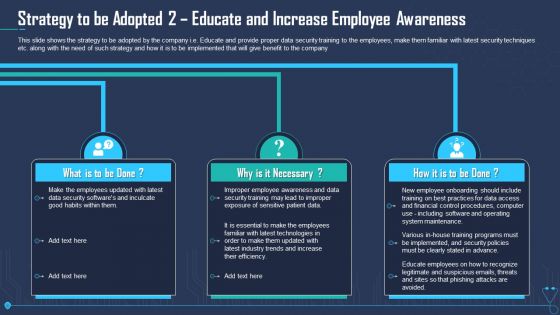
Strategy To Be Adopted 2 Educate And Increase Employee Awareness Infographics PDF
This slide shows the strategy to be adopted by the company i.e. Educate and provide proper data security training to the employees, make them familiar with latest security techniques etc. along with the need of such strategy and how it is to be implemented that will give benefit to the company. Presenting strategy to be adopted 2 educate and increase employee awareness infographics pdf to provide visual cues and insights. Share and navigate important information on three stages that need your due attention. This template can be used to pitch topics like strategy to be adopted 2 educate and increase employee awareness. In addtion, this PPT design contains high resolution images, graphics, etc, that are easily editable and available for immediate download.

Artificial Intelligence Applications Uses In Various Sectors And Their Advantages Infographics PDF
This slide signifies the AI application and benefits in different industry. It covers information about sectors like automobile, agriculture, ecommerce, healthcare and surveillance along with AI uses and benefits Pitch your topic with ease and precision using this Artificial Intelligence Applications Uses In Various Sectors And Their Advantages Infographics PDF. This layout presents information on Automobile, Agriculture, E Commerce. It is also available for immediate download and adjustment. So, changes can be made in the color, design, graphics or any other component to create a unique layout.

 Home
Home