Analytics
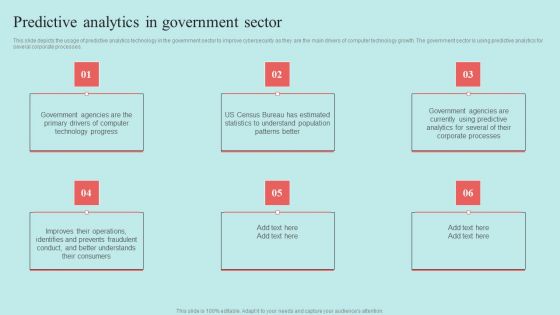
Predictive Data Model Predictive Analytics In Government Sector Graphics PDF
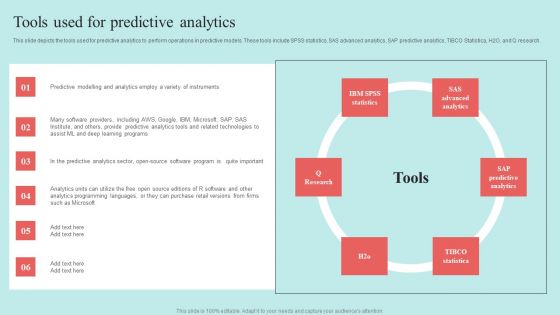
Predictive Data Model Tools Used For Predictive Analytics Download PDF

Graphical Representation Of Research IT Visual Analytics Branch Background PDF
This slide shows visual analytics, the last branch of visualization research, which emerged from the advancements in the other two branches and mainly focused on analytical reasoning. This is a graphical representation of research it visual analytics branch background pdf template with various stages. Focus and dispense information on five stages using this creative set, that comes with editable features. It contains large content boxes to add your information on topics like visual analytics branch of visualization research. You can also showcase facts, figures, and other relevant content using this PPT layout. Grab it now.

Industries Served Data Analytics Company Outline Inspiration PDF
The following slide highlights the research services offered by Kantar company to the media industry. It also shows the clients and impact of solutions provided. The best PPT templates are a great way to save time, energy, and resources. Slidegeeks have 100 percent editable powerpoint slides making them incredibly versatile. With these quality presentation templates, you can create a captivating and memorable presentation by combining visually appealing slides and effectively communicating your message. Download Industries Served Data Analytics Company Outline Inspiration PDF from Slidegeeks and deliver a wonderful presentation.
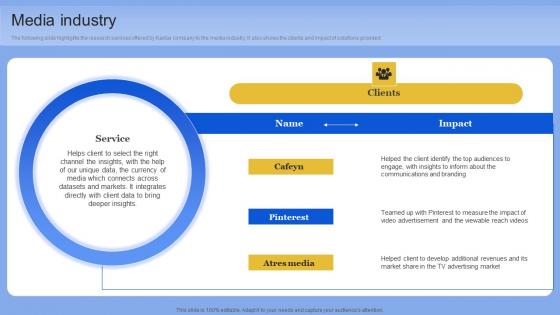
Media Industry Data Analytics Company Outline Structure PDF
The following slide highlights the research services offered by Kantar company to the media industry. It also shows the clients and impact of solutions provided. The Media Industry Data Analytics Company Outline Structure PDF is a compilation of the most recent design trends as a series of slides. It is suitable for any subject or industry presentation, containing attractive visuals and photo spots for businesses to clearly express their messages. This template contains a variety of slides for the user to input data, such as structures to contrast two elements, bullet points, and slides for written information. Slidegeeks is prepared to create an impression.

Top Clients Data Analytics Company Outline Pictures PDF
The slide highlights the business clients for company marketing research and insights services. The clients include Google, Facebook, Qualtrics, Alibaba group, samba tv, Twitter, NDR, Hulu, snap.inc, Medallia, comScore, affective, conexance, eyeota, liveramp and Acxiom Find a pre-designed and impeccable Top Clients Data Analytics Company Outline Pictures PDF The templates can ace your presentation without additional effort. You can download these easy-to-edit presentation templates to make your presentation stand out from others. So, what are you waiting for Download the template from Slidegeeks today and give a unique touch to your presentation.

Technology Analytics Using Splunk Big Data Microsoft Pdf
Following slide highlights technology analysis with splunk big data. The purpose of this slide is to improve the user experience by enhancing security and improving the user interface. It includes elements such as customer experience, IT performance, compliance, etc. Pitch your topic with ease and precision using this Technology Analytics Using Splunk Big Data Microsoft Pdf This layout presents information on Customer Experience, Security, Compliance It is also available for immediate download and adjustment. So, changes can be made in the color, design, graphics or any other component to create a unique layout.

Analytics Based Marketing Implementation Strategy For Online Brand Topics Pdf
This slide show steps to implement data driven marketing strategy for online brand to ensure customer retention and increase customer traffic. It include step such as create strategy, collect data and execute strategies etc.Pitch your topic with ease and precision using this Analytics Based Marketing Implementation Strategy For Online Brand Topics Pdf This layout presents information on Market Segmentation, Understand Customer Persons, Map Customer Journey It is also available for immediate download and adjustment. So, changes can be made in the color, design, graphics or any other component to create a unique layout.

Business Model Cloud Based Predictive Analytics Software Pitch Deck
This slide covers various business model canvas of Cyclica technology highlighting how the business operates. It includes the revenue earned by the business through strategic partnership, licenses and collaboration with different companies. Boost your pitch with our creative Business Model Cloud Based Predictive Analytics Software Pitch Deck. Deliver an awe-inspiring pitch that will mesmerize everyone. Using these presentation templates you will surely catch everyones attention. You can browse the ppts collection on our website. We have researchers who are experts at creating the right content for the templates. So you do not have to invest time in any additional work. Just grab the template now and use them.
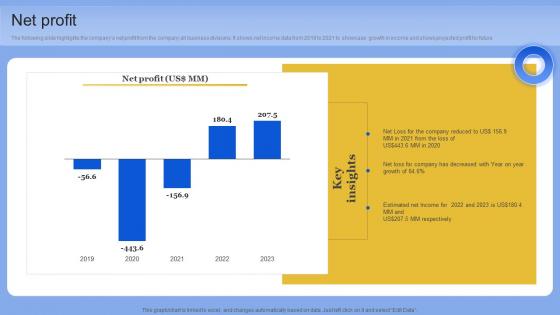
Net Profit Data Analytics Company Outline Diagrams PDF
The following slide highlights the companys net profit from the company all business divisions. It shows net income data from 2019 to 2021 to showcase growth in income and shows projected profit for future. Retrieve professionally designed Net Profit Data Analytics Company Outline Diagrams PDF to effectively convey your message and captivate your listeners. Save time by selecting pre-made slideshows that are appropriate for various topics, from business to educational purposes. These themes come in many different styles, from creative to corporate, and all of them are easily adjustable and can be edited quickly. Access them as PowerPoint templates or as Google Slides themes. You do not have to go on a hunt for the perfect presentation because Slidegeeks got you covered from everywhere.
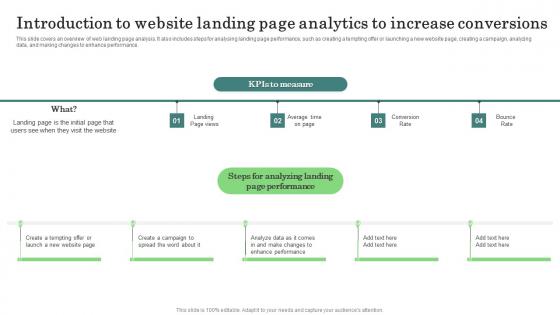
Introduction Website Landing Major Promotional Analytics Future Trends Pictures Pdf
This slide covers an overview of web landing page analysis. It also includes steps for analysing landing page performance, such as creating a tempting offer or launching a new website page, creating a campaign, analyzing data, and making changes to enhance performance. Welcome to our selection of the Introduction Website Landing Major Promotional Analytics Future Trends Pictures Pdf. These are designed to help you showcase your creativity and bring your sphere to life. Planning and Innovation are essential for any business that is just starting out. This collection contains the designs that you need for your everyday presentations. All of our PowerPoints are 100 percent editable, so you can customize them to suit your needs. This multi purpose template can be used in various situations. Grab these presentation templates today

Org Structure Cloud Based Predictive Analytics Software Pitch Deck
This slide covers organizational structure of Cyclica to understand authority-responsibility flow. It includes cofounder, CFO, CIO, CPO, chief partnership officer, general counsel, partner success, VP of marketing, and team member. Are you in need of a template that can accommodate all of your creative concepts This one is crafted professionally and can be altered to fit any style. Use it with Google Slides or PowerPoint. Include striking photographs, symbols, depictions, and other visuals. Fill, move around, or remove text boxes as desired. Test out color palettes and font mixtures. Edit and save your work, or work with colleagues. Download Org Structure Cloud Based Predictive Analytics Software Pitch Deck and observe how to make your presentation outstanding. Give an impeccable presentation to your group and make your presentation unforgettable.

Exit Strategy Financial Analytics Platform Investor Elevator Pitch Deck
This slide displays the exit strategy of the organization which helps in reducing risk. These strategies include merger and acquisition, management buyout, and initial public offering. Do you know about Slidesgeeks Exit Strategy Financial Analytics Platform Investor Elevator Pitch Deck These are perfect for delivering any kind od presentation. Using it, create PowerPoint presentations that communicate your ideas and engage audiences. Save time and effort by using our pre-designed presentation templates that are perfect for a wide range of topic. Our vast selection of designs covers a range of styles, from creative to business, and are all highly customizable and easy to edit. Download as a PowerPoint template or use them as Google Slides themes.
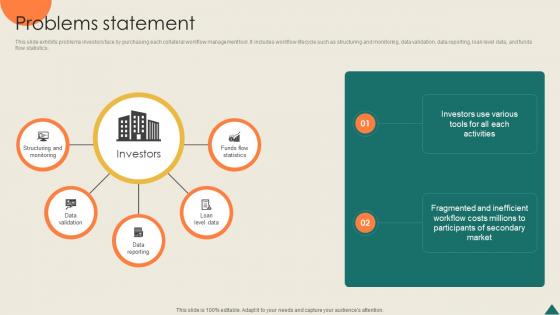
Problems Statement Financial Analytics Platform Investor Elevator Pitch Deck
This slide exhibits problems investors face by purchasing each collateral workflow management tool. It includes workflow lifecycle such as structuring and monitoring, data validation, data reporting, loan level data, and funds flow statistics. Slidegeeks is here to make your presentations a breeze with Problems Statement Financial Analytics Platform Investor Elevator Pitch Deck With our easy-to-use and customizable templates, you can focus on delivering your ideas rather than worrying about formatting. With a variety of designs to choose from, you are sure to find one that suits your needs. And with animations and unique photos, illustrations, and fonts, you can make your presentation pop. So whether you are giving a sales pitch or presenting to the board, make sure to check out Slidegeeks first
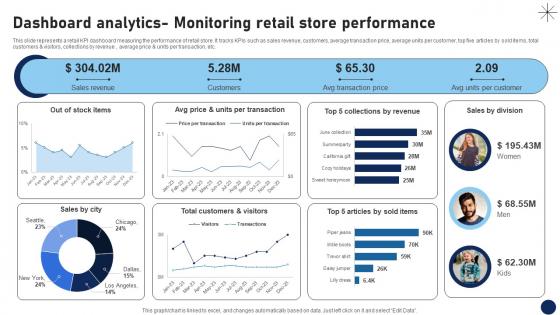
Dashboard Analytics Monitoring Retail Store Performance DT SS V
This slide represents a retail KPI dashboard measuring the performance of retail store. It tracks KPIs such as sales revenue, customers, average transaction price, average units per customer, top five articles by sold items, total customers and visitors, collections by revenue , average price and units per transaction, etc.Are you in need of a template that can accommodate all of your creative concepts This one is crafted professionally and can be altered to fit any style. Use it with Google Slides or PowerPoint. Include striking photographs, symbols, depictions, and other visuals. Fill, move around, or remove text boxes as desired. Test out color palettes and font mixtures. Edit and save your work, or work with colleagues. Download Dashboard Analytics Monitoring Retail Store Performance DT SS V and observe how to make your presentation outstanding. Give an impeccable presentation to your group and make your presentation unforgettable.

Financial Projections Big Data Analytics Investor Funding Elevator Pitch Deck
This slide highlights the anticipated sales revenue based on past data and economic trends. It includes elements such as actual revenue, and forecasted revenue. Slidegeeks is here to make your presentations a breeze with Financial Projections Big Data Analytics Investor Funding Elevator Pitch Deck With our easy-to-use and customizable templates, you can focus on delivering your ideas rather than worrying about formatting. With a variety of designs to choose from, you are sure to find one that suits your needs. And with animations and unique photos, illustrations, and fonts, you can make your presentation pop. So whether you are giving a sales pitch or presenting to the board, make sure to check out Slidegeeks first
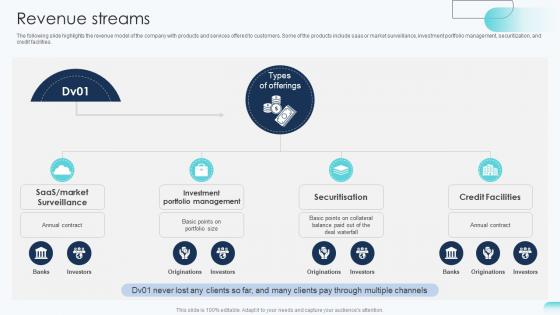
Revenue Streams Big Data Analytics Investor Funding Elevator Pitch Deck
The following slide highlights the revenue model of the company with products and services offered to customers. Some of the products include saas or market surveillance, investment portfolio management, securitization, and credit facilities. This modern and well-arranged Revenue Streams Big Data Analytics Investor Funding Elevator Pitch Deck provides lots of creative possibilities. It is very simple to customize and edit with the Powerpoint Software. Just drag and drop your pictures into the shapes. All facets of this template can be edited with Powerpoint, no extra software is necessary. Add your own material, put your images in the places assigned for them, adjust the colors, and then you can show your slides to the world, with an animated slide included.
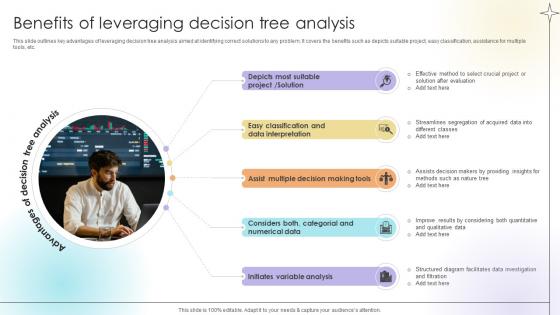
Benefits Of Leveraging Decision Tree Analysis Data Analytics SS V
This slide outlines key advantages of leveraging decision tree analysis aimed at identifying correct solutions to any problem. It covers the benefits such as depicts suitable project, easy classification, assistance for multiple tools, etc.Coming up with a presentation necessitates that the majority of the effort goes into the content and the message you intend to convey. The visuals of a PowerPoint presentation can only be effective if it supplements and supports the story that is being told. Keeping this in mind our experts created Benefits Of Leveraging Decision Tree Analysis Data Analytics SS V to reduce the time that goes into designing the presentation. This way, you can concentrate on the message while our designers take care of providing you with the right template for the situation.
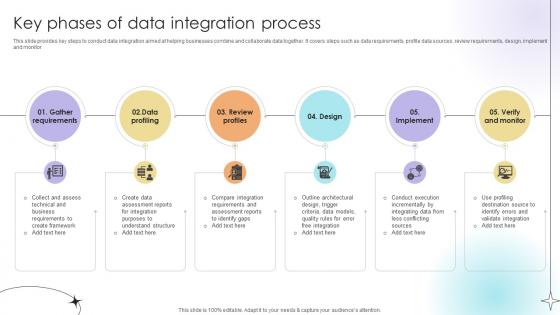
Key Phases Of Data Integration Process Data Analytics SS V
This slide provides key steps to conduct data integration aimed at helping businesses combine and collaborate data together. It covers steps such as data requirements, profile data sources, review requirements, design, implement and monitor.Slidegeeks is here to make your presentations a breeze with Key Phases Of Data Integration Process Data Analytics SS V With our easy-to-use and customizable templates, you can focus on delivering your ideas rather than worrying about formatting. With a variety of designs to choose from, you are sure to find one that suits your needs. And with animations and unique photos, illustrations, and fonts, you can make your presentation pop. So whether you are giving a sales pitch or presenting to the board, make sure to check out Slidegeeks first
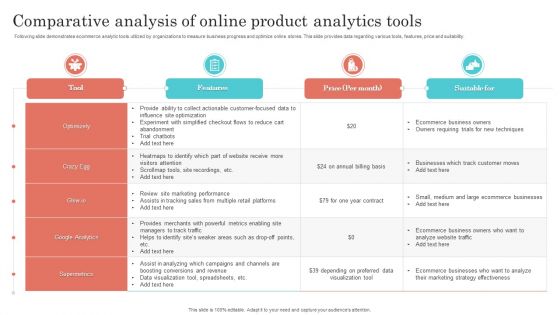
Comparative Analysis Of Online Product Analytics Tools Brochure PDF
Following slide demonstrates ecommerce analytic tools utilized by organizations to measure business progress and optimize online stores. This slide provides data regarding various tools, features, price and suitability. Showcasing this set of slides titled Comparative Analysis Of Online Product Analytics Tools Brochure PDF. The topics addressed in these templates are Optimizely, Google Analytics, Price. All the content presented in this PPT design is completely editable. Download it and make adjustments in color, background, font etc. as per your unique business setting.

Edge Computing Analytics Ppt Powerpoint Presentation Complete Deck With Slides
Share a great deal of information on the topic by deploying this Edge Computing Analytics Ppt Powerpoint Presentation Complete Deck With Slides Support your ideas and thought process with this prefabricated set. It includes a set of seventeen slides, all fully modifiable and editable. Each slide can be restructured and induced with the information and content of your choice. You can add or remove large content boxes as well, to make this PPT slideshow more personalized. Its high-quality graphics and visuals help in presenting a well-coordinated pitch. This PPT template is also a resourceful tool to take visual cues from and implement the best ideas to help your business grow and expand. The main attraction of this well-formulated deck is that everything is editable, giving you the freedom to adjust it to your liking and choice. Changes can be made in the background and theme as well to deliver an outstanding pitch. Therefore, click on the download button now to gain full access to this multifunctional set.
Oracle Analytics Cloud Solutions Collaboration And Publishing Icons PDF
This slide depicts the professional edition provided by Oracle Analytics Cloud and its various features that users can use to carry out valuable insights from data. This is a oracle analytics cloud solutions collaboration and publishing icons pdf template with various stages. Focus and dispense information on six stages using this creative set, that comes with editable features. It contains large content boxes to add your information on topics like business, application, collecting, processes, analytics. You can also showcase facts, figures, and other relevant content using this PPT layout. Grab it now.

Tools For Data Analytics Apache Spark Ppt Infographics Influencers PDF
This slide represents the Apache Spark tool used in data science and its features such as speed, reusability, advanced analytics, real time stream processing, and dynamic nature. Presenting tools for data analytics apache spark ppt infographics influencers pdf to provide visual cues and insights. Share and navigate important information on six stages that need your due attention. This template can be used to pitch topics like tools for data analytics apache spark. In addtion, this PPT design contains high resolution images, graphics, etc, that are easily editable and available for immediate download.
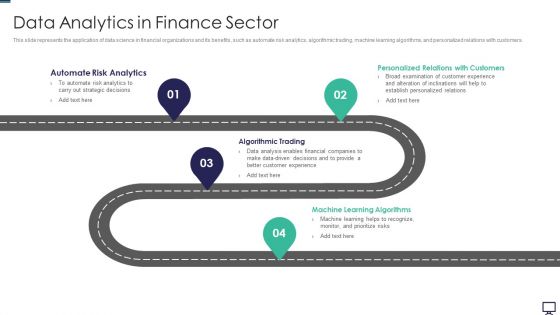
Data Analytics In Finance Sector Ppt Pictures Mockup PDF
This slide represents the application of data science in financial organizations and its benefits, such as automate risk analytics, algorithmic trading, machine learning algorithms, and personalized relations with customers. This is a data analytics in finance sector ppt pictures mockup pdf template with various stages. Focus and dispense information on four stages using this creative set, that comes with editable features. It contains large content boxes to add your information on topics like customer, strategic, analytics. You can also showcase facts, figures, and other relevant content using this PPT layout. Grab it now.

B2b Marketing Analytics Dashboard With Engagement Rate Microsoft PDF
The purpose of this slide is to display analytics dashboard which can be used by company to highlight marketing campaign performance. Information covered in this template is related to shares and likes by social media platforms, total engagement rate etc. Showcasing this set of slides titled B2b Marketing Analytics Dashboard With Engagement Rate Microsoft PDF. The topics addressed in these templates are B2b Marketing Analytics Dashboard With Engagement Rate. All the content presented in this PPT design is completely editable. Download it and make adjustments in color, background, font etc. as per your unique business setting.
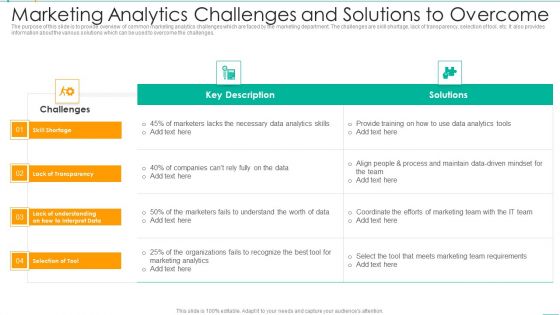
Marketing Analytics Challenges And Solutions To Overcome Template PDF
The purpose of this slide is to provide overview of common marketing analytics challenges which are faced by the marketing department. The challenges are skill shortage, lack of transparency, selection of tool, etc. It also provides information about the various solutions which can be used to overcome the challenges. Pitch your topic with ease and precision using this Marketing Analytics Challenges And Solutions To Overcome Template PDF. This layout presents information on Marketers, Data Analytics, Team. It is also available for immediate download and adjustment. So, changes can be made in the color, design, graphics or any other component to create a unique layout.

Marketing Analytics Dashboard To Analyze Ads Campaign Performance Microsoft PDF
The purpose of this slide is to showcase marketing analytics dashboard. Company can analyze the performance of ads campaign through metrics such as total amount spent, total link clicks, conversions, revenue generated etc. Showcasing this set of slides titled Marketing Analytics Dashboard To Analyze Ads Campaign Performance Microsoft PDF. The topics addressed in these templates are Marketing Analytics Dashboard To Analyze Ads Campaign Performance. All the content presented in this PPT design is completely editable. Download it and make adjustments in color, background, font etc. as per your unique business setting.
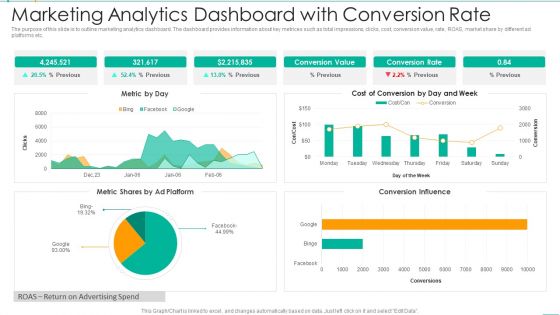
Marketing Analytics Dashboard With Conversion Rate Summary PDF
The purpose of this slide is to outline marketing analytics dashboard. The dashboard provides information about key metrices such as total impressions, clicks, cost, conversion value, rate, ROAS, market share by different ad platforms etc. Pitch your topic with ease and precision using this Marketing Analytics Dashboard With Conversion Rate Summary PDF. This layout presents information on Marketing Analytics Dashboard With Conversion Rate. It is also available for immediate download and adjustment. So, changes can be made in the color, design, graphics or any other component to create a unique layout.
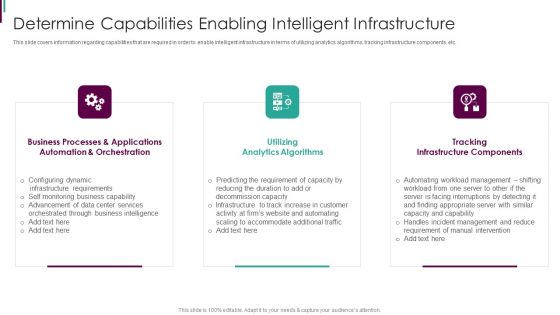
Developing Business Analytics Framework Determine Capabilities Enabling Information PDF
This slide covers information regarding capabilities that are required in order to enable intelligent infrastructure in terms of utilizing analytics algorithms, tracking infrastructure components, etc. This is a Developing Business Analytics Framework Determine Capabilities Enabling Information PDF template with various stages. Focus and dispense information on three stages using this creative set, that comes with editable features. It contains large content boxes to add your information on topics like Business Processes, Analytics Algorithms, Infrastructure Components You can also showcase facts, figures, and other relevant content using this PPT layout. Grab it now.

Developing Business Analytics Framework Determine Dimensions Diagrams PDF
This slide provides information regarding the areas in which firm can digitally advanced such as infrastructure, base technology and data analytics engine and application. Firm can choose any or all the dimensions as per requirement at a time. This is a Developing Business Analytics Framework Determine Dimensions Diagrams PDF template with various stages. Focus and dispense information on four stages using this creative set, that comes with editable features. It contains large content boxes to add your information on topics like Infrastructure, Analytics Engine, Base Technology You can also showcase facts, figures, and other relevant content using this PPT layout. Grab it now.
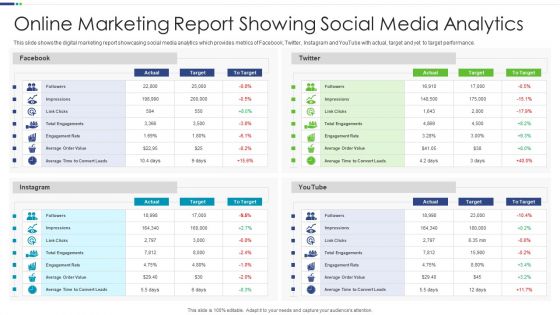
Online Marketing Report Showing Social Media Analytics Mockup PDF
This slide shows the digital marketing report showcasing social media analytics which provides metrics of Facebook, Twitter, Instagram and YouTube with actual, target and yet to target performance.Pitch your topic with ease and precision using this Online Marketing Report Showing Social Media Analytics Mockup PDF This layout presents information on Total Engagements, Marketing Report, Showing Analytics It is also available for immediate download and adjustment. So, changes can be made in the color, design, graphics or any other component to create a unique layout.
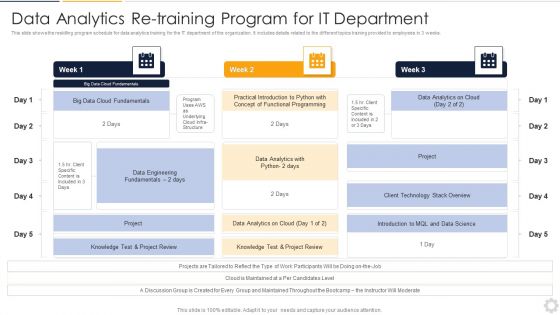
Data Analytics Re Training Program For IT Department Designs PDF
This slide shows the reskilling program schedule for data analytics training for the IT department of the organization. It includes details related to the different topics training provided to employees in 3 weeks. Showcasing this set of slides titled Data Analytics Re Training Program For IT Department Designs PDF. The topics addressed in these templates are Data Analytics, Technology Stack Overview, Big Data Cloud. All the content presented in this PPT design is completely editable. Download it and make adjustments in color, background, font etc. as per your unique business setting.

Five Approachesfor Improving Customer Experience With Speech Analytics Slides PDF
This slide showcases the different strategies for improving the customer experience through speech analytics. Speech analytics leverages artificial intelligence to understand, process, and analyse human speech.Persuade your audience using this Five Approachesfor Improving Customer Experience With Speech Analytics Slides PDF. This PPT design covers five stages, thus making it a great tool to use. It also caters to a variety of topics including Customer Dissatisfaction, Center Agents, Customer Retention Download this PPT design now to present a convincing pitch that not only emphasizes the topic but also showcases your presentation skills.
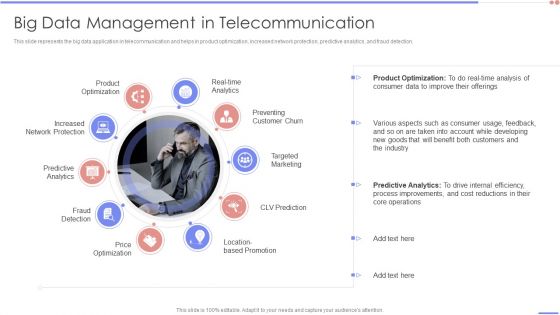
Data Analytics Management Big Data Management In Telecommunication Infographics PDF
This slide represents the big data application in telecommunication and helps in product optimization, increased network protection, predictive analytics, and fraud detection.Presenting Data Analytics Management Big Data Management In Telecommunication Infographics PDF to provide visual cues and insights. Share and navigate important information on ten stages that need your due attention. This template can be used to pitch topics like Product Optimization, Predictive Analytics, Fraud Detection. In addtion, this PPT design contains high resolution images, graphics, etc, that are easily editable and available for immediate download.

Essential Customer Behavior Analytics Tools Ppt Infographic Template Display PDF
The following slide showcases tools for customer behavior analysis to understand need and requirements of consumer and to engage with them. Main tools included are CRM, customer service, social media and analytics. Persuade your audience using this Essential Customer Behavior Analytics Tools Ppt Infographic Template Display PDF. This PPT design covers three stages, thus making it a great tool to use. It also caters to a variety of topics including CRM, Social Media, Analytics Solutions. Download this PPT design now to present a convincing pitch that not only emphasizes the topic but also showcases your presentation skills.

Talent Acquisition Analytics Framework To Support Onboarding Process Pictures PDF
This slide represents talent acquisition analytics framework. It includes talent outcomes, candidate quality, hiring volume, source, talent acquisition data etc. Find highly impressive Talent Acquisition Analytics Framework To Support Onboarding Process Pictures PDF on Slidegeeks to deliver a meaningful presentation. You can save an ample amount of time using these presentation templates. No need to worry to prepare everything from scratch because Slidegeeks experts have already done a huge research and work for you. You need to download Talent Acquisition Analytics Framework To Support Onboarding Process Pictures PDF for your upcoming presentation. All the presentation templates are 100 percent editable and you can change the color and personalize the content accordingly. Download now.

Experian Company Outline Decisioning And Analytics Inspiration PDF
This slide highlights the Experian decisioning and analytics services and solution which includes analytics solutions, customer acquisition, customer management, credit risk management, fraud prevention and debt collection. Want to ace your presentation in front of a live audience Our Experian Company Outline Decisioning And Analytics Inspiration PDF can help you do that by engaging all the users towards you. Slidegeeks experts have put their efforts and expertise into creating these impeccable powerpoint presentations so that you can communicate your ideas clearly. Moreover, all the templates are customizable, and easy to edit and downloadable. Use these for both personal and commercial use.
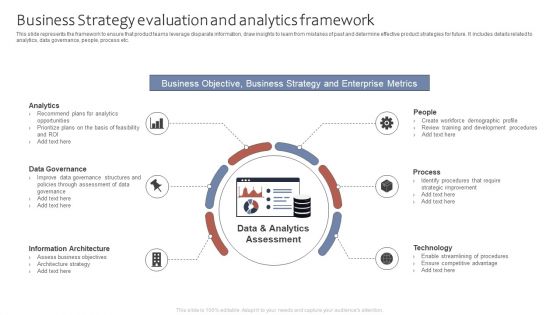
Business Strategy Evaluation And Analytics Framework Ppt Ideas Images PDF
This slide represents the framework to ensure that product teams leverage disparate information, draw insights to learn from mistakes of past and determine effective product strategies for future. It includes details related to analytics, data governance, people, process etc. Presenting Business Strategy Evaluation And Analytics Framework Ppt Ideas Images PDF to dispense important information. This template comprises six stages. It also presents valuable insights into the topics including Analytics, Data Governance, Information Architecture, People. This is a completely customizable PowerPoint theme that can be put to use immediately. So, download it and address the topic impactfully.
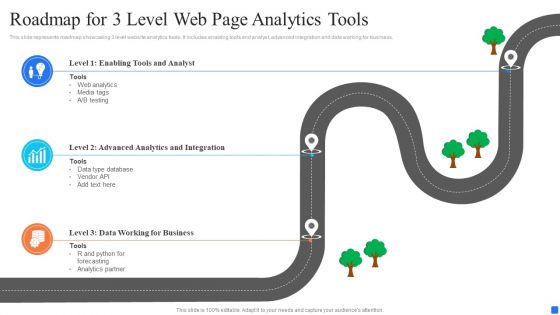
Roadmap For 3 Level Web Page Analytics Tools Sample PDF
This slide represents roadmap showcasing 3 level website analytics tools. It includes enabling tools and analyst, advanced integration and data working for business. Persuade your audience using this Roadmap For 3 Level Web Page Analytics Tools Sample PDF. This PPT design covers three stages, thus making it a great tool to use. It also caters to a variety of topics including Data Type Database, Data Working For Business, Analytics And Integration. Download this PPT design now to present a convincing pitch that not only emphasizes the topic but also showcases your presentation skills.
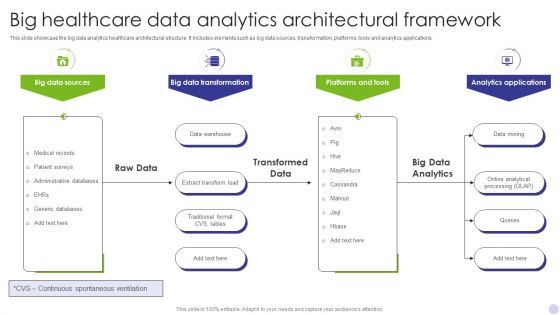
Big Healthcare Data Analytics Architectural Framework Inspiration PDF
This slide showcase the big data analytics healthcare architectural structure. It includes elements such as big data sources, transformation, platforms, tools and analytics applications. Persuade your audience using this Big Healthcare Data Analytics Architectural Framework Inspiration PDF. This PPT design covers Four stages, thus making it a great tool to use. It also caters to a variety of topics including Big Data Sources, Big Data Transformation, Platforms And Tools. Download this PPT design now to present a convincing pitch that not only emphasizes the topic but also showcases your presentation skills.
Introduction To Email Analytics For Tracking Campaign Performance Brochure PDF
This slide covers an email analytics overview to identify how subscribers interact with your email campaigns. It also includes steps to email analytics, such as checking KPIs regularly, reflecting on numbers, refining customer profiles, building better lead generation campaigns, etc. There are so many reasons you need a Introduction To Email Analytics For Tracking Campaign Performance Brochure PDF. The first reason is you can not spend time making everything from scratch, Thus, Slidegeeks has made presentation templates for you too. You can easily download these templates from our website easily.

Digital Products Company Outline Big Data Analytics Formats PDF
This slide showcases data engineering, database management, data visualization and multi system data integration tools and software developed with assistance of big data analytics and processing. Create an editable Digital Products Company Outline Big Data Analytics Formats PDF that communicates your idea and engages your audience. Whether you are presenting a business or an educational presentation, pre designed presentation templates help save time. Digital Products Company Outline Big Data Analytics Formats PDF is highly customizable and very easy to edit, covering many different styles from creative to business presentations. Slidegeeks has creative team members who have crafted amazing templates. So, go and get them without any delay.
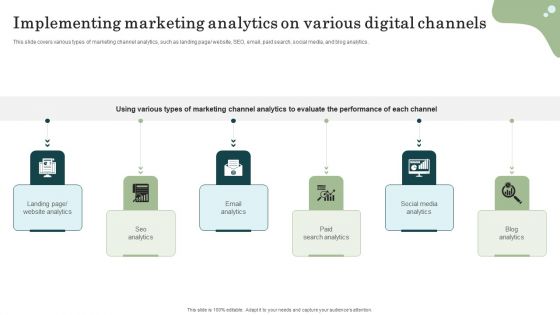
Marketing Success Metrics Implementing Marketing Analytics On Various Infographics PDF
This slide covers various types of marketing channel analytics, such as landing page or website, SEO, email, paid search, social media, and blog analytics. Slidegeeks has constructed Marketing Success Metrics Implementing Marketing Analytics On Various Infographics PDF after conducting extensive research and examination. These presentation templates are constantly being generated and modified based on user preferences and critiques from editors. Here, you will find the most attractive templates for a range of purposes while taking into account ratings and remarks from users regarding the content. This is an excellent jumping-off point to explore our content and will give new users an insight into our top-notch PowerPoint Templates.
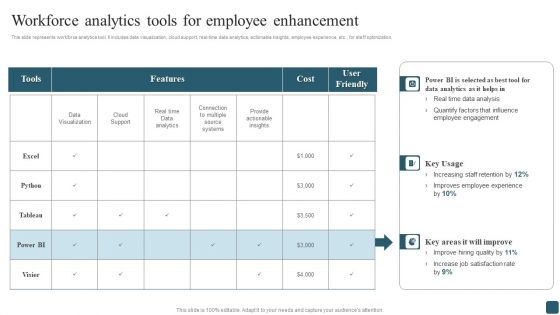
Workforce Analytics Tools For Employee Enhancement Clipart PDF
This slide represents workforce analytics tool. It includes data visualization, cloud support, real-time data analytics, actionable insights, employee experience, etc., for staff optimization. Do you know about Slidesgeeks Workforce Analytics Tools For Employee Enhancement Clipart PDF These are perfect for delivering any kind od presentation. Using it, create PowerPoint presentations that communicate your ideas and engage audiences. Save time and effort by using our pre-designed presentation templates that are perfect for a wide range of topic. Our vast selection of designs covers a range of styles, from creative to business, and are all highly customizable and easy to edit. Download as a PowerPoint template or use them as Google Slides themes.
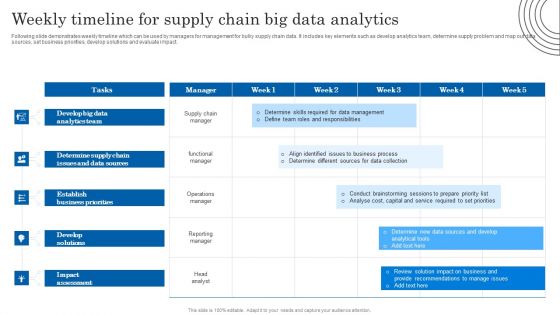
Weekly Timeline For Supply Chain Big Data Analytics Introduction PDF
Following slide demonstrates weekly timeline which can be used by managers for management for bulky supply chain data. It includes key elements such as develop analytics team, determine supply problem and map out data sources, set business priorities, develop solutions and evaluate impact. Pitch your topic with ease and precision using this Weekly Timeline For Supply Chain Big Data Analytics Introduction PDF. This layout presents information on Determine Supply Chain, Data Sources, Analytics Team. It is also available for immediate download and adjustment. So, changes can be made in the color, design, graphics or any other component to create a unique layout.
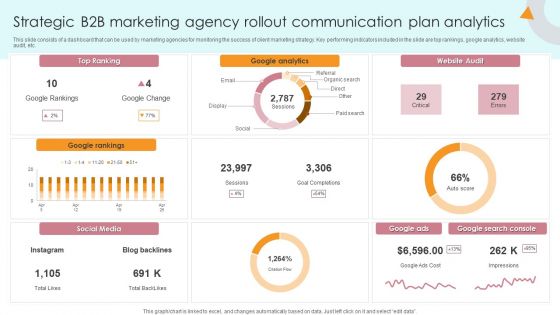
Strategic B2B Marketing Agency Rollout Communication Plan Analytics Background PDF
This slide consists of a dashboard that can be used by marketing agencies for monitoring the success of client marketing strategy. Key performing indicators included in the slide are top rankings, google analytics, website audit, etc. Showcasing this set of slides titled Strategic B2B Marketing Agency Rollout Communication Plan Analytics Background PDF. The topics addressed in these templates are Top Ranking, Google Analytics, Website Audit. All the content presented in this PPT design is completely editable. Download it and make adjustments in color, background, font etc. as per your unique business setting.
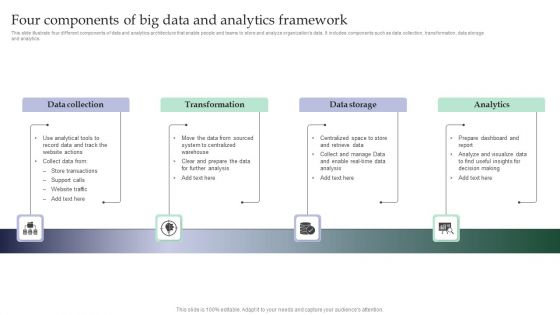
Four Components Of Big Data And Analytics Framework Diagrams PDF
This slide illustrate four different components of data and analytics architecture that enable people and teams to store and analyze organizations data. It includes components such as data collection, transformation, data storage and analytics Persuade your audience using this Four Components Of Big Data And Analytics Framework Diagrams PDF. This PPT design covers four stages, thus making it a great tool to use. It also caters to a variety of topics including Data Collection, Transformation, Data Storage. Download this PPT design now to present a convincing pitch that not only emphasizes the topic but also showcases your presentation skills.
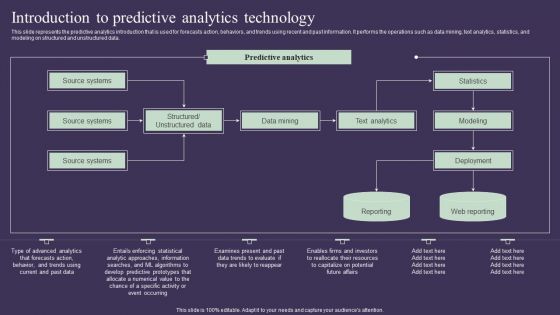
Projection Model Introduction To Predictive Analytics Technology Elements PDF
This slide represents the predictive analytics introduction that is used for forecasts action, behaviors, and trends using recent and past information. It performs the operations such as data mining, text analytics, statistics, and modeling on structured and unstructured data. Make sure to capture your audiences attention in your business displays with our gratis customizable Projection Model Introduction To Predictive Analytics Technology Elements PDF. These are great for business strategies, office conferences, capital raising or task suggestions. If you desire to acquire more customers for your tech business and ensure they stay satisfied, create your own sales presentation with these plain slides.

Projection Model Predictive Analytics In Government Sector Pictures PDF
This slide depicts the usage of predictive analytics technology in the government sector to improve cybersecurity as they are the main drivers of computer technology growth. The government sector is using predictive analytics for several corporate processes. Find a pre-designed and impeccable Projection Model Predictive Analytics In Government Sector Pictures PDF. The templates can ace your presentation without additional effort. You can download these easy-to-edit presentation templates to make your presentation stand out from others. So, what are you waiting for Download the template from Slidegeeks today and give a unique touch to your presentation.

Projection Model Uses Of Predictive Analytics Underwriting Pictures PDF
This slide represents the application of predictive analytics in underwriting by insurance companies. Predictive analytics help them identify future claims by analyzing policyholders historical data patterns and existing risk collection. Boost your pitch with our creative Projection Model Uses Of Predictive Analytics Underwriting Pictures PDF. Deliver an awe-inspiring pitch that will mesmerize everyone. Using these presentation templates you will surely catch everyones attention. You can browse the ppts collection on our website. We have researchers who are experts at creating the right content for the templates. So you do not have to invest time in any additional work. Just grab the template now and use them.
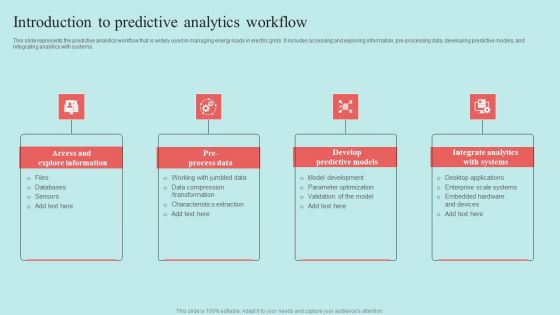
Predictive Data Model Introduction To Predictive Analytics Workflow Topics PDF
E Mail Performance Analytics Metrics Tracking Report Analysis Demonstration PDF
The purpose of this slide is to showcase an e-mail analytics mechanism in order to track the performance of certain e-mail marketing based on various metrics. Certain KPIs include open rate, click rate, unsubscribe rate etc. Pitch your topic with ease and precision using this E Mail Performance Analytics Metrics Tracking Report Analysis Demonstration PDF. This layout presents information on E Mail Performance Analytics, Metrics Tracking Report Analysis. It is also available for immediate download and adjustment. So, changes can be made in the color, design, graphics or any other component to create a unique layout.
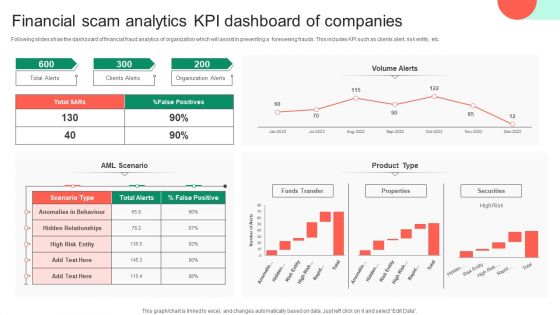
Financial Scam Analytics KPI Dashboard Of Companies Clipart PDF
Following slides show the dashboard of financial fraud analytics of organization which will assist in preventing a foreseeing frauds. This includes KPI such as clients alert, risk entity, etc. Pitch your topic with ease and precision using this Financial Scam Analytics KPI Dashboard Of Companies Clipart PDF. This layout presents information on Financial Scam Analytics, Kpi Dashboard Of Companies. It is also available for immediate download and adjustment. So, changes can be made in the color, design, graphics or any other component to create a unique layout.
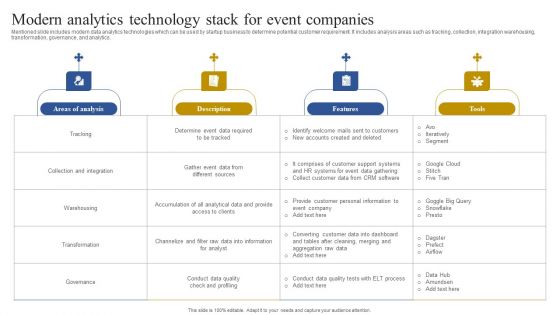
Modern Analytics Technology Stack For Event Companies Information PDF
Mentioned slide includes modern data analytics technologies which can be used by startup business to determine potential customer requirement. It includes analysis areas such as tracking, collection, integration warehousing, transformation, governance, and analytics. Pitch your topic with ease and precision using this Modern Analytics Technology Stack For Event Companies Information PDF. This layout presents information on Warehousing, Transformation, Collection And Integration. It is also available for immediate download and adjustment. So, changes can be made in the color, design, graphics or any other component to create a unique layout.
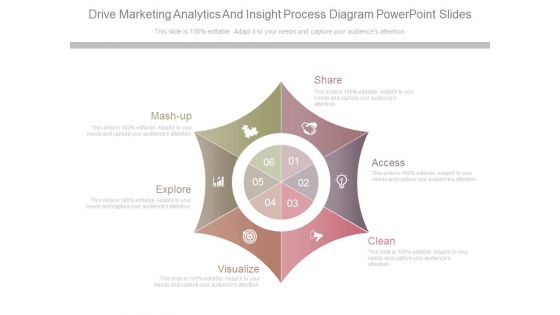
Drive Marketing Analytics And Insight Process Diagram Powerpoint Slides
This is a drive marketing analytics and insight process diagram powerpoint slides. This is a six stage process. The stages in this process are share, access, clean, visualize, explore, mash up.
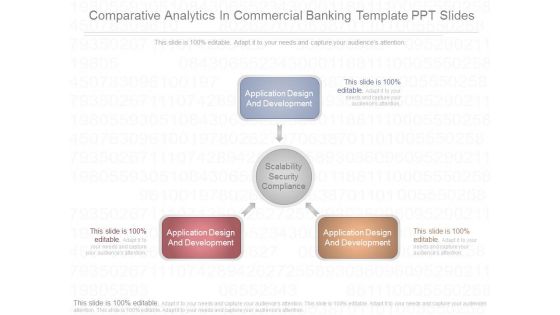
Comparative Analytics In Commercial Banking Template Ppt Slides
This is a comparative analytics in commercial banking template ppt slides. This is a three stage process. The stages in this process are application design and development, scalability security compliance, application design and development, application design and development.
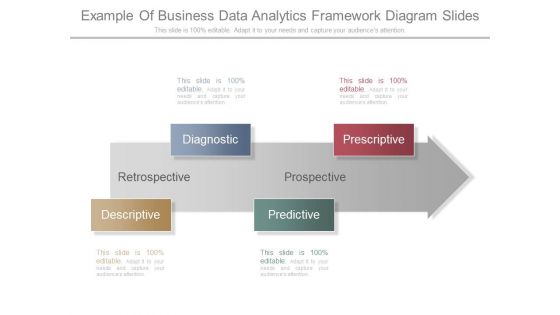
Example Of Business Data Analytics Framework Diagram Slides
This is a example of business data analytics framework diagram slides. This is a four stage process. The stages in this process are diagnostic, descriptive, predictive, prescriptive, retrospective, prospective.
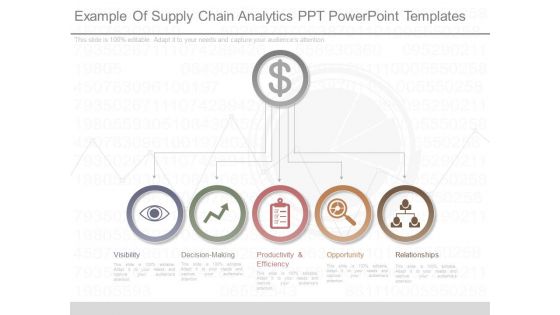
Example Of Supply Chain Analytics Ppt Powerpoint Templates
This is a example of supply chain analytics ppt powerpoint templates. This is a five stage process. The stages in this process are visibility, decision making, productivity and efficiency, opportunity, relationships.
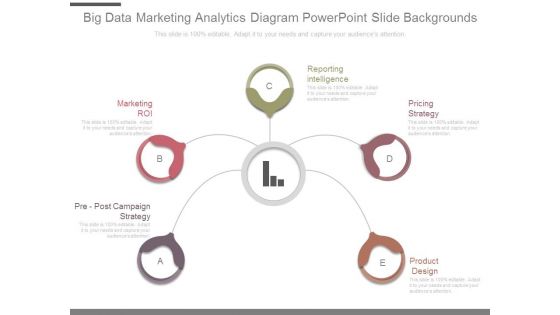
Big Data Marketing Analytics Diagram Powerpoint Slide Backgrounds
This is a big data marketing analytics diagram powerpoint slide backgrounds. This is a five stage process. The stages in this process are marketing roi, reporting intelligence, pricing strategy, product design, pre post campaign strategy.
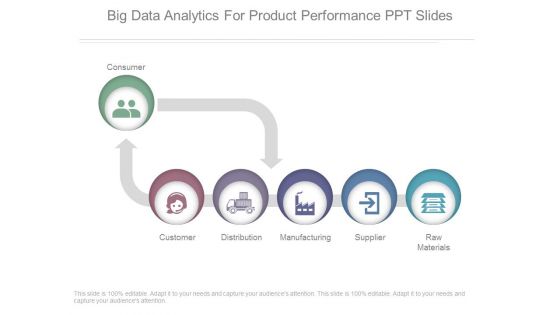
Big Data Analytics For Product Performance Ppt Slides
This is a big data analytics for product performance ppt slides. This is a five stage process. The stages in this process are consumer, customer, distribution, manufacturing, supplier, raw materials.

 Home
Home