Ai In Finance

Home Insurance Analytics Statistics With Settlement Time Dashboard Ideas PDF
This slide illustrates home insurance facts and figures of the organization. It includes monthly claim volume, claim status, average notification time, acknowledged time, decision time etc. Pitch your topic with ease and precision using this Home Insurance Analytics Statistics With Settlement Time Dashboard Ideas PDF. This layout presents information on Average Acknowledged Time, Average Decision Time, Average Lead Time. It is also available for immediate download and adjustment. So, changes can be made in the color, design, graphics or any other component to create a unique layout.
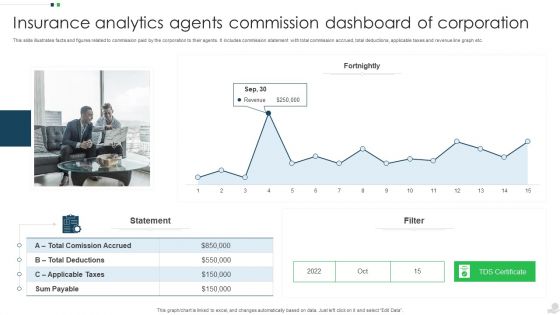
Insurance Analytics Agents Commission Dashboard Of Corporation Introduction PDF
This slide illustrates facts and figures related to commission paid by the corporation to their agents. It includes commission statement with total commission accrued, total deductions, applicable taxes and revenue line graph etc. Pitch your topic with ease and precision using this Insurance Analytics Agents Commission Dashboard Of Corporation Introduction PDF. This layout presents information on Applicable Taxes, Sum Payable, Revenue. It is also available for immediate download and adjustment. So, changes can be made in the color, design, graphics or any other component to create a unique layout.
Youtube Video Marketing Analytics Dashboard Ppt Icon Portrait PDF
This slide covers dashboard illustrating performance of ad campaigns on YouTube. It includes elements such as total gained subscribers, likes, dislikes, daily active users, views, campaign performance, traffic sources by views, etc. Pitch your topic with ease and precision using this Youtube Video Marketing Analytics Dashboard Ppt Icon Portrait PDF. This layout presents information on Average Vies, Per Week, Campaigns, Traffic Sources. It is also available for immediate download and adjustment. So, changes can be made in the color, design, graphics or any other component to create a unique layout.

Dashboarding Showcasing Employee Information Analytics With Employee Productivity Slides PDF
This slide represents dashboarding showcasing workforce data analysis and assessment to monitor employee engagement. It provides information regarding average productivity, no. of departments, total employees and activity stats. Pitch your topic with ease and precision using this Dashboarding Showcasing Employee Information Analytics With Employee Productivity Slides PDF. This layout presents information on Reimbursement, Productive, Workforce Productivity Stats. It is also available for immediate download and adjustment. So, changes can be made in the color, design, graphics or any other component to create a unique layout.
Automating Supply Chain Dashboard For Tracking Impact Of Supply Chain Automation Pictures PDF
This slide covers the dashboard for back-end tracking of overall impact automation. It include KPIs such as retailer capacity, warehouse capacity, truck efficiency, time to reach warehouse, sustainability, etc. Deliver and pitch your topic in the best possible manner with this Automating Supply Chain Dashboard For Tracking Impact Of Supply Chain Automation Pictures PDF. Use them to share invaluable insights on Supply Chain Manager, Warehouse Manager, Truck Driver and impress your audience. This template can be altered and modified as per your expectations. So, grab it now.
Automating Supply Chain Dashboard For Tracking Impact Of Warehouse House Automation Graphics PDF
This slide covers the dashboard with after automation warehouse overview. It include KPIs such as autonomous robots status, robotic arms status, battery level, performance, time to return, etc. Deliver and pitch your topic in the best possible manner with this Automating Supply Chain Dashboard For Tracking Impact Of Warehouse House Automation Graphics PDF. Use them to share invaluable insights on Autonomous Robot, Robotic Arms, Systems Engineer and impress your audience. This template can be altered and modified as per your expectations. So, grab it now.
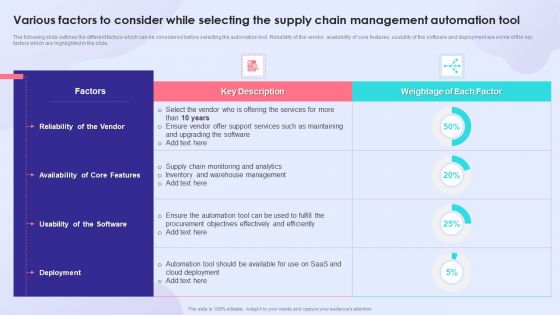
Various Factors To Consider While Selecting The Supply Chain Management Automation Tool Sample PDF
The following slide outlines the different factors which can be considered before selecting the automation tool. Reliability of the vendor, availability of core features, usability of the software and deployment are some of the key factors which are highlighted in the slide. Deliver an awe inspiring pitch with this creative Various Factors To Consider While Selecting The Supply Chain Management Automation Tool Sample PDF bundle. Topics like Warehouse Management, Analytics Inventory, Supply Chain can be discussed with this completely editable template. It is available for immediate download depending on the needs and requirements of the user.
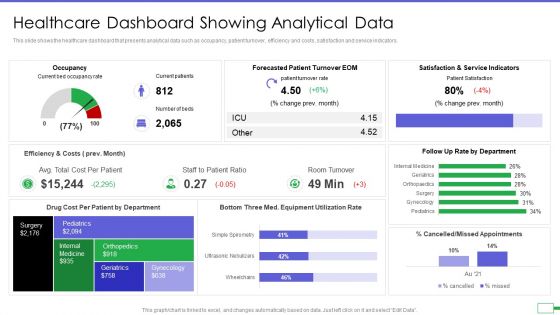
Iot And Digital Twin To Reduce Costs Post Covid Healthcare Dashboard Showing Analytical Data Elements PDF
This slide shows the healthcare dashboard that presents analytical data such as occupancy, patient turnover, efficiency and costs, satisfaction and service indicators. Deliver and pitch your topic in the best possible manner with this iot and digital twin to reduce costs post covid healthcare dashboard showing analytical data elements pdf. Use them to share invaluable insights on occupancy, patient turnover, efficiency and costs, satisfaction and service indicators and impress your audience. This template can be altered and modified as per your expectations. So, grab it now.

Change Management Strategy Impact Of Technology Transformation On Revenues Download PDF
This slide shows the impact of technology transformation on business revenues and costs due to multiple reasons such as task automation, digital transformation models, advanced business processes, etc. Make sure to capture your audiences attention in your business displays with our gratis customizable Change Management Strategy Impact Of Technology Transformation On Revenues Download PDF. These are great for business strategies, office conferences, capital raising or task suggestions. If you desire to acquire more customers for your tech business and ensure they stay satisfied, create your own sales presentation with these plain slides.
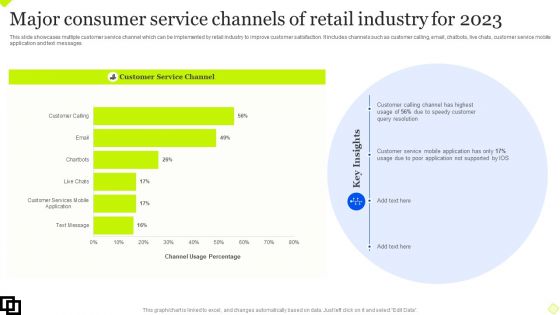
Major Consumer Service Channels Of Retail Industry For 2023 Designs PDF
This slide showcases multiple customer service channel which can be implemented by retail industry to improve customer satisfaction. It includes channels such as customer calling, email, chatbots, live chats, customer service mobile application and text messages. Pitch your topic with ease and precision using this Major Consumer Service Channels Of Retail Industry For 2023 Designs PDF. This layout presents information on Customer Service Channel, Customer Calling Channel, Customer Service Mobile Application. It is also available for immediate download and adjustment. So, changes can be made in the color, design, graphics or any other component to create a unique layout.
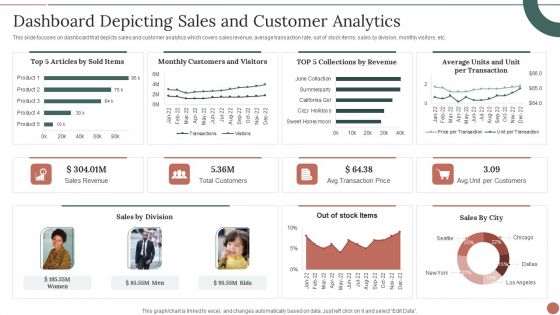
Retail Business Product Planning Procedure Dashboard Depicting Sales And Customer Analytics Themes PDF
This slide focuses on dashboard that depicts sales and customer analytics which covers sales revenue, average transaction rate, out of stock items, sales by division, monthly visitors, etc. Deliver and pitch your topic in the best possible manner with this Retail Business Product Planning Procedure Dashboard Depicting Sales And Customer Analytics Themes PDF. Use them to share invaluable insights on Sales Revenue, Total Customers, Sales By Division and impress your audience. This template can be altered and modified as per your expectations. So, grab it now.
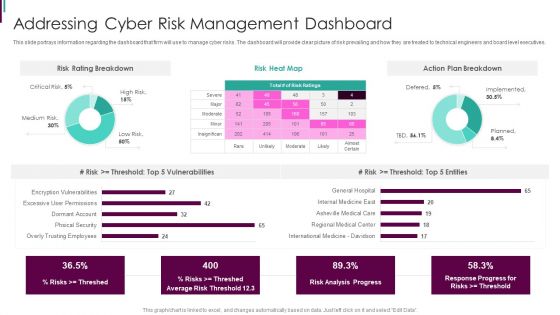
Developing Business Analytics Framework Addressing Cyber Risk Management Dashboard Graphics PDF
This slide portrays information regarding the dashboard that firm will use to manage cyber risks. The dashboard will provide clear picture of risk prevailing and how they are treated to technical engineers and board level executives.Deliver and pitch your topic in the best possible manner with this Developing Business Analytics Framework Addressing Cyber Risk Management Dashboard Graphics PDF Use them to share invaluable insights on Risk Breakdown, Action Breakdown, Vulnerabilities and impress your audience. This template can be altered and modified as per your expectations. So, grab it now.
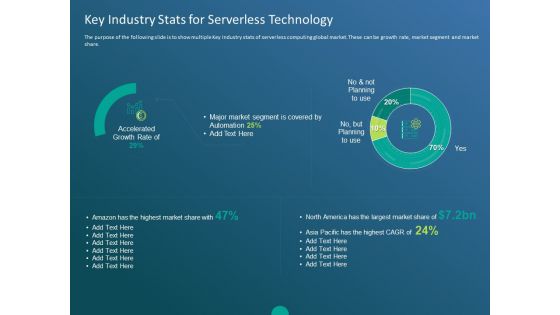
Functioning Of Serverless Computing Key Industry Stats For Serverless Technology Brochure PDF
The purpose of the following slide is to show multiple Key Industry stats of serverless computing global market. These can be growth rate, market segment and market share. Deliver and pitch your topic in the best possible manner with this functioning of serverless computing key industry stats for serverless technology brochure pdf. Use them to share invaluable insights on accelerated growth rate, major market segment, covered automation, highest market share and impress your audience. This template can be altered and modified as per your expectations. So, grab it now.
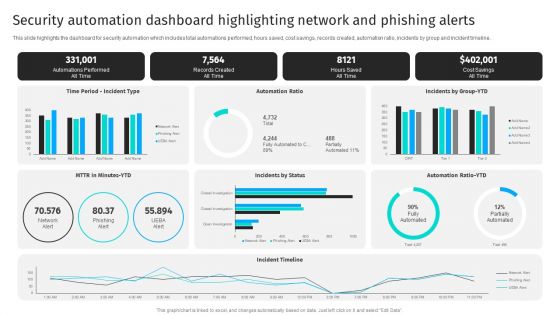
Security Automation Dashboard Highlighting Network And Phishing Alerts Professional PDF
This slide highlights the dashboard for security automation which includes total automations performed, hours saved, cost savings, records created, automation ratio, incidents by group and incident timeline.Get a simple yet stunning designed Security Automation Dashboard Highlighting Network And Phishing Alerts Professional PDF. It is the best one to establish the tone in your meetings. It is an excellent way to make your presentations highly effective. So, download this PPT today from Slidegeeks and see the positive impacts. Our easy-to-edit Security Automation Dashboard Highlighting Network And Phishing Alerts Professional PDF can be your go-to option for all upcoming conferences and meetings. So, what are you waiting for Grab this template today.
BI Technique For Data Informed Decisions Global Market Landscape Of Sap Analytics Cloud Suite Icons PDF
The purpose of this slide is to showcase the global market landscape of SAP analytics cloud as BI tool. It also contains information regarding the business intelligence BI software market share and SAP analytics cloud customers by industry. Are you in need of a template that can accommodate all of your creative concepts This one is crafted professionally and can be altered to fit any style. Use it with Google Slides or PowerPoint. Include striking photographs, symbols, depictions, and other visuals. Fill, move around, or remove text boxes as desired. Test out color palettes and font mixtures. Edit and save your work, or work with colleagues. Download BI Technique For Data Informed Decisions Global Market Landscape Of Sap Analytics Cloud Suite Icons PDF and observe how to make your presentation outstanding. Give an impeccable presentation to your group and make your presentation unforgettable.

Automated Supplier Relationship Management Risk Assessment Dashboard Showing Template PDF
This slide delineates risk assessment dashboard which can help vendor managers in assessing procurement contract status. It includes information about suppliers, renewals, actions, assessment status, concentration, etc. Slidegeeks is one of the best resources for PowerPoint templates. You can download easily and regulate Automated Supplier Relationship Management Risk Assessment Dashboard Showing Template PDF for your personal presentations from our wonderful collection. A few clicks is all it takes to discover and get the most relevant and appropriate templates. Use our Templates to add a unique zing and appeal to your presentation and meetings. All the slides are easy to edit and you can use them even for advertisement purposes.
Comparative Analysis For Manual And Automation Testing Lifecycle Icons PDF
This slide showcases graphical report to compare test expenses from manual and automated testing cycles over the years. It further includes details about benefits that can be derived from test automation cycle. Pitch your topic with ease and precision using this Comparative Analysis For Manual And Automation Testing Lifecycle Icons PDF. This layout presents information on Comparative Analysis For Manual, Automation Testing Lifecycle. It is also available for immediate download and adjustment. So, changes can be made in the color, design, graphics or any other component to create a unique layout.

Best Practices Of Automating Customer Service Slides PDF
The following slide outlines key practices of automating customer support. Featuring automated replies, organizing the support queue, redirecting customers to helpdesk and conducting customer surveys are some of the major practices which are highlighted in the slide. Deliver an awe inspiring pitch with this creative Best Practices Of Automating Customer Service Slides PDF bundle. Topics like Organize The Support Queue, Redirect Customers, Conduct Customer Surveys can be discussed with this completely editable template. It is available for immediate download depending on the needs and requirements of the user.
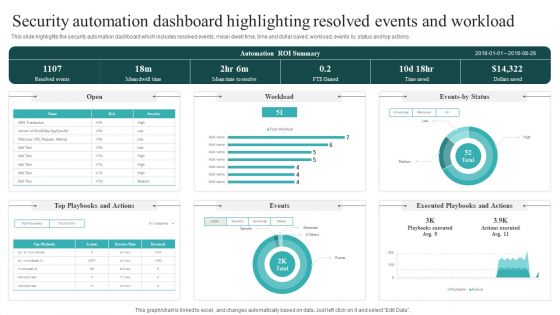
Security Automation Dashboard Highlighting Resolved Events And Workload Guidelines PDF
This slide highlights the security automation dashboard which includes resolved events, mean dwell time, time and dollar saved, workload, events by status and top actions. This Security Automation Dashboard Highlighting Resolved Events And Workload Guidelines PDF is perfect for any presentation, be it in front of clients or colleagues. It is a versatile and stylish solution for organizing your meetings. The Security Automation Dashboard Highlighting Resolved Events And Workload Guidelines PDF features a modern design for your presentation meetings. The adjustable and customizable slides provide unlimited possibilities for acing up your presentation. Slidegeeks has done all the homework before launching the product for you. So, don not wait, grab the presentation templates today.
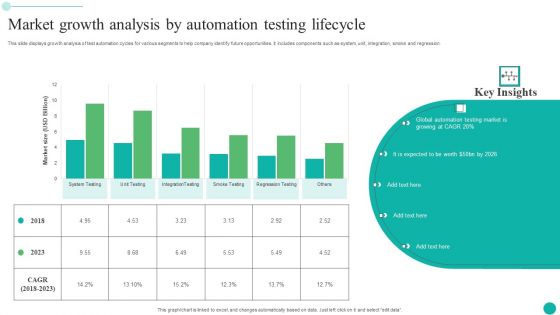
Market Growth Analysis By Automation Testing Lifecycle Themes PDF
This slide displays growth analysis of test automation cycles for various segments to help company identify future opportunities. It includes components such as system, unit, integration, smoke and regression. Pitch your topic with ease and precision using this Market Growth Analysis By Automation Testing Lifecycle Themes PDF. This layout presents information on Market Growth Analysis, Automation Testing Lifecycle. It is also available for immediate download and adjustment. So, changes can be made in the color, design, graphics or any other component to create a unique layout.
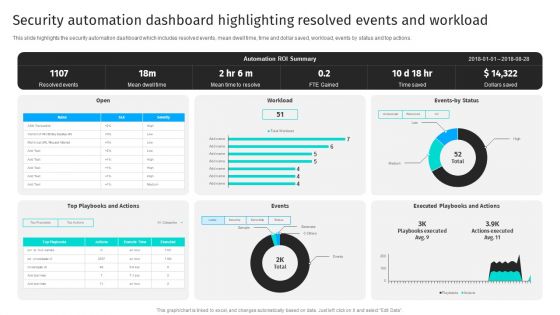
Security Automation Dashboard Highlighting Resolved Events And Workload Portrait PDF
This slide highlights the security automation dashboard which includes resolved events, mean dwell time, time and dollar saved, workload, events by status and top actions.From laying roadmaps to briefing everything in detail, our templates are perfect for you. You can set the stage with your presentation slides. All you have to do is download these easy-to-edit and customizable templates. Security Automation Dashboard Highlighting Resolved Events And Workload Portrait PDF will help you deliver an outstanding performance that everyone would remember and praise you for. Do download this presentation today.
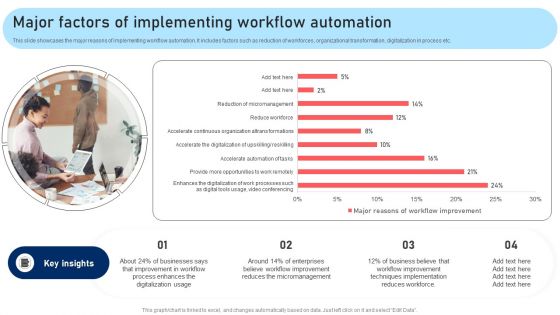
Major Factors Of Implementing Workflow Automation Download PDF
This slide showcases the major reasons of implementing workflow automation. It includes factors such as reduction of workforces, organizational transformation, digitalization in process etc. Find a pre designed and impeccable Major Factors Of Implementing Workflow Automation Download PDF. The templates can ace your presentation without additional effort. You can download these easy to edit presentation templates to make your presentation stand out from others. So, what are you waiting for Download the template from Slidegeeks today and give a unique touch to your presentation.
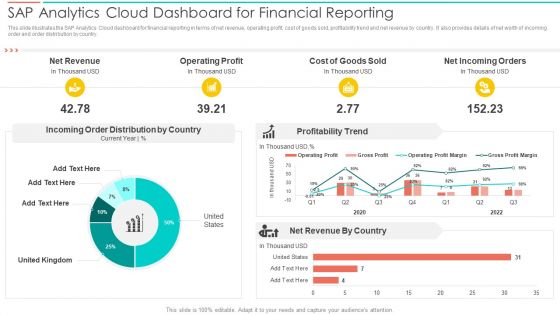
SAC Planning And Implementation SAP Analytics Cloud Dashboard For Financial Reporting Introduction PDF
This slide illustrates the SAP Analytics Cloud dashboard for financial reporting in terms of net revenue, operating profit, cost of goods sold, profitability trend and net revenue by country. It also provides details of net worth of incoming order and order distribution by country. Deliver an awe inspiring pitch with this creative SAC Planning And Implementation SAP Analytics Cloud Dashboard For Financial Reporting Introduction PDF bundle. Topics like Net Revenue, Operating Profit, Cost Goods Sold can be discussed with this completely editable template. It is available for immediate download depending on the needs and requirements of the user.

Manpower Data Analytics Strategy For Stakeholders For Decision Making Summary PDF
This slide depicts application of workforce analytics strategy among different stakeholders. It includes human resource executives, staff, senior executive and managers for taking effective decisions. Pitch your topic with ease and precision using this Manpower Data Analytics Strategy For Stakeholders For Decision Making Summary PDF. This layout presents information on Organizations, Analytics Capabilities, Generate Better Quality. It is also available for immediate download and adjustment. So, changes can be made in the color, design, graphics or any other component to create a unique layout.

Warehouse Automation Deployment Warehouse Operating Cost And Time Management Topics PDF
This slide covers the statistical representation of warehouse cost and time distribution issues in an organization. It includes time spent on activities such as search, travel, order set up, pick and put, etc. it also includes operating cost distribution such as order picking, storage, shipping, receiving, etc. Deliver an awe inspiring pitch with this creative Warehouse Automation Deployment Warehouse Operating Cost And Time Management Topics PDF bundle. Topics like Labor Utilization, Split Case Picking, Warehouse Operating, Cost Distribution can be discussed with this completely editable template. It is available for immediate download depending on the needs and requirements of the user.

Customer Behavioral Data And Analytics Customer Lifetime Value Ltv Graphics PDF
Measure the total business a customer brings over the whole period of their relationship with your brand. This helps to develop strategies to acquire new customers at lower cost and retain existing ones while maintaining profit margins. Deliver and pitch your topic in the best possible manner with this customer behavioral data and analytics customer lifetime value ltv graphics pdf. Use them to share invaluable insights on customer lifetime value and impress your audience. This template can be altered and modified as per your expectations. So, grab it now.
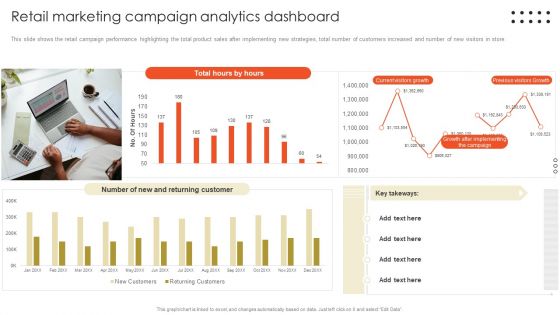
Retail Marketing Campaign Effective Techniques Retail Marketing Campaign Analytics Dashboard Topics PDF
This slide shows the retail campaign performance highlighting the total product sales after implementing new strategies, total number of customers increased and number of new visitors in store. The best PPT templates are a great way to save time, energy, and resources. Slidegeeks have 100 percent editable powerpoint slides making them incredibly versatile. With these quality presentation templates, you can create a captivating and memorable presentation by combining visually appealing slides and effectively communicating your message. Download Retail Marketing Campaign Effective Techniques Retail Marketing Campaign Analytics Dashboard Topics PDF from Slidegeeks and deliver a wonderful presentation.

SAC Planning And Implementation Global Market Landscape Of SAP Analytics Cloud Microsoft PDF
The purpose of this slide is to showcase the global market landscape of SAP analytics cloud as BI tool. It also contains information regarding the business intelligence BI software market share and SAP analytics cloud customers by industry. Deliver and pitch your topic in the best possible manner with this SAC Planning And Implementation Global Market Landscape Of SAP Analytics Cloud Microsoft PDF. Use them to share invaluable insights on Business Intelligence, Sap Analytics, Cloud Customers, Industry and impress your audience. This template can be altered and modified as per your expectations. So, grab it now.

Deploy Merchandise Program To Enhance Sales Dashboard Depicting Sales And Customer Analytics Sample PDF
This slide focuses on dashboard that depicts sales and customer analytics which covers sales revenue, average transaction rate, out of stock items, sales by division, monthly visitors, etc. Make sure to capture your audiences attention in your business displays with our gratis customizable Deploy Merchandise Program To Enhance Sales Dashboard Depicting Sales And Customer Analytics Sample PDF. These are great for business strategies, office conferences, capital raising or task suggestions. If you desire to acquire more customers for your tech business and ensure they stay satisfied, create your own sales presentation with these plain slides.

CRM Administration To Reduce Churn Rate Dashboard Depicting Customer Retention Analytics Themes PDF
This slide shows the dashboard that depicts customer retention analytics which includes net promoter score, customer loyalty rate, customer lifetime value, customer and revenue churn, monthly recurring revenue growth, etc. Make sure to capture your audiences attention in your business displays with our gratis customizable CRM Administration To Reduce Churn Rate Dashboard Depicting Customer Retention Analytics Themes PDF. These are great for business strategies, office conferences, capital raising or task suggestions. If you desire to acquire more customers for your tech business and ensure they stay satisfied, create your own sales presentation with these plain slides.
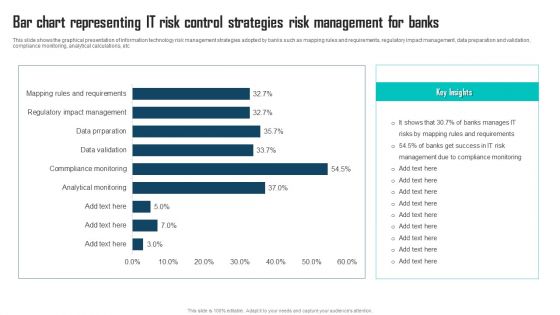
Bar Chart Representing IT Risk Control Strategies Risk Management For Banks Themes PDF
This slide shows the graphical presentation of information technology risk management strategies adopted by banks such as mapping rules and requirements, regulatory impact management, data preparation and validation, compliance monitoring, analytical calculations, etc. Pitch your topic with ease and precision using this Bar Chart Representing IT Risk Control Strategies Risk Management For Banks Themes PDF. This layout presents information on IT Risk Management, Compliance Monitoring, Manages IT Risks. It is also available for immediate download and adjustment. So, changes can be made in the color, design, graphics or any other component to create a unique layout.
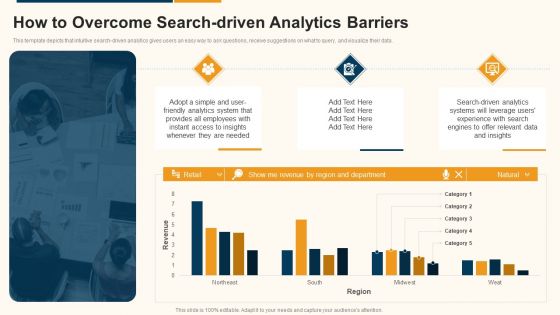
Data Interpretation And Analysis Playbook How To Overcome Search Driven Analytics Barriers Summary PDF
This template depicts that intuitive search-driven analytics gives users an easy way to ask questions, receive suggestions on what to query, and visualize their data. Deliver and pitch your topic in the best possible manner with this data interpretation and analysis playbook how to overcome search driven analytics barriers summary pdf. Use them to share invaluable insights on how to overcome search driven analytics barriers and impress your audience. This template can be altered and modified as per your expectations. So, grab it now.

Real Time Analytics Dashboard To Measure Marketing Campaign Performance Information PDF
The purpose of this slide is to outline analytics dashboard to evaluate the success rate of marketing campaign performance. It provides information about metrics such as clicks, impressions, spend, conversions, site audit score, audience growth, etc. Pitch your topic with ease and precision using this Real Time Analytics Dashboard To Measure Marketing Campaign Performance Information PDF. This layout presents information on Real Time Analytics Dashboard To Measure Marketing Campaign Performance. It is also available for immediate download and adjustment. So, changes can be made in the color, design, graphics or any other component to create a unique layout.
Playbook For Content Advertising Google Analytics For All Web Tracking Demonstration PDF
This template covers tools to measure marketing analytics such as google analytics for all web tracking, google data studio to build real time reporting dashboards and google data studio reports. Deliver and pitch your topic in the best possible manner with this Playbook For Content Advertising Google Analytics For All Web Tracking Demonstration PDF. Use them to share invaluable insights on Demographics, Devices, Social Networks and impress your audience. This template can be altered and modified as per your expectations. So, grab it now.
Social Media Brand Promotion Instructions Playbook Google Analytics For All Web Tracking Graphics PDF
This template covers tools to measure marketing analytics such as google analytics for all web tracking, google data studio to build real-time reporting dashboards and google data studio reports.Deliver and pitch your topic in the best possible manner with this Social Media Brand Promotion Instructions Playbook Google Analytics For All Web Tracking Graphics PDF Use them to share invaluable insights on Demographics, Social Networks, Returning and impress your audience. This template can be altered and modified as per your expectations. So, grab it now.
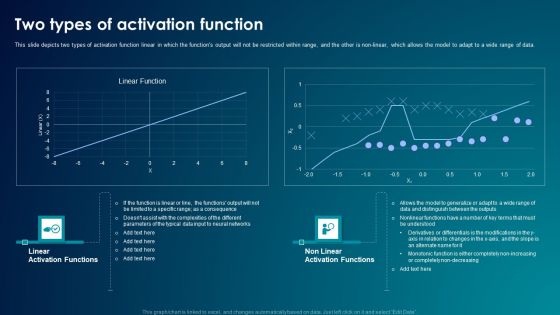
ANN System Two Types Of Activation Function Demonstration PDF
This slide depicts two types of activation function linear in which the functions output will not be restricted within range, and the other is non linear, which allows the model to adapt to a wide range of data. Deliver an awe inspiring pitch with this creative ANN System Two Types Of Activation Function Demonstration PDF bundle. Topics like Neural Networks, Data can be discussed with this completely editable template. It is available for immediate download depending on the needs and requirements of the user.
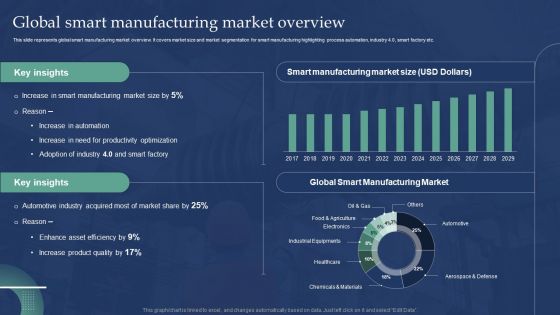
Automated Production Process To Enhance Efficiency Global Smart Manufacturing Market Overview Template PDF
This slide represents global smart manufacturing market overview. It covers market size and market segmentation for smart manufacturing highlighting process automation, industry 4.0, smart factory etc. Boost your pitch with our creative Automated Production Process To Enhance Efficiency Global Smart Manufacturing Market Overview Template PDF. Deliver an awe inspiring pitch that will mesmerize everyone. Using these presentation templates you will surely catch everyones attention. You can browse the ppts collection on our website. We have researchers who are experts at creating the right content for the templates. So you do not have to invest time in any additional work. Just grab the template now and use them.

SAC Planning And Implementation SAP Analytics Cloud Dashboard For Hr Department Inspiration PDF
This slide represents the SAP Analytics Cloud Dashboard for HR department of the organization. It includes information regarding the workforce employed, average salary department wise, age diversity, gender distribution and reasons for leaving firm. Deliver and pitch your topic in the best possible manner with this SAC Planning And Implementation SAP Analytics Cloud Dashboard For Hr Department Inspiration PDF. Use them to share invaluable insights on Workforce Employed, Compensation, Age Diversity and impress your audience. This template can be altered and modified as per your expectations. So, grab it now.
SAC Planning And Implementation SAP Analytics Cloud Dashboard For Product Sales Analysis Icons PDF
This slide illustrates the SAP Analytics Cloud dashboard to monitor product sales performance. It provides information regarding the gross margin and net revenue earned, product performance state wise and year wise. Deliver and pitch your topic in the best possible manner with this SAC Planning And Implementation SAP Analytics Cloud Dashboard For Product Sales Analysis Icons PDF. Use them to share invaluable insights on Gross Margin, Earned Quarter Wise, Gross Margin, Net Revenue and impress your audience. This template can be altered and modified as per your expectations. So, grab it now.

Landing Page Leads And Revenue Generation Analytics For User Experience Optimization Dashboard Formats PDF
This slide covers website analytics based on revenue earned. It also included leads generated, bounce rates, customer churn stats, annual and monthly recurring revenue, etc. Pitch your topic with ease and precision using this Landing Page Leads And Revenue Generation Analytics For User Experience Optimization Dashboard Formats PDF. This layout presents information on Monthly Recurring Revenue, Bounce Rate, Gross Volume. It is also available for immediate download and adjustment. So, changes can be made in the color, design, graphics or any other component to create a unique layout.

Landing Page Speed Optimization And Bounce Rate Analytics Dashboard Topics PDF
This slide covers website loading speed analytics. It also includes average bounce rates, time spend on website, country based average load time, browser based bounce rates, etc. Pitch your topic with ease and precision using this Landing Page Speed Optimization And Bounce Rate Analytics Dashboard Topics PDF. This layout presents information on Avg Bounce Rate, Avg Pages, Per Session. It is also available for immediate download and adjustment. So, changes can be made in the color, design, graphics or any other component to create a unique layout.
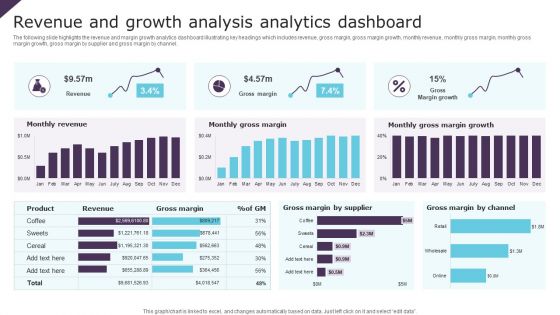
Revenue And Growth Analysis Analytics Dashboard Ppt Infographic Template Brochure PDF
The following slide highlights the revenue and margin growth analytics dashboard illustrating key headings which includes revenue, gross margin, gross margin growth, monthly revenue, monthly gross margin, monthly gross margin growth, gross margin by supplier and gross margin by channel. Pitch your topic with ease and precision using this Revenue And Growth Analysis Analytics Dashboard Ppt Infographic Template Brochure PDF. This layout presents information on Monthly Revenue, Monthly Gross Margin, Gross Margin Growth. It is also available for immediate download and adjustment. So, changes can be made in the color, design, graphics or any other component to create a unique layout.

Analyzing And Deploying HR Analytics Diversity Dashboard Of Enterprise Inspiration PDF
This slide shows the key performance metrics dashboard showing data related to HR operations of an organization. It shows key metrics such as gender diversity by business unit, headcount by seniority and age banding etc. Want to ace your presentation in front of a live audience Our Analyzing And Deploying HR Analytics Diversity Dashboard Of Enterprise Inspiration PDF can help you do that by engaging all the users towards you. Slidegeeks experts have put their efforts and expertise into creating these impeccable powerpoint presentations so that you can communicate your ideas clearly. Moreover, all the templates are customizable, and easy-to-edit and downloadable. Use these for both personal and commercial use.
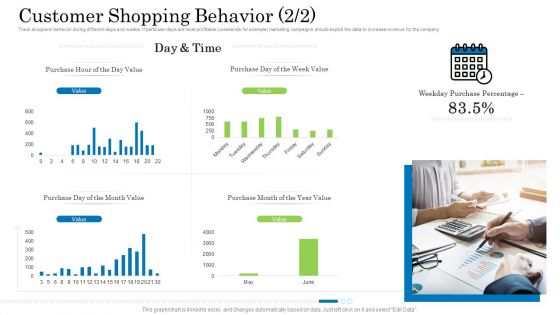
Customer Behavioral Data And Analytics Customer Shopping Behavior Week Inspiration PDF
Track shoppers behavior during different days and weeks. If particular days are most profitable weekends for example marketing campaigns should exploit the data to increase revenue for the company. Deliver and pitch your topic in the best possible manner with this customer behavioral data and analytics customer shopping behavior week inspiration pdf. Use them to share invaluable insights on purchase hour of the day value, purchase day of the week value, purchase day of the month value, purchase month of the year value and impress your audience. This template can be altered and modified as per your expectations. So, grab it now.
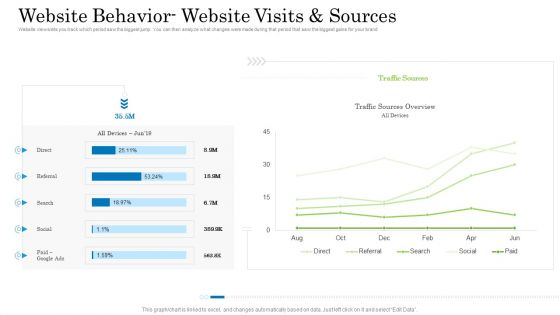
Customer Behavioral Data And Analytics Website Behavior Website Visits And Sources Structure PDF
Website views lets you track which period saw the biggest jump. You can then analyze what changes were made during that period that saw the biggest gains for your brand. Deliver and pitch your topic in the best possible manner with this customer behavioral data and analytics website behavior website visits and sources structure pdf. Use them to share invaluable insights on direct, referral, search, social and impress your audience. This template can be altered and modified as per your expectations. So, grab it now.

Retail Outlet Operational Efficiency Analytics Overview Of Retail Stores Rules PDF
This slide provides information regarding retail company in terms of headquarters, revenues, total number of employees, number of stores across USA. It also covers details of common operational challenges faced by stores. Deliver an awe inspiring pitch with this creative Retail Outlet Operational Efficiency Analytics Overview Of Retail Stores Rules PDF bundle. Topics like Retail Stores, Across USA, Common Operational Challenges can be discussed with this completely editable template. It is available for immediate download depending on the needs and requirements of the user.
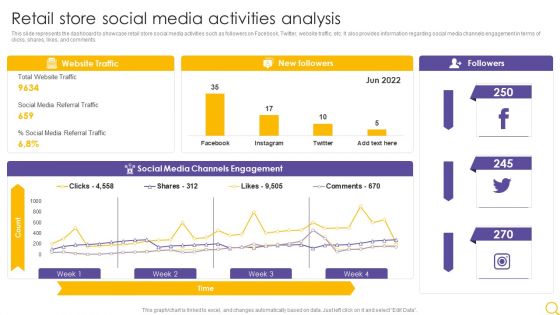
Retail Outlet Operational Efficiency Analytics Retail Store Social Media Activities Analysis Portrait PDF
This slide represents the dashboard to showcase retail store social media activities such as followers on Facebook, Twitter, website traffic, etc. It also provides information regarding social media channels engagement in terms of clicks, shares, likes, and comments. Deliver an awe inspiring pitch with this creative Retail Outlet Operational Efficiency Analytics Retail Store Social Media Activities Analysis Portrait PDF bundle. Topics like Website Traffic, New Followers, Social Media Channels can be discussed with this completely editable template. It is available for immediate download depending on the needs and requirements of the user.
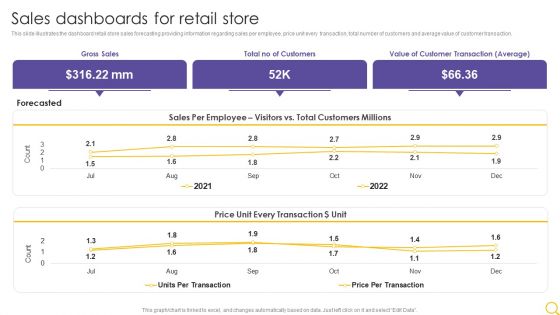
Retail Outlet Operational Efficiency Analytics Sales Dashboards For Retail Store Inspiration PDF
This slide illustrates the dashboard retail store sales forecasting providing information regarding sales per employee, price unit every transaction, total number of customers and average value of customer transaction. Deliver and pitch your topic in the best possible manner with this Retail Outlet Operational Efficiency Analytics Sales Dashboards For Retail Store Inspiration PDF. Use them to share invaluable insights on Gross Sales, Total No Customers, Value Customer and impress your audience. This template can be altered and modified as per your expectations. So, grab it now.

Customer Behavior Analytics Dashboard To Improve Satisfaction Ppt File Infographics PDF
The following slide provides an insight of websites performance that includes date parameters. The dashboard includes sessions, users, pageviews, bounce rate and percentage of new sessions. Pitch your topic with ease and precision using this Customer Behavior Analytics Dashboard To Improve Satisfaction Ppt File Infographics PDF. This layout presents information on Session, Avg Session Duration, Bounce Rate. It is also available for immediate download and adjustment. So, changes can be made in the color, design, graphics or any other component to create a unique layout.

Comprehensive Market Research Guide Brand Analytics Kpi Dashboard For Organization Brochure PDF
The following slide outlines key performance indicator KPI dashboard that can assist marketers to evaluate brand performance on social media channels. The metrics covered are age group, gender, brand perception, branding themes, celebrity analysis, etc. From laying roadmaps to briefing everything in detail, our templates are perfect for you. You can set the stage with your presentation slides. All you have to do is download these easy-to-edit and customizable templates. Comprehensive Market Research Guide Brand Analytics Kpi Dashboard For Organization Brochure PDF will help you deliver an outstanding performance that everyone would remember and praise you for. Do download this presentation today.
Cognitive Analytics Strategy And Techniques Tracking Customer Data Insights Dashboard Demonstration PDF
This slide provides information regarding customer data insights dashboard in terms of average churn risk, segments, high earner, highly engaged customers, etc. Take your projects to the next level with our ultimate collection of Cognitive Analytics Strategy And Techniques Tracking Customer Data Insights Dashboard Demonstration PDF. Slidegeeks has designed a range of layouts that are perfect for representing task or activity duration, keeping track of all your deadlines at a glance. Tailor these designs to your exact needs and give them a truly corporate look with your own brand colors they will make your projects stand out from the rest.
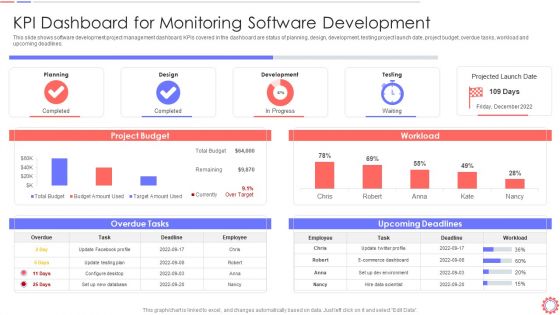
Developer Operations Automated Tools And Initiatives IT KPI Dashboard For Monitoring Demonstration PDF
This slide shows software development project management dashboard. KPIs covered in the dashboard are status of planning, design, development, testing project launch date, project budget, overdue tasks, workload and upcoming deadlines. Deliver an awe inspiring pitch with this creative developer operations automated tools and initiatives it kpi dashboard for monitoring demonstration pdf bundle. Topics like kpi dashboard for monitoring software development can be discussed with this completely editable template. It is available for immediate download depending on the needs and requirements of the user.
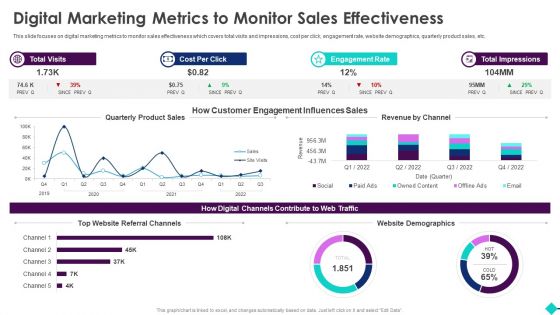
Sales Process Automation For Revenue Growth Digital Marketing Metrics To Monitor Sales Effectiveness Graphics PDF
This slide focuses on digital marketing metrics to monitor sales effectiveness which covers total visits and impressions, cost per click, engagement rate, website demographics, quarterly product sales, etc.Deliver and pitch your topic in the best possible manner with this Sales Process Automation For Revenue Growth Digital Marketing Metrics To Monitor Sales Effectiveness Graphics PDF. Use them to share invaluable insights on Automation Potential, Role Of Automation, Included Activities and impress your audience. This template can be altered and modified as per your expectations. So, grab it now.
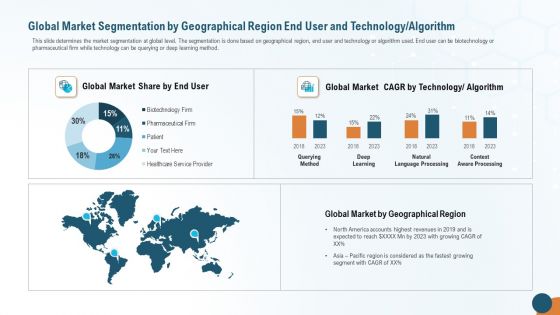
Global Market Segmentation By Geographical Region End User And Technology Algorithm Professional PDF
This slide determines the market segmentation at global level. The segmentation is done based on geographical region, end user and technology or algorithm used. End user can be biotechnology or pharmaceutical firm while technology can be querying or deep learning method. Deliver and pitch your topic in the best possible manner with this global market segmentation by geographical region end user and technology algorithm professional pdf. Use them to share invaluable insights on market share, technology, market by geographical region and impress your audience. This template can be altered and modified as per your expectations. So, grab it now.
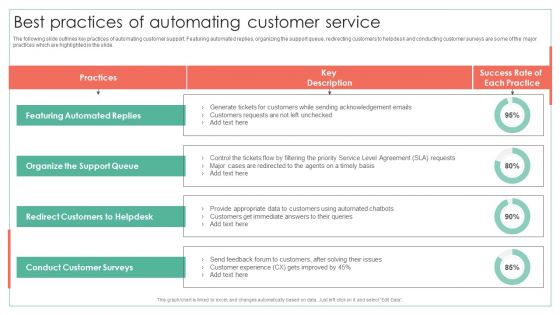
Best Practices Of Automating Customer Service Achieving Operational Efficiency Brochure PDF
The following slide outlines key practices of automating customer support. Featuring automated replies, organizing the support queue, redirecting customers to helpdesk and conducting customer surveys are some of the major practices which are highlighted in the slide. Deliver an awe inspiring pitch with this creative Best Practices Of Automating Customer Service Achieving Operational Efficiency Brochure PDF bundle. Topics like Featuring Automated, Support Queue, Redirect Customers can be discussed with this completely editable template. It is available for immediate download depending on the needs and requirements of the user.
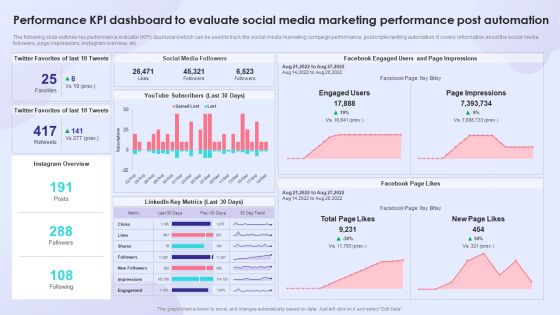
Performance KPI Dashboard To Evaluate Social Media Marketing Performance Post Automation Themes PDF
The following slide outlines key performance indicator KPI dashboard which can be used to track the social media marketing campaign performance, post implementing automation. It covers information about the social media followers, page impressions, instagram overview, etc. Deliver and pitch your topic in the best possible manner with this Performance KPI Dashboard To Evaluate Social Media Marketing Performance Post Automation Themes PDF. Use them to share invaluable insights on Social Media Followers, Linkedin Key Metrics, Performance KPI Dashboard and impress your audience. This template can be altered and modified as per your expectations. So, grab it now.
Warehouse Automation Deployment Dashboard For Tracking Impact Of Warehouse House Infographics PDF
This slide covers the dashboard with after automation warehouse overview. It include KPIs such as autonomous robots status, robotic arms status, battery level, performance, time to return, etc. Deliver and pitch your topic in the best possible manner with this Warehouse Automation Deployment Dashboard For Tracking Impact Of Warehouse House Infographics PDF. Use them to share invaluable insights on Autonomous Robot, Systems Engineer, Warehouse Manager and impress your audience. This template can be altered and modified as per your expectations. So, grab it now.
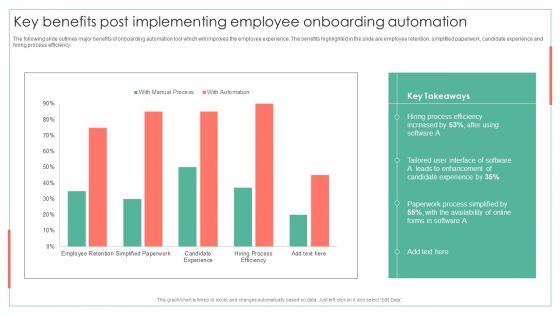
Key Benefits Post Implementing Employee Onboarding Automation Achieving Operational Efficiency Elements PDF
The following slide outlines major benefits of onboarding automation tool which will improves the employee experience. The benefits highlighted in the slide are employee retention, simplified paperwork, candidate experience and hiring process efficiency. Deliver an awe inspiring pitch with this creative Key Benefits Post Implementing Employee Onboarding Automation Achieving Operational Efficiency Elements PDF bundle. Topics like Process Efficiency, Interface Software, Paperwork Process can be discussed with this completely editable template. It is available for immediate download depending on the needs and requirements of the user.

Continuous Integration Dashboard For Automated Testing Framework Ppt Layouts Layout Ideas PDF
This slide shows continuous integration dashboard for test automation framework which can be referred by authors to review their testing performance. It contains information about weekly change volume by author, monthly change volume by author, repository, etc. Pitch your topic with ease and precision using this Continuous Integration Dashboard For Automated Testing Framework Ppt Layouts Layout Ideas PDF. This layout presents information on Total Changes Volume, Monthly Change Volume, Weekly Change Volume. It is also available for immediate download and adjustment. So, changes can be made in the color, design, graphics or any other component to create a unique layout.
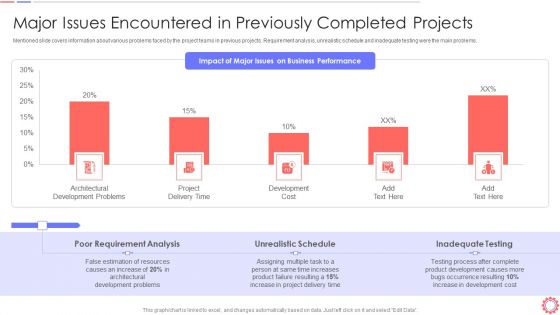
Developer Operations Automated Tools And Initiatives IT Major Issues Encountered Ideas PDF
Mentioned slide covers information about various problems faced by the project teams in previous projects. Requirement analysis, unrealistic schedule and inadequate testing were the main problems. Following slide provides information about the global DevOps market share. It shows the details about DevOps market growth estimation during 2019 to 2024. Deliver an awe inspiring pitch with this creative developer operations automated tools and initiatives it major issues encountered ideas pdf bundle. Topics like poor requirement analysis, unrealistic schedule, inadequate testing can be discussed with this completely editable template. It is available for immediate download depending on the needs and requirements of the user.

 Home
Home