Agenda Infographic
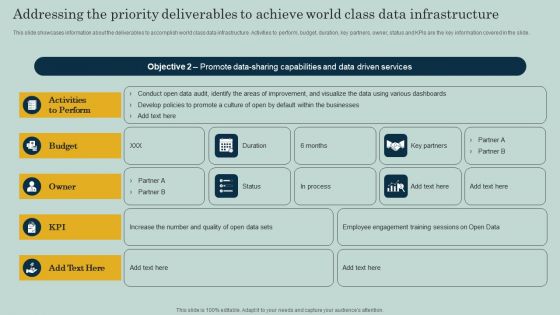
Addressing The Priority Deliverables To Achieve World Class Data Infrastructure Ppt Infographics Smartart PDF
This slide showcases information about the deliverables to accomplish world class data infrastructure. Activities to perform, budget, duration, key partners, owner, status and KPIs are the key information covered in the slide. There are so many reasons you need a Addressing The Priority Deliverables To Achieve World Class Data Infrastructure Ppt Infographics Smartart PDF. The first reason is you cannot spend time making everything from scratch, Thus, Slidegeeks has made presentation templates for you too. You can easily download these templates from our website easily.
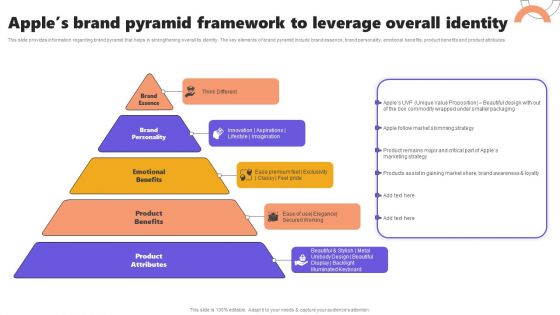
Apples Brand Pyramid Framework To Leverage Overall Identity Ppt Pictures Infographics PDF
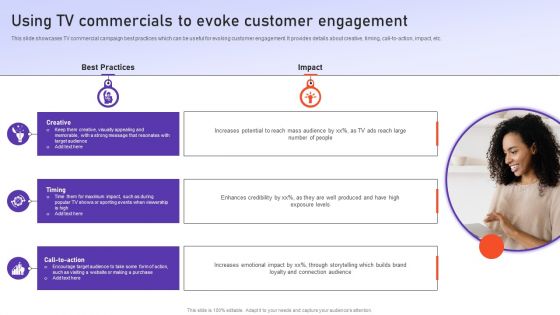
Using TV Commercials To Evoke Customer Engagement Ppt PowerPoint Presentation File Infographics PDF

Strategic Approaches To Efficient Candidate Selection Elements For Selecting Right Candidate For Job Infographics PDF
Following slide represents elements to consider that helps companies to select potential candidates for particular job profile. It includes elements such as proper time, evaluate needs and check backgrounds. There are so many reasons you need a Strategic Approaches To Efficient Candidate Selection Elements For Selecting Right Candidate For Job Infographics PDF. The first reason is you can not spend time making everything from scratch, Thus, Slidegeeks has made presentation templates for you too. You can easily download these templates from our website easily.
CRM System Implementation Stages CRM Strategy Customer Interaction And Behavior Tracking Infographics PDF
This slide covers client interaction and behaviour monitoring strategies implemented in the new CRM software. It includes steps such as email, calls and meeting clients through CRM, recording all conversations, tracking clients purchase history, etc. Deliver an awe inspiring pitch with this creative CRM System Implementation Stages CRM Strategy Customer Interaction And Behavior Tracking Infographics PDF bundle. Topics like Purchase Preferences, Customer Complaints, Inquiries Referrals can be discussed with this completely editable template. It is available for immediate download depending on the needs and requirements of the user.
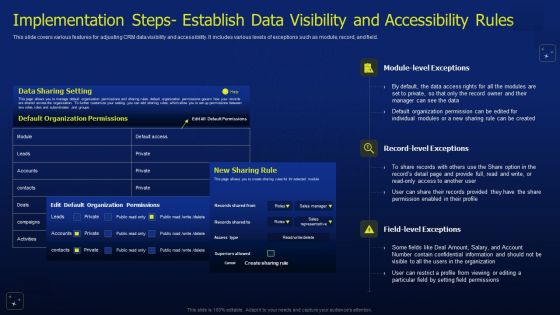
CRM Software Deployment Journey Implementation Steps Establish Data Visibility Infographics PDF
This slide covers various features for adjusting CRM data visibility and accessibility. It includes various levels of exceptions such as module, record, and field. The CRM Software Deployment Journey Implementation Steps Establish Data Visibility Infographics PDF is a compilation of the most recent design trends as a series of slides. It is suitable for any subject or industry presentation, containing attractive visuals and photo spots for businesses to clearly express their messages. This template contains a variety of slides for the user to input data, such as structures to contrast two elements, bullet points, and slides for written information. Slidegeeks is prepared to create an impression.

Overview For Effective Health Transforming Medical Workflows Via His Integration Infographics Pdf
This slide covers overview for effective health information system to enhance medicare services. It involves electronic health record, patient portal and medical billing. Slidegeeks is one of the best resources for PowerPoint templates. You can download easily and regulate Overview For Effective Health Transforming Medical Workflows Via His Integration Infographics Pdf for your personal presentations from our wonderful collection. A few clicks is all it takes to discover and get the most relevant and appropriate templates. Use our Templates to add a unique zing and appeal to your presentation and meetings. All the slides are easy to edit and you can use them even for advertisement purposes.
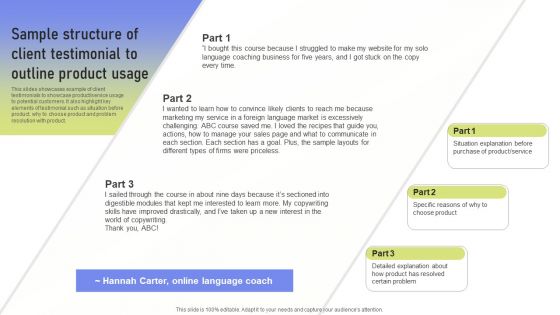
Sample Structure Of Client Testimonial To Outline Product Usage Ppt PowerPoint Presentation File Infographics PDF
This slides showcases example of client testimonials to showcase product service usage to potential customers. It also highlight key elements of testimonial such as situation before product, why to choose product and problem resolution with product. Do you know about Slidesgeeks Sample Structure Of Client Testimonial To Outline Product Usage Ppt PowerPoint Presentation File Infographics PDF. These are perfect for delivering any kind od presentation. Using it, create PowerPoint presentations that communicate your ideas and engage audiences. Save time and effort by using our pre designed presentation templates that are perfect for a wide range of topic. Our vast selection of designs covers a range of styles, from creative to business, and are all highly customizable and easy to edit. Download as a PowerPoint template or use them as Google Slides themes.

Depicting Impact On Project Success Rate Strategies To Enhance Project Lifecycle Infographics PDF
This slide focuses on impact of project management plan on success rate which compares project success due to efficient scheduling, capable project team, etc.This Depicting Impact On Project Success Rate Strategies To Enhance Project Lifecycle Infographics PDF from Slidegeeks makes it easy to present information on your topic with precision. It provides customization options, so you can make changes to the colors, design, graphics, or any other component to create a unique layout. It is also available for immediate download, so you can begin using it right away. Slidegeeks has done good research to ensure that you have everything you need to make your presentation stand out. Make a name out there for a brilliant performance.

Major Partner Engagement Issues Ppt PowerPoint Presentation Infographics Slide Download PDF
Presenting this set of slides with name major partner engagement issues ppt powerpoint presentation infographics slide download pdf. The topics discussed in these slides are getting co marketing funding and support, local competion from too many other service partners, getting our partners trusted and engaged with our field teams, getting engaged with their local sales and service field teams, finding the right profile of partner with the right skills. This is a completely editable PowerPoint presentation and is available for immediate download. Download now and impress your audience.
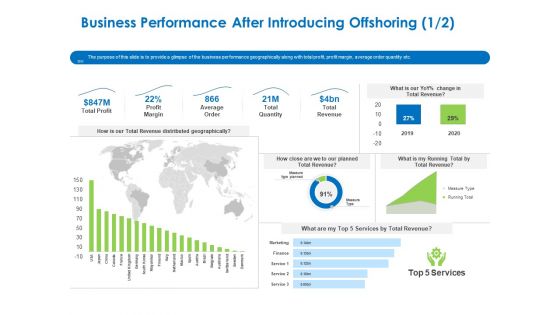
Relocation Of Business Process Offshoring Business Performance After Introducing Offshoring Infographics PDF
The purpose of this slide is to provide a glimpse of the business performance geographically along with total profit, profit margin, average order quantity etc. Deliver and pitch your topic in the best possible manner with this relocation of business process offshoring business performance after introducing offshoring infographics pdf. Use them to share invaluable insights on total profit, profit margin, average order, total quantity, total revenue and impress your audience. This template can be altered and modified as per your expectations. So, grab it now.
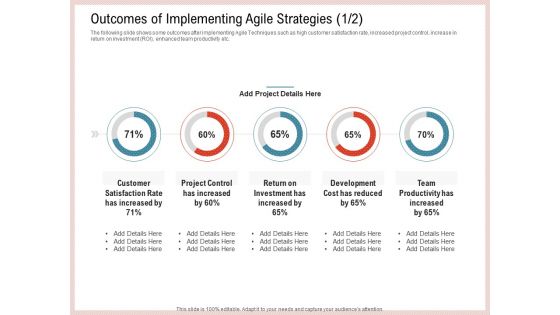
Agile Model Improve Task Team Performance Outcomes Of Implementing Agile Strategies Cost Infographics PDF
The following slide shows some outcomes after implementing Agile Techniques such as high customer satisfaction rate, increased project control, increase in return on investment ROI, enhanced team productivity etc. Deliver and pitch your topic in the best possible manner with this agile model improve task team performance outcomes of implementing agile strategies cost infographics pdf. Use them to share invaluable insights on investment, development cost, team productivity and impress your audience. This template can be altered and modified as per your expectations. So, grab it now.

Investor Pitch Gain Funding From ICO Market Potential And Opportunity Size For The Company Infographics PDF
The slide provides a the comparison graph of market size of online money transfer remittances mobile payment market. It covers the historical 2014 2019 as well as forecasted 2020 2025 data.Deliver and pitch your topic in the best possible manner with this investor pitch gain funding from ico market potential and opportunity size for the company infographics pdf. Use them to share invaluable insights on online money transfer market, 2014 to 2025 and impress your audience. This template can be altered and modified as per your expectations. So, grab it now.
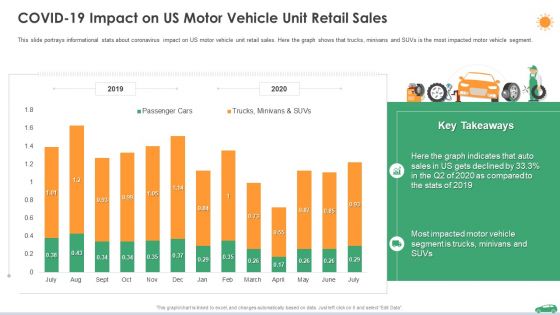
Covid 19 Impact On Us Motor Vehicle Unit Retail Sales Ppt Infographics Example PDF
This slide portrays informational stats about coronavirus impact on US motor vehicle unit retail sales. Here the graph shows that trucks, minivans and SUVs is the most impacted motor vehicle segment. Deliver an awe inspiring pitch with this creative covid 19 impact on us motor vehicle unit retail sales ppt infographics example pdf bundle. Topics like covid 19 impact on us motor vehicle unit retail sales can be discussed with this completely editable template. It is available for immediate download depending on the needs and requirements of the user.

Agile Methodologies Outcomes Of Implementing Agile Strategies Costs Ppt Infographics Summary PDF
The following slide shows some outcomes after implementing Agile Techniques such as enhanced team collaboration, increase in project visibility rate, reduction in lead time between tasks etc. Deliver and pitch your topic in the best possible manner with this agile methodologies outcomes of implementing agile strategies costs ppt infographics summary pdf. Use them to share invaluable insights on team collaboration has increased, software maintenance at minimal costs, project details, team collaboration and impress your audience. This template can be altered and modified as per your expectations. So, grab it now.
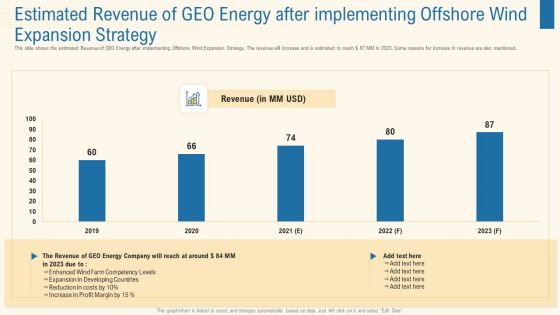
Estimated Revenue Of Geo Energy After Implementing Offshore Wind Expansion Strategy Infographics PDF
This slide shows the estimated Revenue of GEO Energy after implementing Offshore Wind Expansion Strategy. The revenue will increase and is estimated to reach 87 MM in 2023. Some reasons for increase in revenue are also mentioned. Deliver and pitch your topic in the best possible manner with this estimated revenue of geo energy after implementing offshore wind expansion strategy infographics pdf. Use them to share invaluable insights on developing, expansion, costs, revenue and impress your audience. This template can be altered and modified as per your expectations. So, grab it now.

Stock Turnover Rate Of ADC Cosmetics Company In Past 5 Years Infographics PDF
This slide shows decline in Stock Turnover Rate of ADC Cosmetics Company due to declining revenue, high cash to cash cycle time, poor stock forecasting, Incompetent Team, Poor Cross Selling Skills etc. Deliver and pitch your topic in the best possible manner with this stock turnover rate of adc cosmetics company in past 5 years infographics pdf. Use them to share invaluable insights on stock turnover rate, 2017 to 2021 and impress your audience. This template can be altered and modified as per your expectations. So, grab it now.

Estimated Positive Impact Of SW Care Company Strategies On The Patients Infographics PDF
This slide shows the future impact of strategies adopted by SW Care Company with respect to patient treated in the coming years along with key takeaways. Deliver an awe inspiring pitch with this creative estimated positive impact of sw care company strategies on the patients infographics pdf bundle. Topics like estimated positive impact of sw care company strategies on the patients can be discussed with this completely editable template. It is available for immediate download depending on the needs and requirements of the user.

Problem And Solution 5 Fall In The Rate Of Net Promoter Score NPS Infographics PDF
This slide shows the problem that the company is facing related to falling Net Promoter Score due to decreasing potential customer satisfaction rate and increasing loyalty issues. Also, some recommendations are provided to solve the problem. Deliver an awe-inspiring pitch with this creative problem and solution 5 fall in the rate of net promoter score nps infographics pdf. bundle. Topics like net promoter score, 2017 to 2021 can be discussed with this completely editable template. It is available for immediate download depending on the needs and requirements of the user.

Social Statistics After The Implementation Of Strategy Ppt Infographics Smartart PDF
This slide shows the information related to ABC Zoos followers in social media Instagram and Facebook, which shows an increase in the total number of followers due to successful implementation of ABC Zoos strategies.Deliver and pitch your topic in the best possible manner with this social statistics after the implementation of strategy ppt infographics smartart pdf. Use them to share invaluable insights on instagram followers, 2020 to 2024 and impress your audience. This template can be altered and modified as per your expectations. So, grab it now.
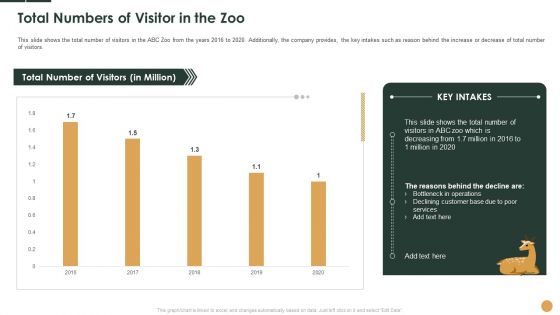
Total Numbers Of Visitor In The Zoo Ppt Infographics Show PDF
This slide shows the total number of visitors in the ABC Zoo from the years 2016 to 2020. Additionally, the company provides, the key intakes such as reason behind the increase or decrease of total number of visitors.Deliver and pitch your topic in the best possible manner with this total numbers of visitor in the zoo ppt infographics show pdf. Use them to share invaluable insights on total number of visitors, 2018 to 2020 and impress your audience. This template can be altered and modified as per your expectations. So, grab it now.
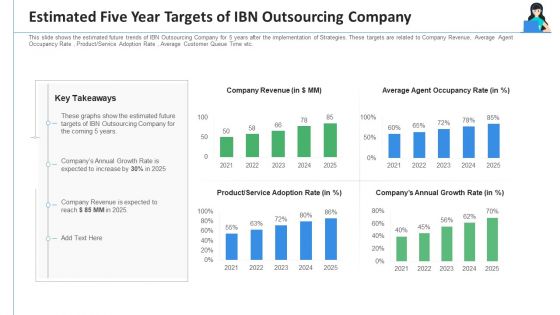
Estimated Five Year Targets Of IBN Outsourcing Company Ppt Infographics Demonstration PDF
This slide shows the estimated future trends of IBN Outsourcing Company for 5 years after the implementation of Strategies. These targets are related to Company Revenue, Average Agent Occupancy Rate , Product Service Adoption Rate , Average Customer Queue Time etc. Deliver and pitch your topic in the best possible manner with this estimated five year targets of IBN outsourcing company ppt infographics demonstration pdf. Use them to share invaluable insights on company revenue, product service, companys annual growth rate and impress your audience. This template can be altered and modified as per your expectations. So, grab it now.

Initiating Hazard Managing Structure Firm Number Of Risks Encountered And Resolved Till Date Infographics PDF
This slide illustrates status of risk encountered and resolved in till date. It includes information of issues by status, priority and resolved status. Deliver and pitch your topic in the best possible manner with this initiating hazard managing structure firm number of risks encountered and resolved till date infographics pdf. Use them to share invaluable insights on number of risks encountered and resolved till date and impress your audience. This template can be altered and modified as per your expectations. So, grab it now.

What Concerns Firm Is Facing In Absence Of Partners At Present Infographics PDF
This slide portrays information regarding the concerns that are currently existing in the organizations due to absence of partners as they have severe impact on firms growth in terms of huge low brand awareness with low market share as compared to its competitors. Deliver and pitch your topic in the best possible manner with this what concerns firm is facing in absence of partners at present infographics pdf. Use them to share invaluable insights on sales margin, lowest market, less profit margin and impress your audience. This template can be altered and modified as per your expectations. So, grab it now.

Post Initial Public Offering Equity Financing Pitch Non Performing Assets Loans Graph Infographics PDF
This slide Provides the graph of historical and Forecasted Non-Performing Assets Loans in percent for the period 2015 to 2023 and the Strategies used by the company to reduce NPA over that period. Deliver an awe inspiring pitch with this creative post initial public offering equity financing pitch non performing assets loans graph infographics pdf bundle. Topics like secured assets, performing assets, 2015 to 2023 can be discussed with this completely editable template. It is available for immediate download depending on the needs and requirements of the user.
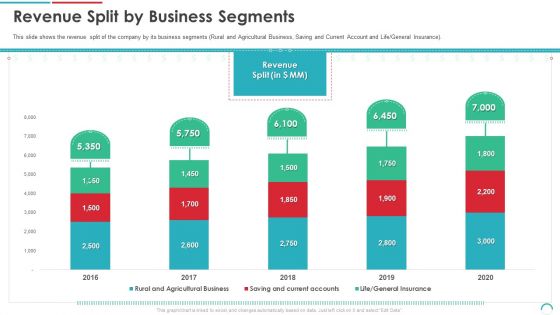
Post Initial Public Offering Equity Financing Pitch Revenue Split By Business Segments Infographics PDF
This slide shows the revenue split of the company by its business segments Rural and Agricultural Business, Saving and Current Account and Life General Insurance. Deliver and pitch your topic in the best possible manner with this post initial public offering equity financing pitch revenue split by business segments infographics pdf. Use them to share invaluable insights on revenue split by business segments, 2016 to 2020 and impress your audience. This template can be altered and modified as per your expectations. So, grab it now.

Number Of Customers Projection For Next Five Years Ppt Infographics Format PDF
This slide provides the projections of key performance indicators KPIs related to customer onboarding. KPIs covered in this slide include number of customers, customer churn rate, customer retention rate etc. Deliver and pitch your topic in the best possible manner with this number of customers projection for next five years ppt infographics format pdf. Use them to share invaluable insights on number of customers projection for next five years and impress your audience. This template can be altered and modified as per your expectations. So, grab it now.
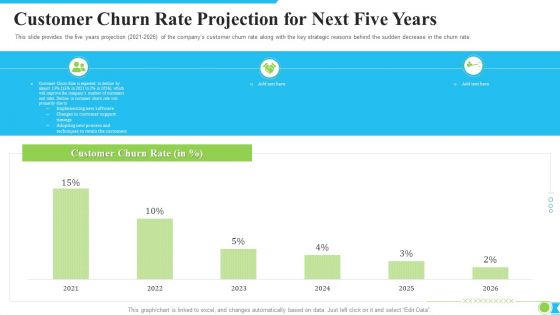
Customer Churn Rate Projection For Next Five Years Ppt Styles Infographics PDF
This slide provides the five years projection 2021 2026 of the companys customer churn rate along with the key strategic reasons behind the sudden decrease in the churn rate. Deliver and pitch your topic in the best possible manner with this customer churn rate projection for next five years ppt styles infographics pdf. Use them to share invaluable insights on customer churn rate projection for next five years and impress your audience. This template can be altered and modified as per your expectations. So, grab it now.
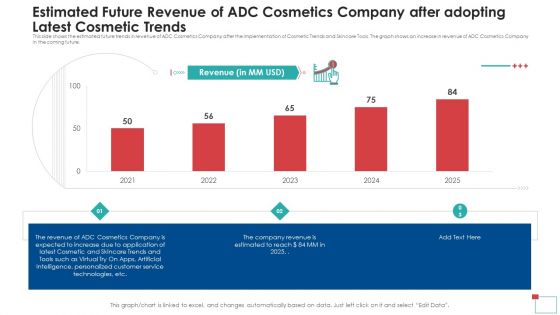
Estimated Future Revenue Of ADC Cosmetics Company After Adopting Latest Cosmetic Trends Infographics PDF
This slide shows the estimated future trends in revenue of ADC Cosmetics Company after the implementation of Cosmetic Trends and Skincare Tools. The graph shows an increase in revenue of ADC Cosmetics Company in the coming future. Deliver an awe-inspiring pitch with this creative estimated future revenue of adc cosmetics company after adopting latest cosmetic trends infographics pdf bundle. Topics like estimated future revenue of adc cosmetics company after adopting latest cosmetic trends can be discussed with this completely editable template. It is available for immediate download depending on the needs and requirements of the user.
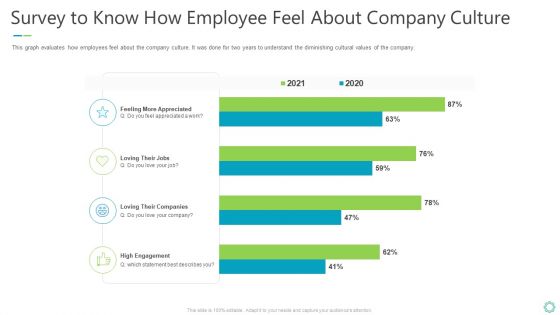
Transforming Organizational Processes And Outcomes Survey To Know How Employee Feel About Company Culture Infographics PDF
This graph evaluates how employees feel about the company culture. It was done for two years to understand the diminishing cultural values of the company. Deliver an awe inspiring pitch with this creative transforming organizational processes and outcomes survey to know how employee feel about company culture infographics pdf bundle. Topics like survey to know how employee feel about company culture can be discussed with this completely editable template. It is available for immediate download depending on the needs and requirements of the user.

Merger Agreement Pitch Deck Industry Overview And Market Trends Infographics PDF
The slide provides the industry overview and key facts market trends of the industry. Additionally, it provides market size for the year 2016 to 2025 and market share 2021 of the industry.Deliver and pitch your topic in the best possible manner with this merger agreement pitch deck industry overview and market trends infographics pdf. Use them to share invaluable insights on mergers and acquisitions, general advisory, assets management and impress your audience. This template can be altered and modified as per your expectations. So, grab it now.
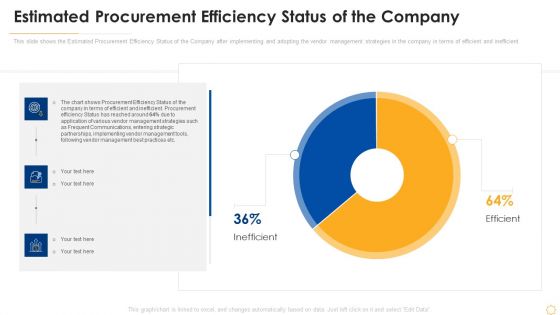
Successful Vendor Management Approaches To Boost Procurement Efficiency Estimated Procurement Efficiency Infographics PDF
This slide shows the Estimated Procurement Efficiency Status of the Company after implementing and adopting the vendor management strategies in the company in terms of efficient and inefficient. Deliver and pitch your topic in the best possible manner with this successful vendor management approaches to boost procurement efficiency estimated procurement efficiency infographics pdf. Use them to share invaluable insights on management, implementing, communications, strategic, procurement and impress your audience. This template can be altered and modified as per your expectations. So, grab it now.
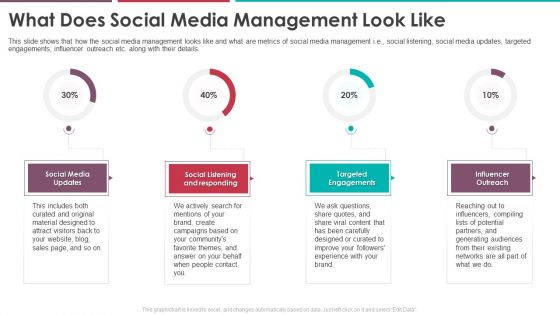
What Does Social Media Management Look Like Pitch Deck Of Vulpine Interactive Fundraising Infographics Pdf
This slide shows that how the social media management looks like and what are metrics of social media management i.e. social listening, social media updates, targeted engagements, influencer outreach etc. along with their details. Deliver an awe inspiring pitch with this creative what does social media management look like pitch deck of vulpine interactive fundraising infographics pdf bundle. Topics like social listening and responding, social media updates, targeted engagements, influencer outreach can be discussed with this completely editable template. It is available for immediate download depending on the needs and requirements of the user.

Problem And Solution 4 Decrease In Customer Loyalty Level Infographics PDF
This slide shows the problem that the company is facing related to decrease in the percentage of Customer Loyalty as a result of Declining Customer Retention Rate of the Company. The solution is to provide additional value and offers to the customers in order to gain competitive edge.Deliver an awe-inspiring pitch with this creative problem and solution 4 decrease in customer loyalty level infographics pdf. bundle. Topics like customer engagement index, 2017 to 2021 can be discussed with this completely editable template. It is available for immediate download depending on the needs and requirements of the user.
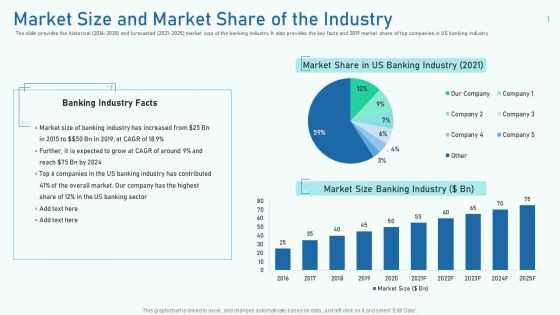
Market Size And Market Share Of The Industry Ppt Infographics Model PDF
The slide provides the historical 2016 to 2020 and forecasted 2021 to 2025 market size of the banking industry. It also provides the key facts and 2019 market share of top companies in US banking industry.Deliver an awe-inspiring pitch with this creative market size and market share of the industry ppt infographics model pdf. bundle. Topics like market share in us banking industry, market size banking industry, 2017 to 2026 can be discussed with this completely editable template. It is available for immediate download depending on the needs and requirements of the user.
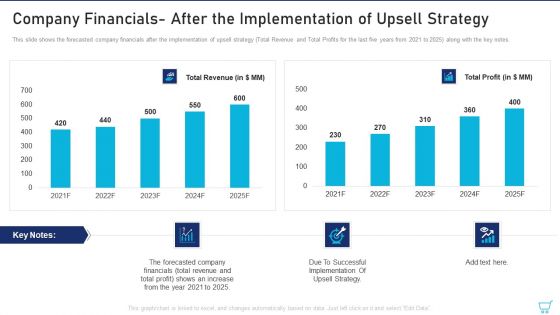
Company Financials After The Implementation Of Upsell Strategy Ppt Infographics Slide Portrait PDF
This slide shows the forecasted company financials after the implementation of upsell strategy Total Revenue and Total Profits for the last five years from 2021 to 2025 along with the key notes. Deliver an awe inspiring pitch with this creative company financials after the implementation of upsell strategy ppt infographics slide portrait pdf bundle. Topics like company financials after the implementation of upsell strategy can be discussed with this completely editable template. It is available for immediate download depending on the needs and requirements of the user.
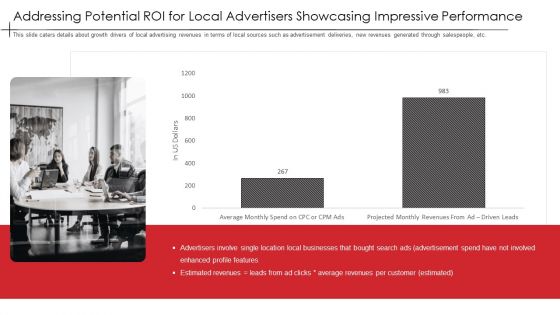
Addressing Potential Roi For Local Advertisers Showcasing Impressive Performance Infographics PDF
This slide caters details about growth drivers of local advertising revenues in terms of local sources such as advertisement deliveries, new revenues generated through salespeople, etc. Deliver and pitch your topic in the best possible manner with this addressing potential roi for local advertisers showcasing impressive performance infographics pdf. Use them to share invaluable insights on addressing potential roi for local advertisers showcasing impressive performance and impress your audience. This template can be altered and modified as per your expectations. So, grab it now.

Professional Scrum Master Training IT Number Of Risks Encountered And Resolved By Project Managers Infographics PDF
This slide shows the status of toral risk encountered and resolved by the team post agile methodology adoption. It includes metrics such as total risks, open, improvising closed and mitigated. Deliver an awe inspiring pitch with this creative professional scrum master training it number of risks encountered and resolved by project managers infographics pdf bundle. Topics like number of risks encountered and resolved by project managers can be discussed with this completely editable template. It is available for immediate download depending on the needs and requirements of the user.

Client Acquisition Cost For Customer Retention Search Engine Marketing Dashboard For CAC Calculation Infographics PDF
This slide shows a Search Engine Marketing Dashboard with details such as lead form paid search, CAC, top performing campaigns, cost per conversion, cost per click etc. Deliver an awe inspiring pitch with this creative client acquisition cost for customer retention search engine marketing dashboard for cac calculation infographics pdf bundle. Topics like performing, campaign, social media, marketing, customer acquisition cost can be discussed with this completely editable template. It is available for immediate download depending on the needs and requirements of the user.
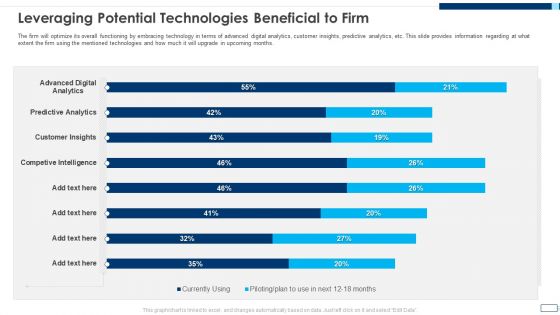
Evolving BI Infrastructure Leveraging Potential Technologies Beneficial To Firm Infographics PDF
The firm will optimize its overall functioning by embracing technology in terms of advanced digital analytics, customer insights, predictive analytics, etc. This slide provides information regarding at what extent the firm using the mentioned technologies and how much it will upgrade in upcoming months. Deliver and pitch your topic in the best possible manner with this evolving bi infrastructure leveraging potential technologies beneficial to firm infographics pdf. Use them to share invaluable insights on advanced digital analytics, customer insights, predictive analytics and impress your audience. This template can be altered and modified as per your expectations. So, grab it now.

Corporate Profile IT Organization Employee Count Of The Company For Last Five Years Infographics PDF
The slide shows the employee count of the company from the year 2017-2021 and their split by geography and functions, at the end of Dec 2021. Deliver an awe inspiring pitch with this creative corporate profile it organization employee count of the company for last five years infographics pdf bundle. Topics like engineering, global sales m and o, worldwide, commercial business, business functions, finance, hr and legal, linkedin can be discussed with this completely editable template. It is available for immediate download depending on the needs and requirements of the user.

Enhancing B2B Demand Creation And Sales Growth Addressing Key Concerns Faced By Sales Infographics PDF
This slide provides information regarding key concerns face by sales team in managing B2B buyer in terms of buyer getting disconnected with sales team, sales representatives unable to add value to purchase processes, rise in sales enablement spending. Deliver and pitch your topic in the best possible manner with this enhancing b2b demand creation and sales growth addressing key concerns faced by sales infographics pdf. Use them to share invaluable insights on processes, sales team, sales enablement and impress your audience. This template can be altered and modified as per your expectations. So, grab it now.

Evaluating Price Efficiency In Organization Role Of Customer Demand In Pricing Analysis Infographics PDF
This slide covers the relationship between price and other factors such as customer demand, sales revenues, product costs, gross profits, and product positioning. Deliver and pitch your topic in the best possible manner with this evaluating price efficiency in organization role of customer demand in pricing analysis infographics pdf. Use them to share invaluable insights on customer demand, sales revenues, product costs, gross profits, product positioning and impress your audience. This template can be altered and modified as per your expectations. So, grab it now.

Estimated Five Year Targets Of NSS Electronic Manufacturing Company Infographics PDF
This slide shows the estimated future trends of NSS Electronic Manufacturing Company for 5 years after the implementation of Strategies. These targets are related to Company Revenue, Production Volume, Capacity Utilization, Company Utilization etc. Deliver an awe inspiring pitch with this creative estimated five year targets of nss electronic manufacturing company infographics pdf bundle. Topics like estimated five year targets of nss electronic manufacturing company can be discussed with this completely editable template. It is available for immediate download depending on the needs and requirements of the user.
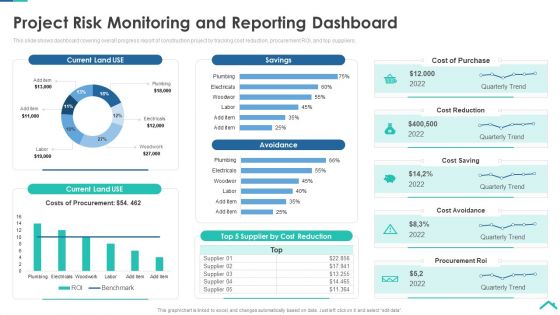
Risk Analysis Strategies For Real Estate Construction Project Project Risk Monitoring And Reporting Infographics PDF
This slide shows dashboard covering overall progress report of construction project by tracking cost reduction, procurement ROI, and top suppliers. Deliver and pitch your topic in the best possible manner with this risk analysis strategies for real estate construction project project risk monitoring and reporting infographics pdf. Use them to share invaluable insights on cost of purchase, cost reduction, cost saving, cost avoidance, procurement roi and impress your audience. This template can be altered and modified as per your expectations. So, grab it now.
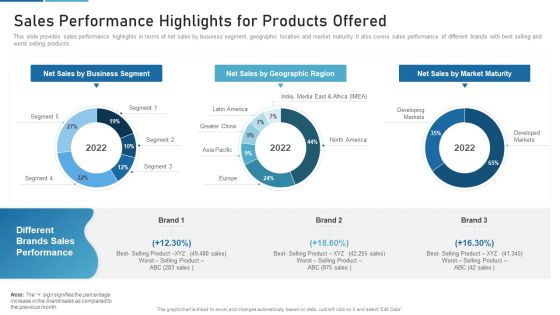
Sales Process Catalogue Template Sales Performance Highlights For Products Offered Infographics PDF
This slide provides sales performance highlights in terms of net sales by business segment, geographic location and market maturity. It also covers sales performance of different brands with best selling and worst selling products. Deliver and pitch your topic in the best possible manner with this sales process catalogue template sales performance highlights for products offered infographics pdf. Use them to share invaluable insights on net sales by business segment, net sales by geographic region, net sales by market maturity and impress your audience. This template can be altered and modified as per your expectations. So, grab it now.

Performance Analysis Of New Product Development Product Sales Vs Product Return Infographics PDF
Purpose of the following slide is to show the product sales vs. product return ratio of the organization, the provided graph displays the sales of the product in each month in comparison to the returns. Deliver an awe inspiring pitch with this creative performance analysis of new product development product sales vs product return infographics pdf bundle. Topics like comparison, sales, returns can be discussed with this completely editable template. It is available for immediate download depending on the needs and requirements of the user.

Strategy To Enhance Buyer Intimacy Identifying Customer Touch Points Ppt Infographics Diagrams PDF
This slide aims to identify key customer touch points to be optimized in order to gain leverage on company service delivery message. It alos covers key insights related to preferred customer touch points. Deliver and pitch your topic in the best possible manner with this strategy to enhance buyer intimacy identifying customer touch points ppt infographics diagrams pdf. Use them to share invaluable insights on identifying customer touch points and impress your audience. This template can be altered and modified as per your expectations. So, grab it now.

Technology Investor Financing Pitch Deck Financial Projections After Launch Of Ai App Infographics PDF
This template depicts revenue estimation in the first 18 months after launch of the AI application. Here we have includes key takeaways of the presentation and CTA of the project. Deliver an awe inspiring pitch with this creative technology investor financing pitch deck financial projections after launch of ai app infographics pdf bundle. Topics like financial projections after launch of ai app can be discussed with this completely editable template. It is available for immediate download depending on the needs and requirements of the user.

Project Management Professional Certification IT Old Vs New Blueprint Of PMP Certification Exam Initiating Infographics PDF
Following slide illustrates information on the old versus new blueprint of PMP certification exam. Here the slide shows that there is a shift towards predictive and agile approaches. Deliver and pitch your topic in the best possible manner with this project management professional certification it old vs new blueprint of pmp certification exam initiating infographics pdf. Use them to share invaluable insights on requirements, design, implementation, testing, development and impress your audience. This template can be altered and modified as per your expectations. So, grab it now.

Marketing Communication Channels For Increasing Brand Awarenes Mapping Our Customer Journey Infographics PDF
Understanding the customer journey is a key step that helps the organization to analyze their marketing efforts in an efficient way. The following slide provides a brief insight into the journey of your customer as it maps each stage of customer journey starting from awareness, acquisition, conversion retention and loyalty. Deliver an awe inspiring pitch with this creative marketing communication channels for increasing brand awarenes mapping our customer journey infographics pdf bundle. Topics like mapping our customer journey can be discussed with this completely editable template. It is available for immediate download depending on the needs and requirements of the user.

Food Delivery Service Fundraising On Demand Online Food Delivery Market Overview Ppt Infographics Mockup PDF
This slide shows some of the global market trends of On Demand Online Food Delivery Platforms worldwide. The slide shows the global Online Food Delivery market growth rate CAGR, fastest growing market and the largest market, online food delivery market key growth driver, major industry players etc. Deliver an awe inspiring pitch with this creative food delivery service fundraising on demand online food delivery market overview ppt infographics mockup pdf bundle. Topics like on demand online food delivery market overview can be discussed with this completely editable template. It is available for immediate download depending on the needs and requirements of the user.

Execution Of ERP System To Enhance Business Effectiveness Current Real Time Data Infographics PDF
This slide shows the future estimated Real Time Data Accessibility status of the company in terms of accessible and not accessible after implementation of an integrated ERP system with advanced business intelligence and proactive decision making.Deliver and pitch your topic in the best possible manner with this Execution of erp system to enhance business effectiveness current real time data infographics pdf Use them to share invaluable insights on status of the company, intelligence and proactive, advanced business and impress your audience. This template can be altered and modified as per your expectations. So, grab it now.
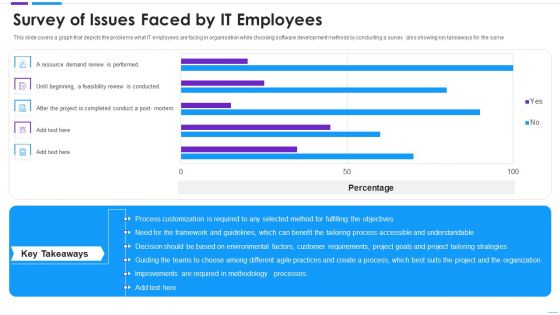
Agile Application Development Survey Of Issues Faced By IT Employees Infographics PDF
This slide covers a graph that depicts the problems what IT employees are facing in organisation while choosing software development methods by conducting a survey also showing key takeaways for the same. Deliver and pitch your topic in the best possible manner with this agile application development survey of issues faced by it employees infographics pdf. Use them to share invaluable insights on required, method, process, project, organization and impress your audience. This template can be altered and modified as per your expectations. So, grab it now.
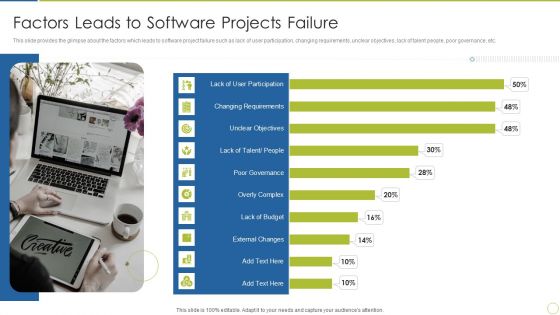
Continuous Enhancement In Project Based Companies Factors Leads To Software Projects Failure Infographics PDF
This slide provides the glimpse about the factors which leads to software project failure such as lack of user participation, changing requirements, unclear objectives, lack of talent people, poor governance, etc.Deliver and pitch your topic in the best possible manner with this continuous enhancement in project based companies factors leads to software projects failure infographics pdf Use them to share invaluable insights on lack of user participation, changing requirements, unclear objectives and impress your audience. This template can be altered and modified as per your expectations. So, grab it now.
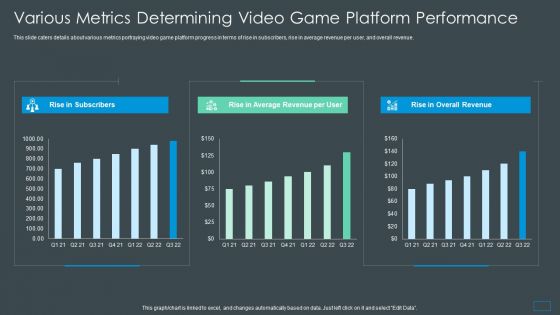
Multiplayer Gameplay System Venture Capitalist PPT Various Metrics Determining Video Game Platform Performance Infographics PDF
This slide caters details about various metrics portraying video game platform progress in terms of rise in subscribers, rise in average revenue per user, and overall revenue.Deliver an awe inspiring pitch with this creative multiplayer gameplay system venture capitalist ppt various metrics determining video game platform performance infographics pdf bundle. Topics like rise in subscribers, rise in average revenue, rise in overall revenue can be discussed with this completely editable template. It is available for immediate download depending on the needs and requirements of the user.
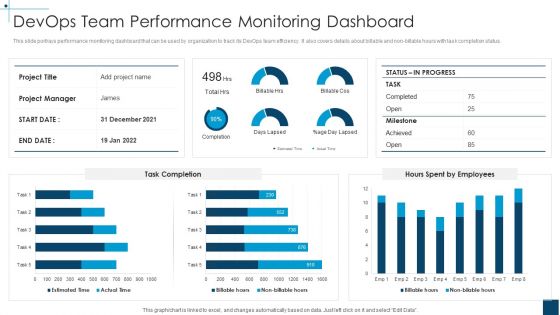
Devops Principles For Hybrid Cloud IT Devops Team Performance Monitoring Dashboard Infographics PDF
This slide portrays performance monitoring dashboard that can be used by organization to track its DevOps team efficiency. It also covers details about billable and non-billable hours with task completion status.Deliver and pitch your topic in the best possible manner with this devops principles for hybrid cloud it devops team performance monitoring dashboard infographics pdf Use them to share invaluable insights on devops team performance monitoring dashboard and impress your audience. This template can be altered and modified as per your expectations. So, grab it now.

Agile Software Development Lifecycle IT Reasons Why Organizations Are Adopting Agile Infographics PDF
This slide illustrates informational stats about the major reasons behind adopting agile methodologies. Here the graph indicates that most of the organization prefer agile methodology to accelerate software delivery.Deliver and pitch your topic in the best possible manner with this agile software development lifecycle it reasons why organizations are adopting agile infographics pdf Use them to share invaluable insights on improve software quality, reduce project risks, increase collaboration and impress your audience. This template can be altered and modified as per your expectations. So, grab it now.
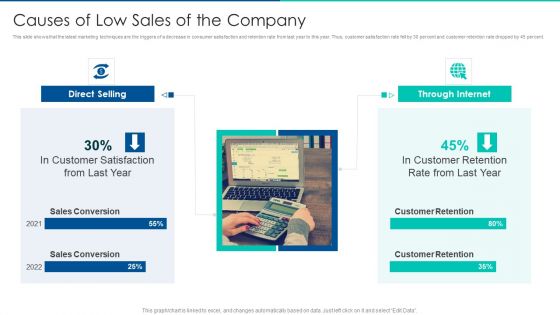
Sales Promotion Of Upgraded Product Through Upselling Causes Of Low Sales Of The Company Infographics PDF
This slide shows that the latest marketing techniques are the triggers of a decrease in consumer satisfaction and retention rate from last year to this year. Thus, customer satisfaction rate fell by 30 percent and customer retention rate dropped by 45 percent. Deliver an awe inspiring pitch with this creative sales promotion of upgraded product through upselling causes of low sales of the company infographics pdf bundle. Topics like direct selling, through internet can be discussed with this completely editable template. It is available for immediate download depending on the needs and requirements of the user.
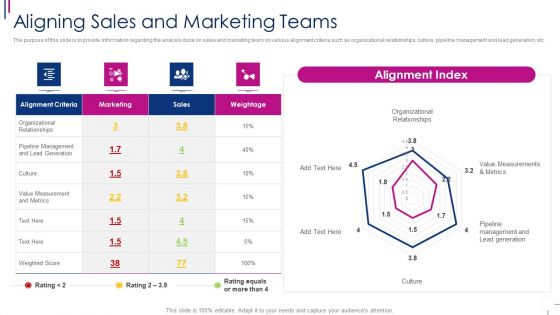
Successful Account Oriented Marketing Techniques Aligning Sales And Marketing Infographics PDF
The purpose of this slide is to provide information regarding the analysis done on sales and marketing team on various alignment criteria such as organizational relationships, culture, pipeline management and lead generation, etc. Deliver and pitch your topic in the best possible manner with this successful account oriented marketing techniques aligning sales and marketing infographics pdf. Use them to share invaluable insights on management, organizational, value measurement, metrics and impress your audience. This template can be altered and modified as per your expectations. So, grab it now.

 Home
Home