5 Step Cycle
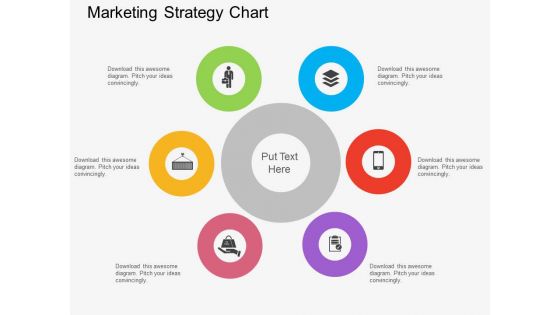
Six Staged Marketing Strategy Chart Powerpoint Template
This PowerPoint template contains circular infographic chart. This PPT slide is suitable to present marketing strategy. Visual effect helps in maintaining the flow of the discussion and provides more clarity to the subject.

Goal Planning Success Ppt PowerPoint Presentation Infographic Template Infographics Cpb
Presenting this set of slides with name goal planning success ppt powerpoint presentation infographic template infographics cpb. This is an editable Powerpoint six stages graphic that deals with topics like goal planning success to help convey your message better graphically. This product is a premium product available for immediate download and is 100 percent editable in Powerpoint. Download this now and use it in your presentations to impress your audience.

Circle Infographics Developing A Marketing Strategy Powerpoint Template
This business slide contains circular infographic design. This diagram may be used for developing a marketing strategy. Visual effect this slide helps in maintaining the flow of the discussion and provides more clarity to the subject.
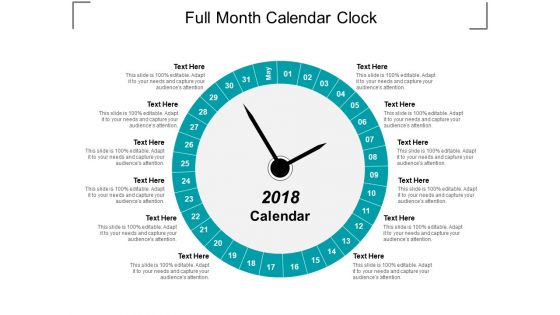
Full Month Calendar Clock Ppt Powerpoint Presentation Infographic Template Clipart
This is a full month calendar clock ppt powerpoint presentation infographic template clipart. This is a twelve stage process. The stages in this process are circular calendar, circle calendar, cyclic calendar.
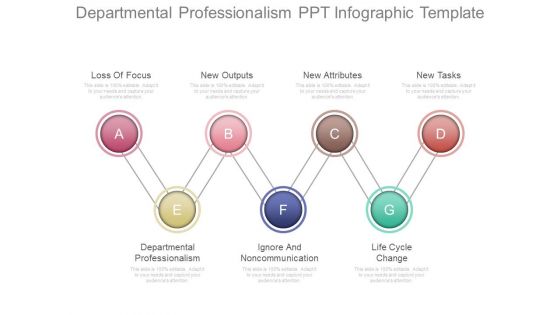
Departmental Professionalism Ppt Infographic Template
This is a departmental professionalism ppt infographic template. This is a seven stage process. The stages in this process are loss of focus, new outputs, new attributes, new tasks, departmental professionalism, ignore and noncommunication.
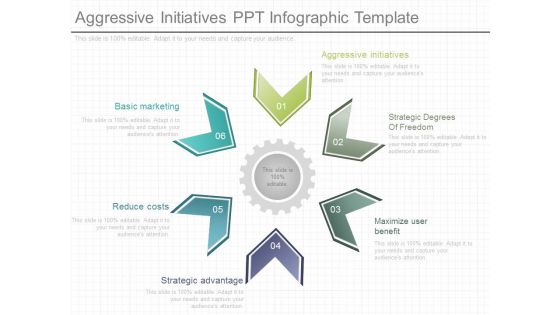
Aggressive Initiatives Ppt Infographic Template
This is a aggressive initiatives ppt infographic template. This is a six stage process. The stages in this process are aggressive initiatives, strategic degrees of freedom, maximize user benefit, strategic advantage, reduce costs, basic marketing.
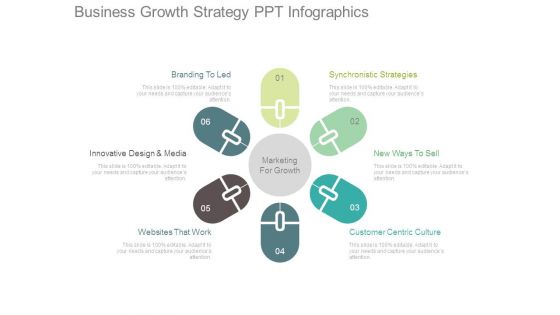
Business Growth Strategy Ppt Infographics
This is a business growth strategy ppt infographics. This is a six stage process. The stages in this process are branding to led, innovative design and media, websites that work, synchronistic strategies, new ways to sell, customer centric culture.
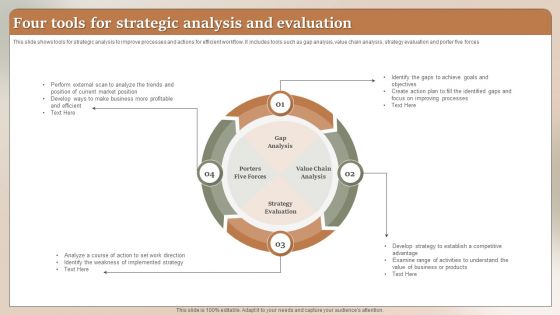
Four Tools For Strategic Analysis And Evaluation Ppt Gallery Infographics PDF
This slide shows tools for strategic analysis to improve processes and actions for efficient workflow. It includes tools such as gap analysis, value chain analysis, strategy evaluation and porter five forces. Presenting Four Tools For Strategic Analysis And Evaluation Ppt Gallery Infographics PDF to dispense important information. This template comprises four stages. It also presents valuable insights into the topics including Gap Analysis Porters, Five Forces, Strategy Evaluation. This is a completely customizable PowerPoint theme that can be put to use immediately. So, download it and address the topic impactfully.
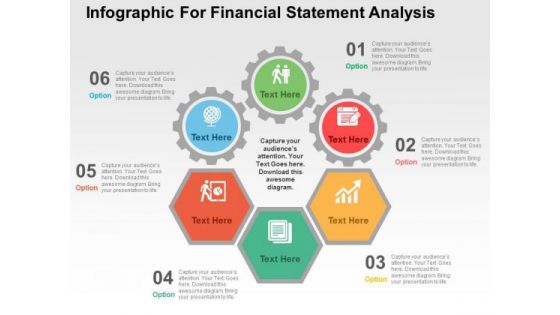
Infographic For Financial Statement Analysis PowerPoint Templates
This PowerPoint template contains infographic slide. This diagram has been designed with circular infographic to exhibit financial statement analysis. Use this diagram to set targets and to measure performance in your presentations.
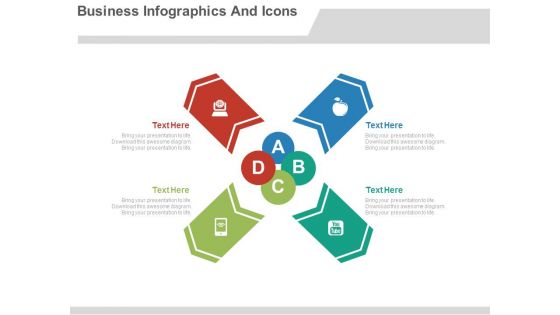
Business Infographics Theme Design Powerpoint Slides
This PPT slide has been designed with circular arrows infographic diagram. This business diagram is suitable for marketing research and analysis. This professional slide helps in making an instant impact on viewers.

Circle Business Process Infographic Diagram Powerpoint Templates
This business diagram has been designed with diagram of circular infographic. Download this slide to portray concept of management strategy for success. This diagram can be used for global business and communication related topics.
Seven Arrows In Circle With Team Icon And Text Holders Ppt Powerpoint Presentation Pictures Infographic Template
This is a seven arrows in circle with team icon and text holders ppt powerpoint presentation pictures infographic template. This is a seve n stage process. The stages in this process are 6 circular arrows, 6 cyclic arrows, six circular arrows.
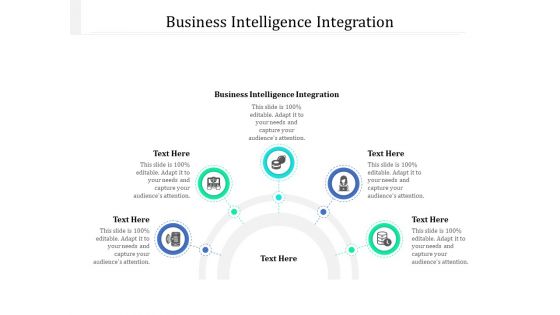
Business Intelligence Integration Ppt PowerPoint Presentation Infographic Template Background Image Cpb Pdf
Presenting this set of slides with name business intelligence integration ppt powerpoint presentation infographic template background image cpb pdf. This is an editable Powerpoint five stages graphic that deals with topics like business intelligence integration to help convey your message better graphically. This product is a premium product available for immediate download and is 100 percent editable in Powerpoint. Download this now and use it in your presentations to impress your audience.
Business Diagram Innovative Icons Infographic Presentation Template
Three circular innovative icons has been used to decorate this power point diagram template. This diagram is info graphic for data representation. Use this info graphics for business and management related presentations.

Customer Care Team Hexagon Infographic Powerpoint Template
This business slide contains circular design with team icons. This diagram is suitable to present working of customer care team. Visual effect of this diagram helps in maintaining the flow of the discussion and provides more clarity to the subject.
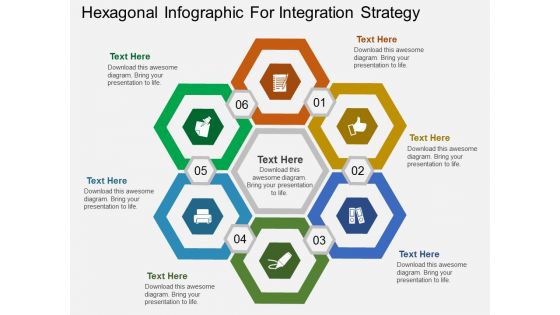
Hexagonal Infographic For Integration Strategy Powerpoint Template
Graphic of hexagons in circular flow has been used to design this business diagram. This PPT slide may be used to depict integration strategy. Download this professional slide to make impressive presentation.

Colorful Infographic For Text Representation Powerpoint Templates
Our above business diagram has been designed with colorful circular tags with icons. This slide is suitable for text representation in visual manner. Use this business diagram to present your work in a more smart and precise manner.

Dollar Key For Financial Success Planning Powerpoint Templates
This PowerPoint slide contains circular infographic with dollar key. This business diagram helps to exhibit key concepts for financial success. Download this business diagram to impress your viewers.
Seven Icons For Global Business Communication Powerpoint Templates
Our professionally designed business diagram is as an effective tool to display global business communication. It contains circular infographic. This diagram can be useful for business presentations.
Colorful Circles With Icons Powerpoint Templates
Circular infographic has been displayed in this business slide. This business diagram helps to exhibit process of strategic planning. Use this diagram to build an exclusive presentation.
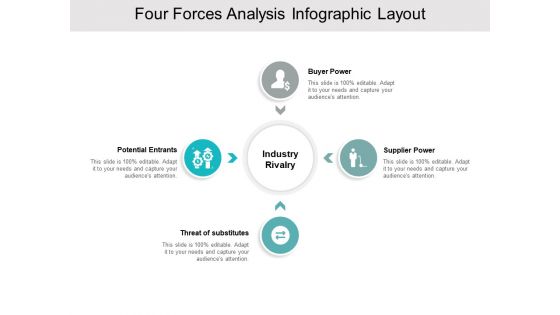
Four Forces Analysis Infographic Layout Ppt PowerPoint Presentation Gallery Vector
Presenting this set of slides with name four forces analysis infographic layout ppt powerpoint presentation gallery vector. This is a four stage process. The stages in this process are circular process, diverging radial, spokes diagram. This is a completely editable PowerPoint presentation and is available for immediate download. Download now and impress your audience.

Organizational Optimization Infographic Chart Powerpoint Slide Show
This is a organizational optimization infographic chart powerpoint slide show. This is a three stage process. The stages in this process are opportunities, roadmap, execution.
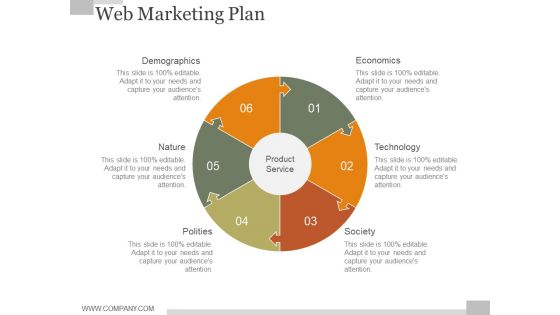
Web Marketing Plan Ppt PowerPoint Presentation Infographics
This is a web marketing plan ppt powerpoint presentation infographics. This is a six stage process. The stages in this process are demographics, nature, polities, economics, technology, society.

Radar Chart Ppt PowerPoint Presentation Infographics Templates
This is a radar chart ppt powerpoint presentation infographics templates. This is a two stage process. The stages in this process are business, marketing, charts, radar, scatter.
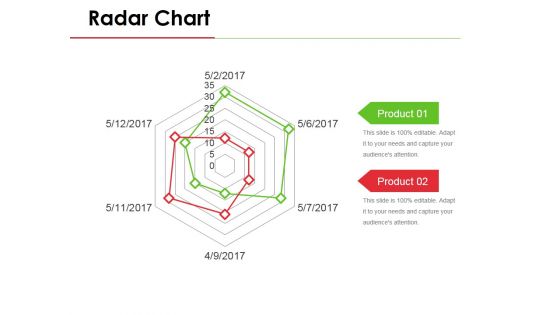
Radar Chart Ppt PowerPoint Presentation Styles Infographics
This is a radar chart ppt powerpoint presentation styles infographics. This is a six stage process. The stages in this process are business, marketing, product, radar chart, strategy.

Todays Goal Ppt PowerPoint Presentation Show Infographics
This is a todays goal ppt powerpoint presentation show infographics. This is a three stage process. The stages in this process are reliability, superior quality, commitment and dedication.

Product Features Ppt PowerPoint Presentation Infographics Microsoft
This is a product features ppt powerpoint presentation infographics microsoft. This is a six stage process. The stages in this process are icons, technology, business, marketing, strategy.
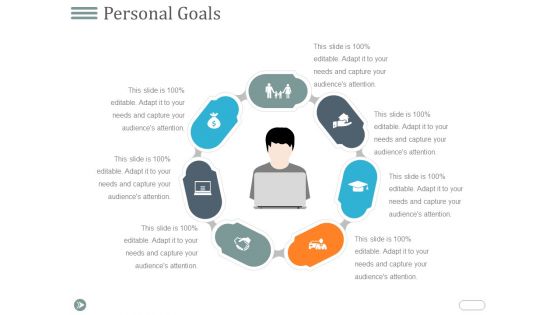
Personal Goals Ppt PowerPoint Presentation Infographics Example
This is a personal goals ppt powerpoint presentation infographics example. This is a seven stage process. The stages in this process are process, icons, business, management.
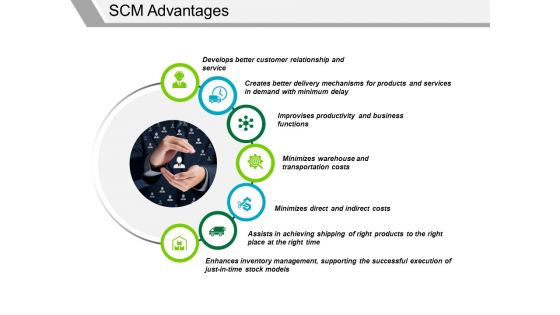
Scm Advantages Ppt PowerPoint Presentation Infographics Aids
This is a scm advantages ppt powerpoint presentation infographics aids. This is a seven stage process. The stages in this process are business, icons, strategy, marketing.

Puzzle Ppt PowerPoint Presentation Infographics Images
This is a puzzle ppt powerpoint presentation infographics images. This is a four stage process. The stages in this process are puzzle, business, marketing, strategy, planning.
Puzzle Ppt PowerPoint Presentation Infographic Template Display
This is a puzzle ppt powerpoint presentation infographic template display. This is a four stage process. The stages in this process are puzzles, marketing, strategy, process, analysis.
Our Goal Ppt PowerPoint Presentation Infographics Ideas
This is a our goal ppt powerpoint presentation infographics ideas. This is a six stage process. The stages in this process are our goal, icons, marketing, strategy, business.
Revenue Generating Ppt Powerpoint Presentation Layouts Infographics
This is a revenue generating ppt powerpoint presentation layouts infographics. This is a four stage process. The stages in this process are revenue generating.

Business Model Ppt PowerPoint Presentation Infographics Smartart
This is a business model ppt powerpoint presentation infographics smartart. This is a four stage process. The stages in this process are business, management, marketing, process.
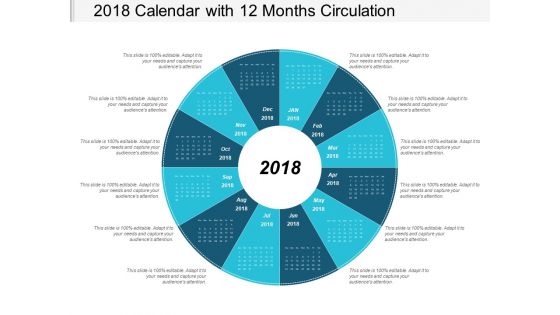
2018 Calendar With 12 Months Circulation Ppt Powerpoint Presentation Infographic Template Elements
This is a 2018 calendar with 12 months circulation ppt powerpoint presentation infographic template elements. This is a twelve stage process. The stages in this process are circular calendar, circle calendar, cyclic calendar.

Calendar Circle With Months And Dates Ppt Powerpoint Presentation Infographic Template Example Topics
This is a calendar circle with months and dates ppt powerpoint presentation infographic template example topics. This is a twelve stage process. The stages in this process are circular calendar, circle calendar, cyclic calendar.
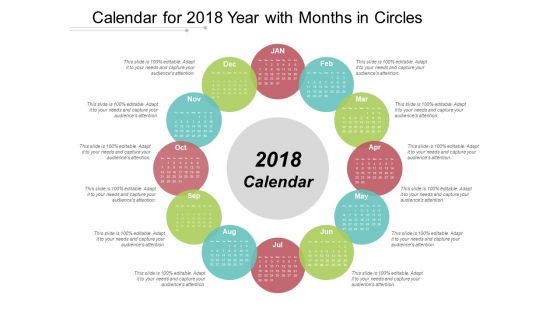
Calendar For 2018 Year With Months In Circles Ppt Powerpoint Presentation Infographic Template Graphics Example
This is a calendar for 2018 year with months in circles ppt powerpoint presentation infographic template graphics example. This is a twelve stage process. The stages in this process are circular calendar, circle calendar, cyclic calendar.
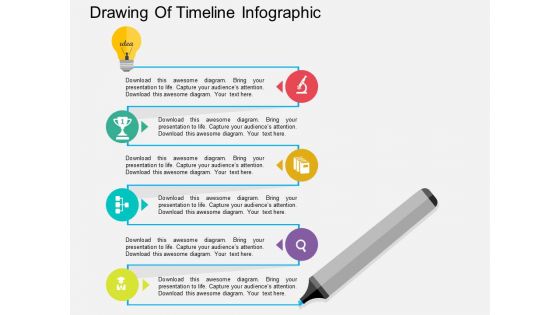
Drawing Of Timeline Infographic Powerpoint Template
This PowerPoint template has been designed with timeline infographic. Download this slide to portray concepts like success planning and strategy. Present your views using this innovative slide and be assured of leaving a lasting impression.

Four Options Zigzag Infographics Powerpoint Template
Emphatically define your message with our above template which contains four options zigzag infographic. This business diagram may be used to plot data series. Deliver amazing presentations to mesmerize your audience.
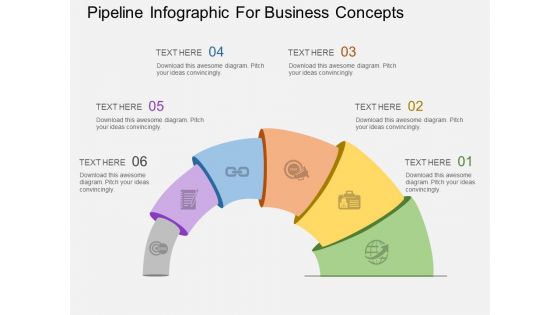
Pipeline Infographic For Business Concepts Powerpoint Templates
This business slide contains diagram of pipeline infographic. This diagram is suitable to present marketing process. Visual effect helps in maintaining the flow of the discussion and provides more clarity to the subject.
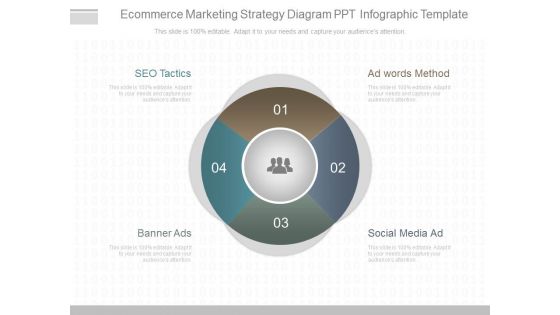
Ecommerce Marketing Strategy Diagram Ppt Infographic Template
This is a ecommerce marketing strategy diagram ppt infographic template. This is a four stage process. The stages in this process are ad words method, social media ad, banner ads, seo tactics.

Strategy And Planning Ppt Infographic Template
This is a strategy and planning ppt infographic template. This is a two stage process. The stages in this process are strategy and planning, marketing planning, demand generation, brand management.
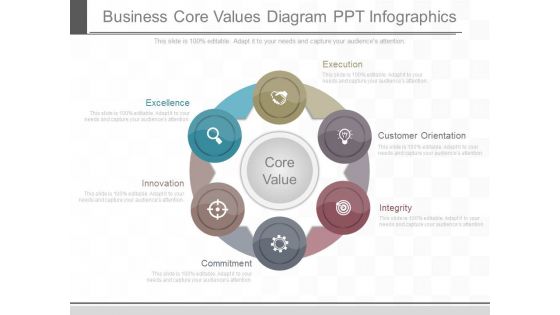
Business Core Values Diagram Ppt Infographics
This is a business core values diagram ppt infographics. This is a six stage process. The stages in this process are execution, customer orientation, integrity, commitment, innovation, excellence, core value.
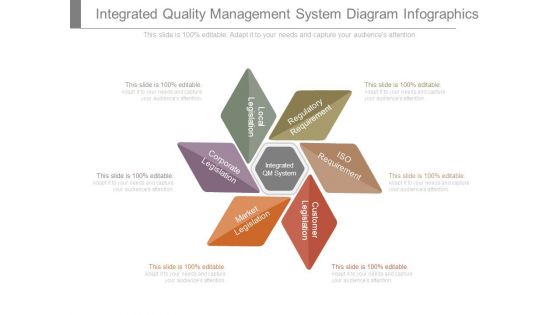
Integrated Quality Management System Diagram Infographics
This is a integrated quality management system diagram infographics. This is a six stage process. The stages in this process are integrated qm system, corporate legislation, local legislation, regulatory requirement, iso requirement, customer legislation, market legislation.
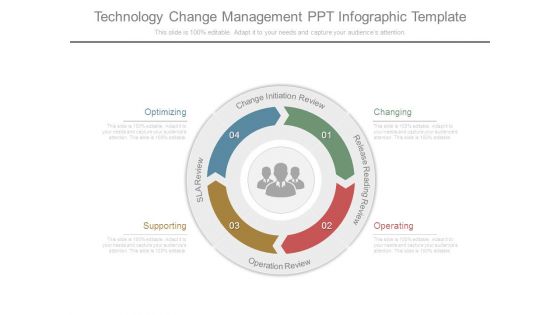
Technology Change Management Ppt Infographic Template
This is a technology change management ppt infographic template. This is a four stage process. The stages in this process are sla review, operation review, release reading review, change initiation review, optimizing, supporting, operating, changing.
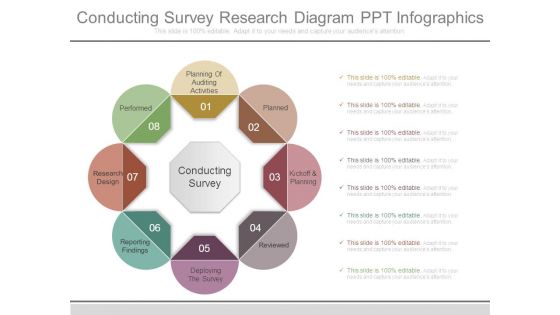
Conducting Survey Research Diagram Ppt Infographics
This is a conducting survey research diagram ppt infographics. This is a eight stage process. The stages in this process are planned, kickoff and planning, reviewed, deploying the survey, reporting findings, research design, performed, planning of auditing activities, conducting survey.
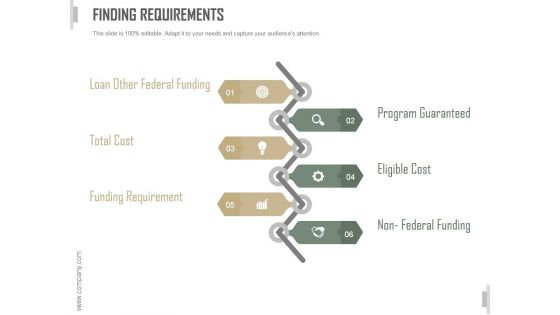
Finding Requirements Ppt PowerPoint Presentation Infographic Template
This is a finding requirements ppt powerpoint presentation infographic template. This is a six stage process. The stages in this process are loan other federal funding, total cost, funding requirement, program guaranteed , eligible cost, non federal funding.
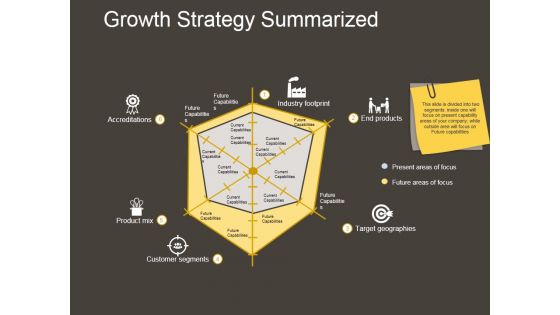
Growth Strategy Summarized Ppt PowerPoint Presentation Infographics
This is a growth strategy summarized ppt powerpoint presentation infographics. This is a six stage process. The stages in this process are accreditations, product mix, customer segments, target geographies, end products, industry footprint.
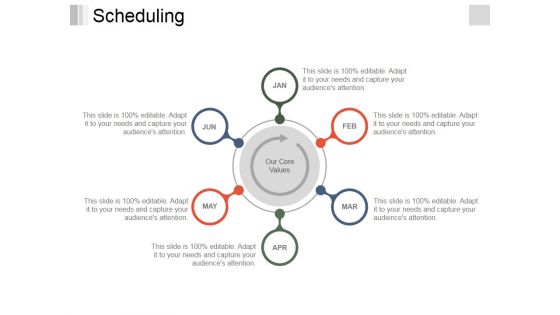
Scheduling Ppt PowerPoint Presentation Infographics Slides
This is a scheduling ppt powerpoint presentation infographics slides. This is a six stage process. The stages in this process are jan, feb, mar, apr, may, jun, our core values.

Service Development Ppt PowerPoint Presentation Infographics Visuals
This is a service development ppt powerpoint presentation infographics visuals. This is a three stage process. The stages in this process are brainstorm concepts, prioritize insight, hypothesis, experiment, clear need.

Financial Measures Ppt PowerPoint Presentation Model Infographics
This is a financial measures ppt powerpoint presentation model infographics. This is a seven stage process. The stages in this process are cost of raw material, revenue from goods sold, inventory holding cost, transportation cost, cost of expired perishable goods.

Tqm Principles Ppt PowerPoint Presentation Model Infographics
This is a tqm principles ppt powerpoint presentation model infographics. This is a eight stage process. The stages in this process are supplier relationship, decision making, continual improvement, strategic approach, process approach.
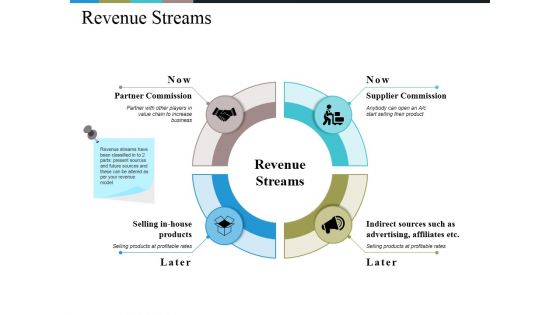
Revenue Streams Ppt PowerPoint Presentation Infographics Layout
This is a revenue streams ppt powerpoint presentation infographics layout. This is a four stage process. The stages in this process are partner commission, supplier commission, selling in house products, indirect sources such as advertising, affiliates etc.
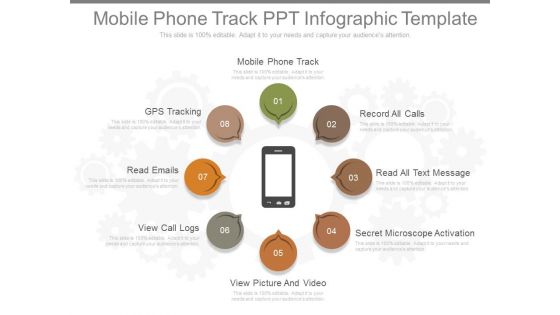
Mobile Phone Track Ppt Infographic Template
This is a mobile phone track ppt infographic template. This is a eight stage process. The stages in this process are mobile phone track, record all calls, read all text message, secret microscope activation, view picture and video, view call logs, read emails, gps tracking.
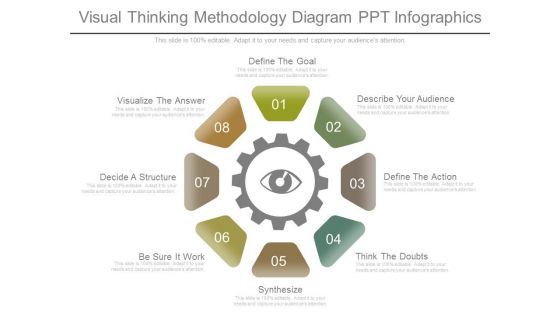
Visual Thinking Methodology Diagram Ppt Infographics
This is a visual thinking methodology diagram ppt infographics. This is a eight stage process. The stages in this process are define the goal, describe your audience, define the action, think the doubts, synthesize, be sure it work, decide a structure, visualize the answer.
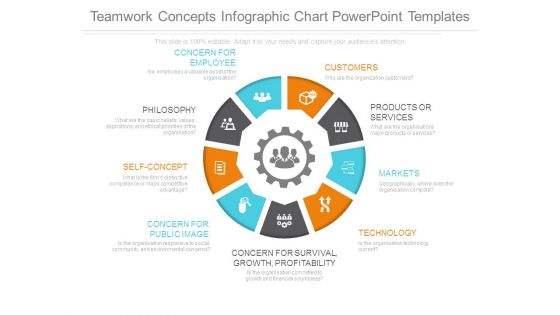
Teamwork Concepts Infographic Chart Powerpoint Templates
This is a teamwork concepts infographic chart powerpoint templates. This is a nine stage process. The stages in this process are concern for survival growth profitability, concern for employee, customers, products or services, markets, technology, concern for public image, self concept, philosophy.

Principles Of Change Ppt PowerPoint Presentation Infographics
This is a principles of change ppt powerpoint presentation infographics. This is a seven stage process. The stages in this process are resistance and comfort, authority for change, value systems, incremental vs radical change, the right answer is not enough, change is a process, senders and receivers.
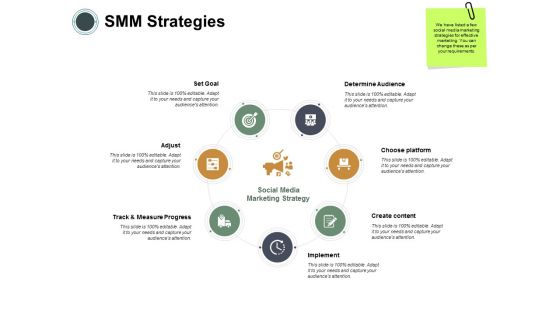
SMM Strategies Ppt PowerPoint Presentation Infographics Template
Presenting this set of slides with name smm strategies ppt powerpoint presentation infographics template. This is a seven stage process. The stages in this process are content, implement, goal, social media, marketing strategy. This is a completely editable PowerPoint presentation and is available for immediate download. Download now and impress your audience.
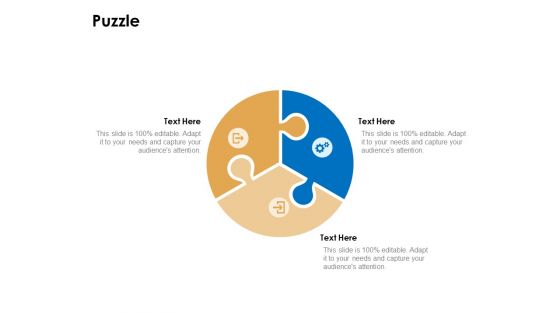
Puzzle Ppt PowerPoint Presentation Infographic Template Brochure
Presenting this set of slides with name puzzle ppt powerpoint presentation infographic template brochure. This is a three stage process. The stage in this process is puzzle. This is a completely editable PowerPoint presentation and is available for immediate download. Download now and impress your audience.
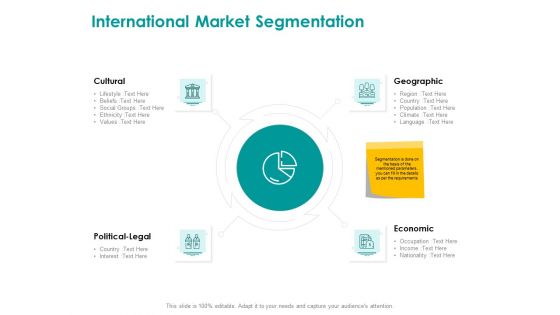
EMM Solution International Market Segmentation Infographics PDF
This is a emm solution international market segmentation infographics pdf template with various stages. Focus and dispense information on four stages using this creative set, that comes with editable features. It contains large content boxes to add your information on topics like international market segmentation, cultural, geographic, economic, political legal. You can also showcase facts, figures, and other relevant content using this PPT layout. Grab it now.

 Home
Home