4 Block
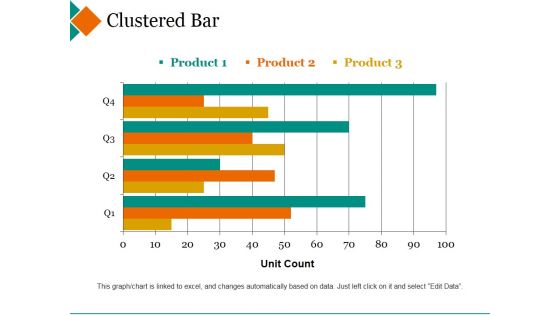
Clustered Bar Ppt PowerPoint Presentation Inspiration Templates
This is a clustered bar ppt powerpoint presentation inspiration templates. This is a four stage process. The stages in this process are product, unit count, clustered bar, step.

Stacked Bar Ppt PowerPoint Presentation Professional Portfolio
This is a stacked bar ppt powerpoint presentation professional portfolio. This is a four stage process. The stages in this process are product, unit count, step, stacked bar.
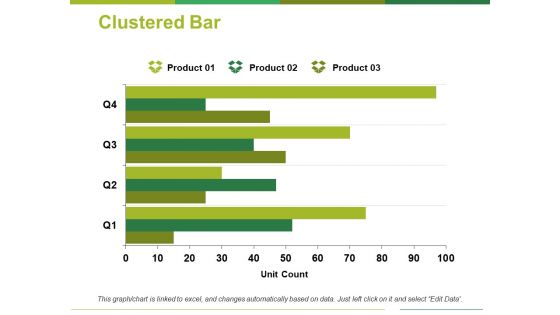
Clustered Bar Ppt PowerPoint Presentation Summary Smartart
This is a clustered bar ppt powerpoint presentation summary smartart. This is a four stage process. The stages in this process are product, unit count, clustered bar.
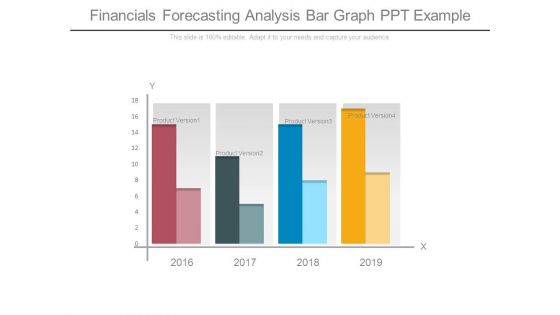
Financials Forecasting Analysis Bar Graph Ppt Example
This is a financials forecasting analysis bar graph ppt example. This is a four stage process. The stages in this process are product version.
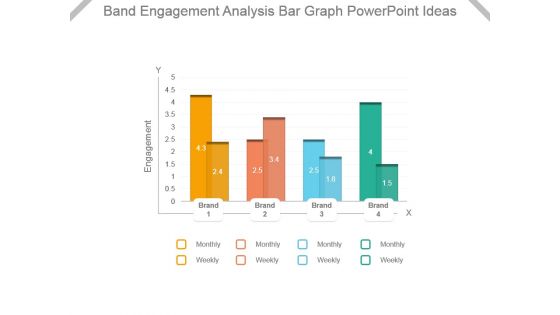
Band Engagement Analysis Bar Graph Powerpoint Ideas
This is a band engagement analysis bar graph powerpoint ideas. This is a four stage process. The stages in this process are engagement, brand, monthly, weekly.
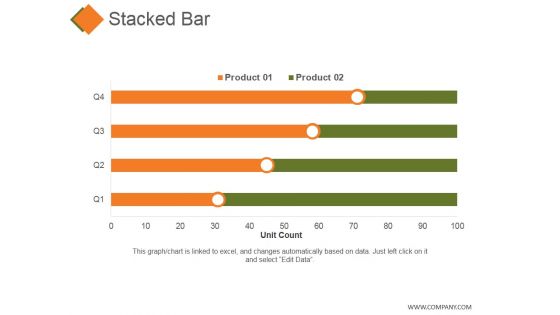
Stacked Bar Ppt PowerPoint Presentation Gallery Skills
This is a stacked bar ppt powerpoint presentation gallery skills. This is a four stage process. The stages in this process are unit count, product, business, marketing.
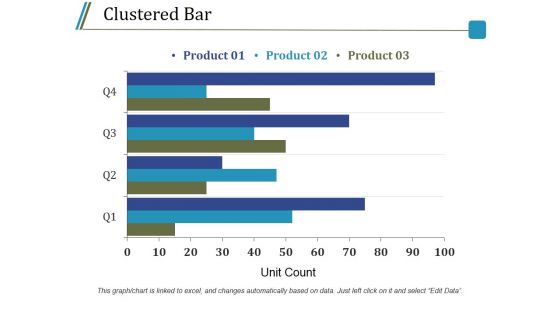
Clustered Bar Ppt PowerPoint Presentation Styles Show
This is a clustered bar ppt powerpoint presentation styles show. This is a four stage process. The stages in this process are product, unit count, step, business, marketing.

Clustered Bar Ppt PowerPoint Presentation Pictures Visuals
This is a clustered bar ppt powerpoint presentation pictures visuals. This is a four stage process. The stages in this process are product, unit count, step, business, management.

Clustered Bar Ppt PowerPoint Presentation Summary Inspiration
This is a clustered bar ppt powerpoint presentation summary inspiration. This is a four stage process. The stages in this process are product, unit count, step, business, management.

Stacked Bar Ppt Powerpoint Presentation Ideas Templates
This is a stacked bar ppt powerpoint presentation ideas templates. This is a four stage process. The stages in this process are finance, marketing, management, investment, analysis.

Eight Steps Jigsaw Puzzle Pieces Ppt PowerPoint Presentation Styles Diagrams
This is a eight steps jigsaw puzzle pieces ppt powerpoint presentation styles diagrams. This is a four stage process. The stages in this process are 5 pieces jigsaw puzzle, 5 parts jigsaw puzzle, 5 segments jigsaw puzzle.
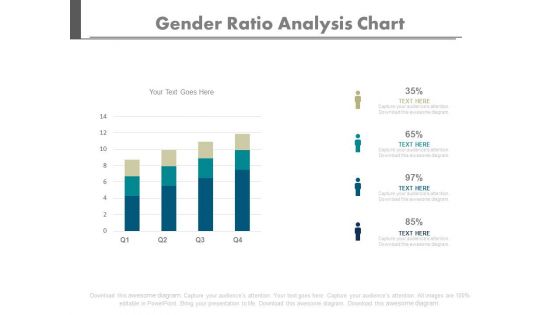
Four Bars Gender Population Ratio Chart Powerpoint Slides
Create dynamic presentations with our creative template of bar graph. This diagram may be used to present gender population. Download this template to leave permanent impression on your audience.
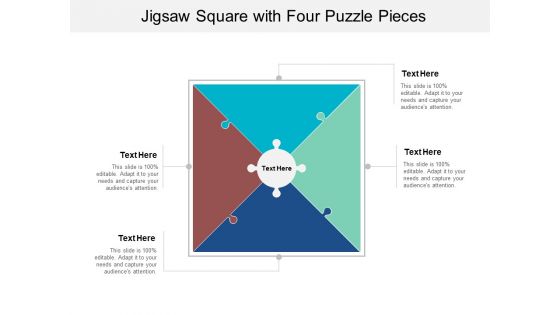
Jigsaw Square With Four Puzzle Pieces Ppt PowerPoint Presentation Layouts Themes
This is a jigsaw square with four puzzle pieces ppt powerpoint presentation layouts themes. This is a four stage process. The stages in this process are 5 pieces jigsaw puzzle, 5 parts jigsaw puzzle, 5 segments jigsaw puzzle.

Four Puzzle Pieces In Hexagon Shape With Text Holders Ppt Powerpoint Presentation Professional Visual Aids
This is a four puzzle pieces in hexagon shape with text holders ppt powerpoint presentation professional visual aids. This is a four stage process. The stages in this process are 7 piece puzzle, 7 part puzzle, 7 segment puzzle.

Four Puzzle Pieces In Linear Flow Ppt Powerpoint Presentation Summary Background
This is a four puzzle pieces in linear flow ppt powerpoint presentation summary background. This is a four stage process. The stages in this process are 7 piece puzzle, 7 part puzzle, 7 segment puzzle.
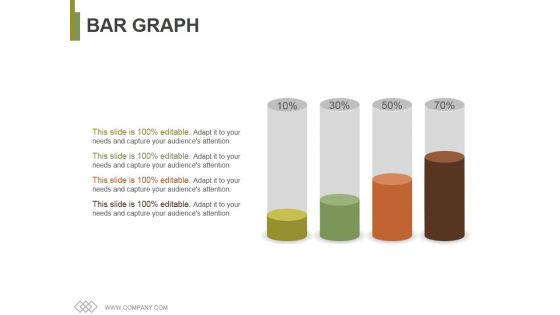
Bar Graph Ppt PowerPoint Presentation Pictures Slide Portrait
This is a bar graph ppt powerpoint presentation pictures slide portrait. This is a four stage process. The stages in this process are bar graph, growth, success, business, marketing.
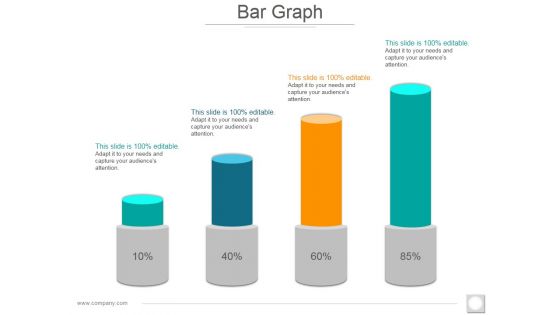
Bar Graph Ppt PowerPoint Presentation Inspiration Format Ideas
This is a bar graph ppt powerpoint presentation inspiration format ideas. This is a four stage process. The stages in this process are bar graph, growth, success, business, marketing.
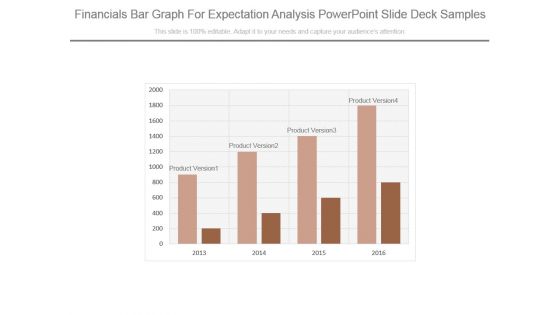
Financials Bar Graph For Expectation Analysis Powerpoint Slide Deck Samples
This is a financials bar graph for expectation analysis powerpoint slide deck samples. This is a four stage process. The stages in this process are product version.

Stacked Bar Ppt PowerPoint Presentation Styles Designs Download
This is a stacked bar ppt powerpoint presentation styles designs download. This is a four stage process. The stages in this process are product, finance, percentage, business.
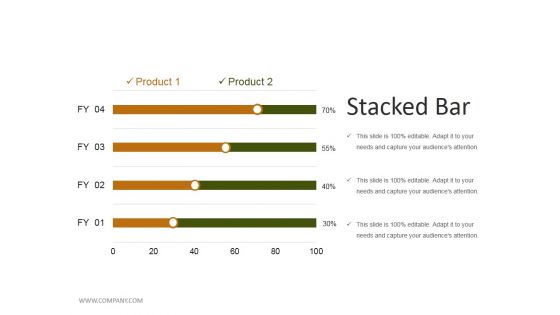
Stacked Bar Ppt PowerPoint Presentation Gallery File Formats
This is a stacked bar ppt powerpoint presentation gallery file formats. This is a four stage process. The stages in this process are finance, product, percentage, business, marketing.

Bar Graph Ppt PowerPoint Presentation File Graphics Template
This is a bar graph ppt powerpoint presentation file graphics template. This is a four stage process. The stages in this process are product, business, graph, growth, success.

Stacked Bar Finance Ppt Powerpoint Presentation Infographics Example
This is a stacked bar finance ppt powerpoint presentation infographics example. This is a four stage process. The stages in this process are finance, marketing, management, investment, analysis.
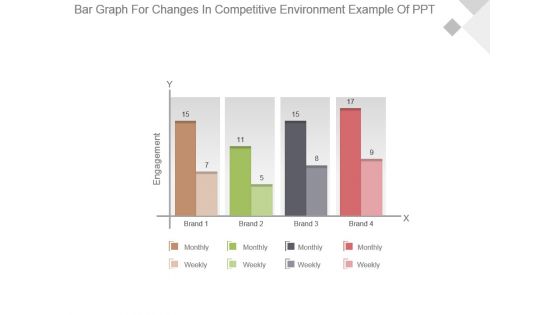
Bar Graph For Changes In Competitive Environment Example Of Ppt
This is a bar graph for changes in competitive environment example of ppt. This is a four stage process. The stages in this process are engagement, brand, monthly, weekly.
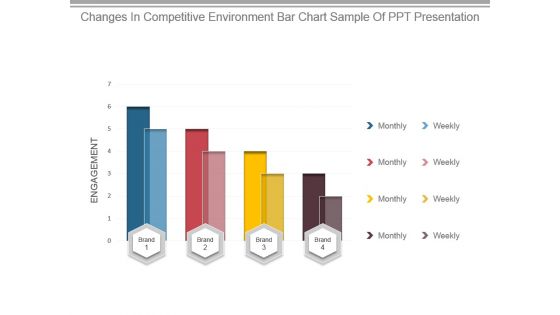
Changes In Competitive Environment Bar Chart Sample Of Ppt Presentation
This is a changes in competitive environment bar chart sample of ppt presentation. This is a four stage process. The stages in this process are engagement, brand, monthly, weekly.
Stacked Bar Template 2 Ppt PowerPoint Presentation Icon Pictures
This is a stacked bar template 2 ppt powerpoint presentation icon pictures. This is a four stage process. The stages in this process are product, percentage, finance, business, marketing.

Clustered Bar Ppt PowerPoint Presentation Portfolio Graphics Template
This is a clustered bar ppt powerpoint presentation portfolio graphics template. This is a four stage process. The stages in this process are business, product, unit count, step, marketing.
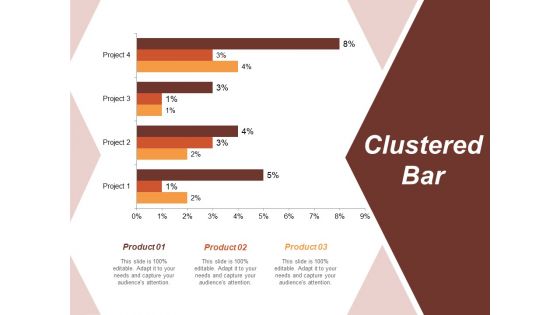
Clustered Bar Risk Estimator Ppt PowerPoint Presentation Layouts Mockup
This is a clustered bar risk estimator ppt powerpoint presentation layouts mockup. This is a four stage process. The stages in this process are business, management, strategy, analysis, marketing.
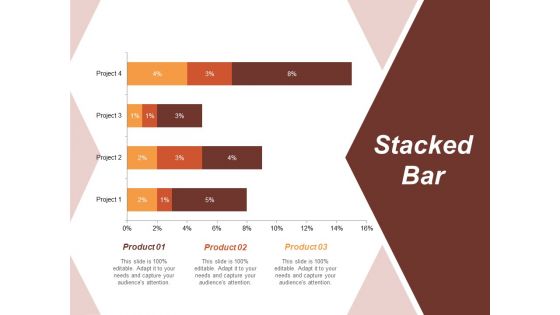
Stacked Bar Risk Estimator Ppt PowerPoint Presentation Gallery Design Templates
This is a stacked bar risk estimator ppt powerpoint presentation gallery design templates. This is a four stage process. The stages in this process are business, management, strategy, analysis, marketing.

Project Status Bar Chart Ppt PowerPoint Presentation Ideas Objects
This is a project status bar chart ppt powerpoint presentation ideas objects. This is a four stage process. The stages in this process are project management, project progress, project growth.

Product Comparison Data Bar Graph Ppt Powerpoint Presentation Slides Show
This is a product comparison data bar graph ppt powerpoint presentation slides show. This is a four stage process. The stages in this process are data presentation, content presentation, information presentation.

Effective Methods Of Phishing Attacks Awareness Training Slides PDF
This slide covers key ways to conduct effective phishing training for employees for overall development. It involves interactive video learning, PowerPoint presentations, quizzes and chunk lessons. Persuade your audience using this Effective Methods Of Phishing Attacks Awareness Training Slides PDF. This PPT design covers four stages, thus making it a great tool to use. It also caters to a variety of topics including Interactive Video Learning, Powerpoint Presentations, Quizzes. Download this PPT design now to present a convincing pitch that not only emphasizes the topic but also showcases your presentation skills.

Bar Graph For Marketing Research Process Powerpoint Slides
This PowerPoint template has been designed with diagram of bar graph. This PPT slide can be used to prepare presentations for profit growth report and also for financial data analysis. You can download finance PowerPoint template to prepare awesome presentations.

Bar Graph For Profit Growth Analysis Powerpoint Slides
This PowerPoint template has been designed with bar graph with percentage values. This diagram is useful to exhibit profit growth analysis. This diagram slide can be used to make impressive presentations.

Bar Graph For Yearly Statistical Analysis Powerpoint Slides
This PowerPoint template has been designed with bar graph. This PowerPoint diagram is useful to exhibit yearly statistical analysis. This diagram slide can be used to make impressive presentations.

Bar Graph For Data Distribution And Analysis Powerpoint Slides
This PowerPoint template has been designed with bar graph. This PowerPoint diagram is useful for data distribution and analysis This diagram slide can be used to make impressive presentations.

Jigsaw Hexagon With Six Puzzle Piece Ppt PowerPoint Presentation Portfolio Deck
This is a jigsaw hexagon with six puzzle piece ppt powerpoint presentation portfolio deck. This is a four stage process. The stages in this process are 5 pieces jigsaw puzzle, 5 parts jigsaw puzzle, 5 segments jigsaw puzzle.
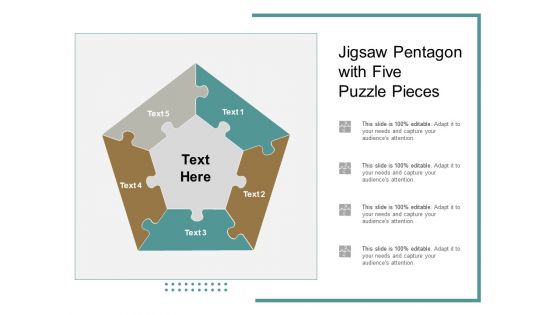
Jigsaw Pentagon With Five Puzzle Pieces Ppt PowerPoint Presentation File Model
This is a jigsaw pentagon with five puzzle pieces ppt powerpoint presentation file model. This is a four stage process. The stages in this process are 5 pieces jigsaw puzzle, 5 parts jigsaw puzzle, 5 segments jigsaw puzzle.

Business Man With Graph Made Of Puzzle Pieces Ppt PowerPoint Presentation Professional Clipart
This is a business man with graph made of puzzle pieces ppt powerpoint presentation professional clipart. This is a four stage process. The stages in this process are puzzle, business, growth, success, pieces.

Men Pushing Puzzle Pieces Showing Team Efforts Ppt PowerPoint Presentation Inspiration Example Topics
This is a men pushing puzzle pieces showing team efforts ppt powerpoint presentation inspiration example topics. This is a four stage process. The stages in this process are puzzle, business, growth, success, pieces.

Bread Crumb Series Of Connected Pieces Ppt Powerpoint Presentation Infographic Template Examples
This is a bread crumb series of connected pieces ppt powerpoint presentation infographic template examples. This is a four stage process. The stages in this process are path, navigation, bread crumb.
Four Percentage Bars With Business Icons Ppt PowerPoint Presentation Ideas Rules
Presenting this set of slides with name four percentage bars with business icons ppt powerpoint presentation ideas rules. This is a four stage process. The stages in this process are four percentage bars with business icons. This is a completely editable PowerPoint presentation and is available for immediate download. Download now and impress your audience.

Return Of Investment Bar Chart For Business Powerpoint Slide Designs Download
This is a return of investment bar chart for business powerpoint slide designs download. This is a four stage process. The stages in this process are product.
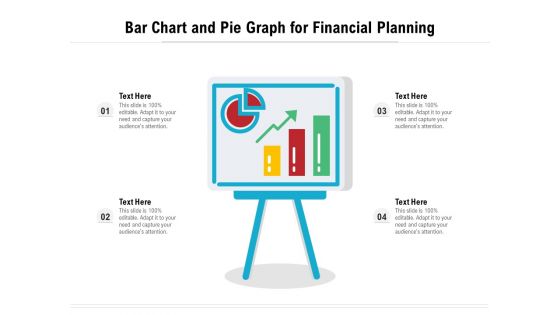
Bar Chart And Pie Graph For Financial Planning Ppt PowerPoint Presentation Infographics Graphics Example PDF
Presenting bar chart and pie graph for financial planning ppt powerpoint presentation infographics graphics example pdf. to dispense important information. This template comprises four stages. It also presents valuable insights into the topics including bar chart and pie graph for financial planning. This is a completely customizable PowerPoint theme that can be put to use immediately. So, download it and address the topic impactfully.

Magnifier With Tools And Bar Graph Ppt PowerPoint Presentation Portfolio Templates
This is a magnifier with tools and bar graph ppt powerpoint presentation portfolio templates. This is a four stage process. The stages in this process are magnifier, search, marketing, strategy, business.

3D Bar Chart For Data Representation Ppt PowerPoint Presentation Model Graphic Tips
This is a 3d bar chart for data representation ppt powerpoint presentation model graphic tips. This is a four stage process. The stages in this process are art, colouring, paint brush.
3D Bar Chart To Display Data Ppt PowerPoint Presentation Icon Design Inspiration
This is a 3d bar chart to display data ppt powerpoint presentation icon design inspiration. This is a four stage process. The stages in this process are art, colouring, paint brush.

Stock Market Trend Dollar Sign On Bar Graph Ppt Powerpoint Presentation Show Deck
This is a stock market trend dollar sign on bar graph ppt powerpoint presentation show deck. This is a four stage process. The stages in this process are stock market, financial market, bull market.

Bar Graph To Present Financial Information Ppt PowerPoint Presentation Show Tips
This is a bar graph to present financial information ppt powerpoint presentation show tips. This is a four stage process. The stages in this process are stock market, financial markets, bull market.

Bar Graph With Downward Arrow For Business Failure Ppt PowerPoint Presentation Inspiration Graphics
This is a bar graph with downward arrow for business failure ppt powerpoint presentation inspiration graphics. This is a four stage process. The stages in this process are business failure, unsuccessful business, business non success.
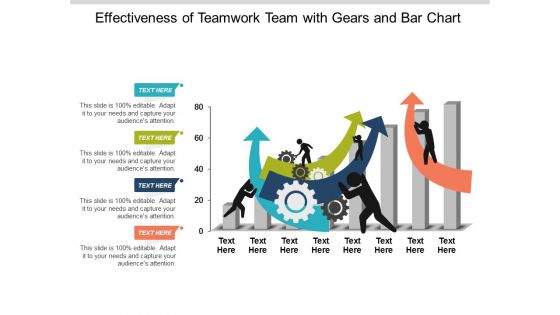
Effectiveness Of Teamwork Team With Gears And Bar Chart Ppt Powerpoint Presentation Ideas Information
This is a effectiveness of teamwork team with gears and bar chart ppt powerpoint presentation ideas information. This is a four stage process. The stages in this process are team performance, member performance, group performance.
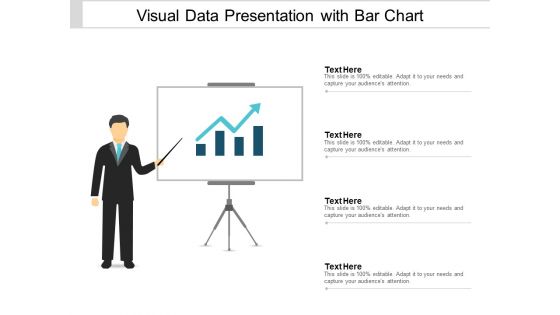
Visual Data Presentation With Bar Chart Ppt PowerPoint Presentation Portfolio Brochure
This is a visual data presentation with bar chart ppt powerpoint presentation portfolio brochure. This is a four stage process. The stages in this process are visual aids, communication, business.

Economic Growth Arrow With Bar Graph On Human Hand Ppt PowerPoint Presentation Infographics Ideas
This is a economic growth arrow with bar graph on human hand ppt powerpoint presentation infographics ideas. This is a four stage process. The stages in this process are rising arrow, growing arrow, increasing arrow.

Financial Success Arrow On Bar Chart Ppt PowerPoint Presentation Ideas Display
This is a financial success arrow on bar chart ppt powerpoint presentation ideas display. This is a four stage process. The stages in this process are rising arrow, growing arrow, increasing arrow.
Stock Market Analysis Magnifying Glass Over Bar Graph And Dollar Sign Ppt PowerPoint Presentation Icon Visual Aids
This is a stock market analysis magnifying glass over bar graph and dollar sign ppt powerpoint presentation icon visual aids. This is a four stage process. The stages in this process are stock market, financial markets, bull market.

Four Parts Circular Chart Ppt PowerPoint Presentation Styles Skills
This is a four parts circular chart ppt powerpoint presentation styles skills. This is a four stage process. The stages in this process are sectioned circle, segmented circle, partitioned circle.

Pie Chart For Data Comparison Ppt PowerPoint Presentation Portfolio Layouts
This is a pie chart for data comparison ppt powerpoint presentation portfolio layouts. This is a four stage process. The stages in this process are sectioned circle, segmented circle, partitioned circle.
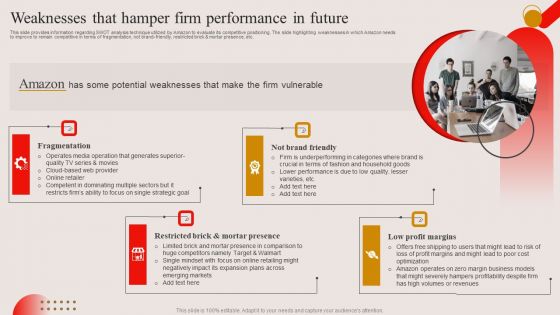
Weaknesses That Hamper Firm Performance In Future Ppt PowerPoint Presentation File Styles PDF
This slide provides information regarding SWOT analysis technique utilized by Amazon to evaluate its competitive positioning. The slide highlighting weaknesses in which Amazon needs to improve to remain competitive in terms of fragmentation, not brand-friendly, restricted brick and mortar presence, etc. From laying roadmaps to briefing everything in detail, our templates are perfect for you. You can set the stage with your presentation slides. All you have to do is download these easy to edit and customizable templates. Vision Statement Analysis Of Amazon Brand Ppt PowerPoint Presentation File Background Images PDF will help you deliver an outstanding performance that everyone would remember and praise you for. Do download this presentation today.
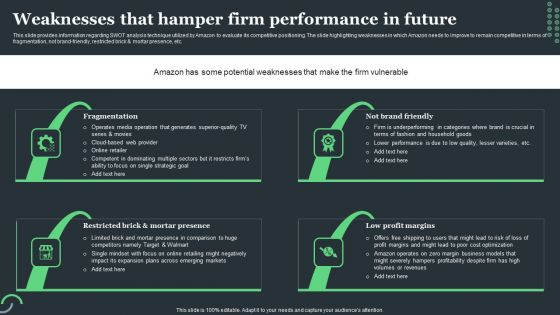
Amazon Tactical Plan Weaknesses That Hamper Firm Performance In Future Clipart PDF
This slide provides information regarding SWOT analysis technique utilized by Amazon to evaluate its competitive positioning. The slide highlighting weaknesses in which Amazon needs to improve to remain competitive in terms of fragmentation, not brand-friendly, restricted brick and mortar presence, etc. Welcome to our selection of the Amazon Tactical Plan Weaknesses That Hamper Firm Performance In Future Clipart PDF. These are designed to help you showcase your creativity and bring your sphere to life. Planning and Innovation are essential for any business that is just starting out. This collection contains the designs that you need for your everyday presentations. All of our PowerPoints are 100 percent editable, so you can customize them to suit your needs. This multi-purpose template can be used in various situations. Grab these presentation templates today.
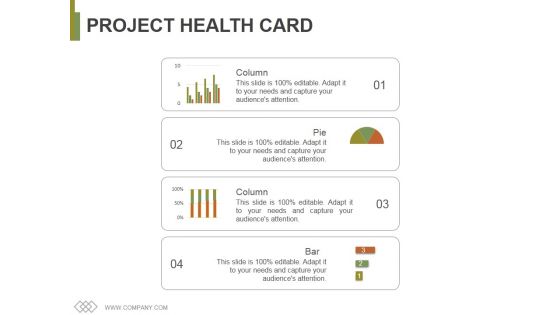
Project Health Card Template 1 Ppt PowerPoint Presentation Summary Visual Aids
This is a project health card template 1 ppt powerpoint presentation summary visual aids. This is a four stage process. The stages in this process are column, pie, bar, management, business.

Revenue Split By Product Segment Template 1 Ppt PowerPoint Presentation Infographics Smartart
This is a revenue split by product segment template 1 ppt powerpoint presentation infographics smartart. This is a four stage process. The stages in this process are business, finance, marketing, bar graph, product.

 Home
Home