1 Year Plan

Line Chart Ppt PowerPoint Presentation Slides Mockup
This is a line chart ppt powerpoint presentation slides mockup. This is a two stage process. The stages in this process are in percentage, in years, product, growth, success.
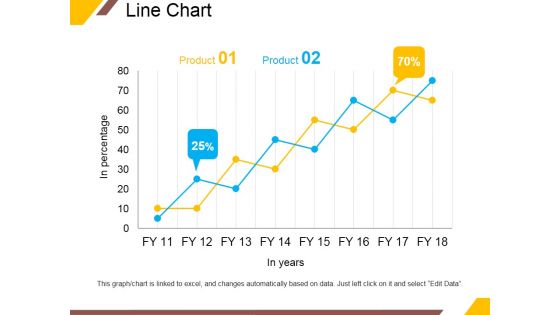
Line Chart Ppt PowerPoint Presentation Portfolio Infographic Template
This is a line chart ppt powerpoint presentation portfolio infographic template. This is a two stage process. The stages in this process are product, in years, business, percentage, growth.
Scatter Bubble Chart Ppt PowerPoint Presentation Icon Elements
This is a scatter bubble chart ppt powerpoint presentation icon elements. This is a six stage process. The stages in this process are highest profit, profit, financial year, product.
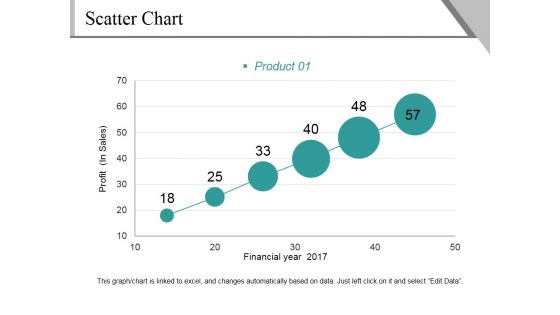
Scatter Chart Ppt PowerPoint Presentation File Background Image
This is a scatter chart ppt powerpoint presentation file background image. This is a six stage process. The stages in this process are profit, financial year, product, growth, success.
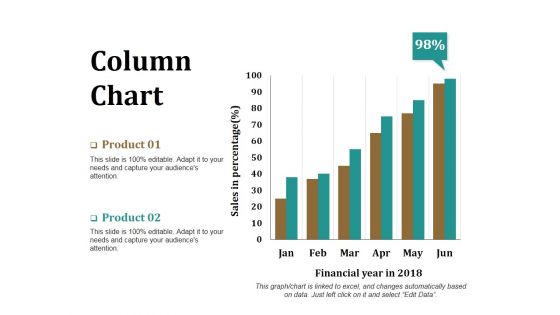
Column Chart Ppt PowerPoint Presentation Model Graphics Download
This is a column chart ppt powerpoint presentation model graphics download. This is a two stage process. The stages in this process are product, financial year, sales in percentage, bar graph, success.

Column Chart Ppt PowerPoint Presentation Gallery Slide Portrait
This is a column chart ppt powerpoint presentation gallery slide portrait. This is a two stage process. The stages in this process are sales in percentage, financial year, product, bar graph, growth.

Bar Chart Ppt PowerPoint Presentation Infographics Format Ideas
This is a bar chart ppt powerpoint presentation infographics format ideas. This is a two stage process. The stages in this process are bar graph, product, financial year, sales in percentage.

Line Chart Ppt PowerPoint Presentation Outline Diagrams
This is a line chart ppt powerpoint presentation outline diagrams. This is a two stage process. The stages in this process are in percentage, in years, percentage, business, marketing.
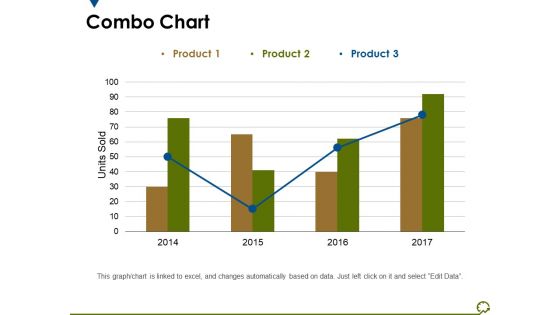
Combo Chart Ppt PowerPoint Presentation Outline Graphics Tutorials
This is a combo chart ppt powerpoint presentation outline graphics tutorials. This is a three stage process. The stages in this process are units sold, years, business, marketing, graph.

Combo Chart Ppt PowerPoint Presentation Slides Outline
This is a combo chart ppt powerpoint presentation slides outline. This is a three stage process. The stages in this process are combo chart, growth, product, financial year, business.
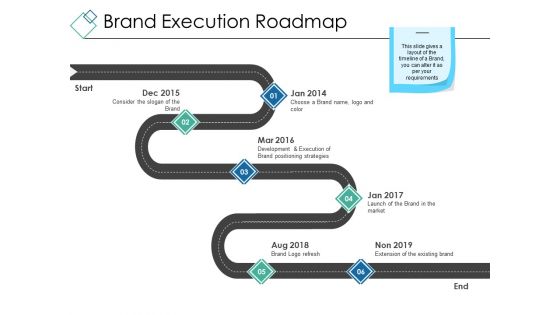
Brand Execution Roadmap Ppt PowerPoint Presentation Styles Design Inspiration
This is a brand execution roadmap ppt powerpoint presentation styles design inspiration. This is a six stage process. The stages in this process are start, end, roadmap, years, business.
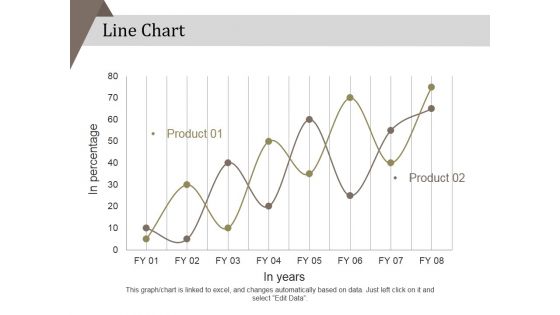
Line Chart Ppt PowerPoint Presentation Layouts Professional
This is a line chart ppt powerpoint presentation layouts professional. This is a two stage process. The stages in this process are in percentage, product, in years, strategy, marketing, business.
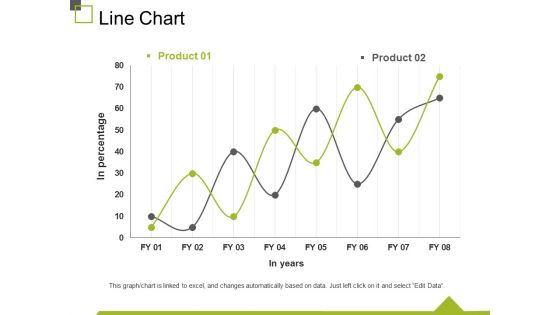
Line Chart Ppt PowerPoint Presentation Infographics Display
This is a line chart ppt powerpoint presentation infographics display. This is a two stage process. The stages in this process are in percentage, in years, chart, business, marketing.
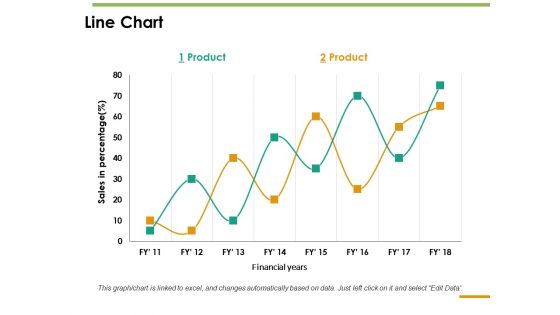
Line Chart Ppt PowerPoint Presentation Inspiration Guide
This is a line chart ppt powerpoint presentation inspiration guide. This is a two stage process. The stages in this process are line chart, sales in percentage, product, financial years.

Line Chart Ppt PowerPoint Presentation Gallery Objects
This is a line chart ppt powerpoint presentation gallery objects. This is a two stage process. The stages in this process are product, business, marketing, growth, in years, in percentage.
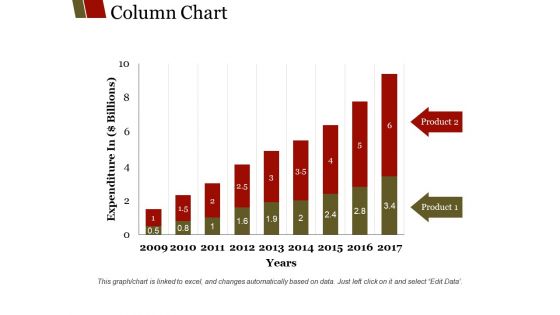
Column Chart Ppt PowerPoint Presentation Summary Graphics
This is a column chart ppt powerpoint presentation summary graphics. This is a nine stage process. The stages in this process are product, years, expenditure in billions, graph, business.
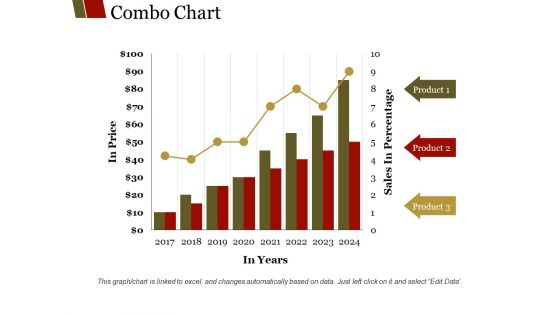
Combo Chart Ppt PowerPoint Presentation Summary Layouts
This is a combo chart ppt powerpoint presentation summary layouts. This is a eight stage process. The stages in this process are product, sales in percentage, in years, in price, graph.
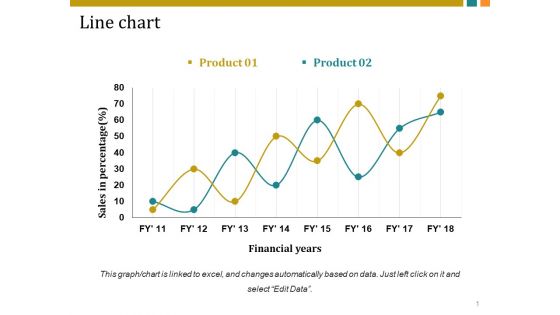
Line Chart Ppt PowerPoint Presentation Inspiration Vector
This is a line chart ppt powerpoint presentation inspiration vector. This is a two stage process. The stages in this process are sales in percentage, financial years, business, marketing, growth.

Combo Chart Ppt PowerPoint Presentation Show Elements
This is a combo chart ppt powerpoint presentation show elements. This is a three stage process. The stages in this process are in price, in years, business, marketing, growth.
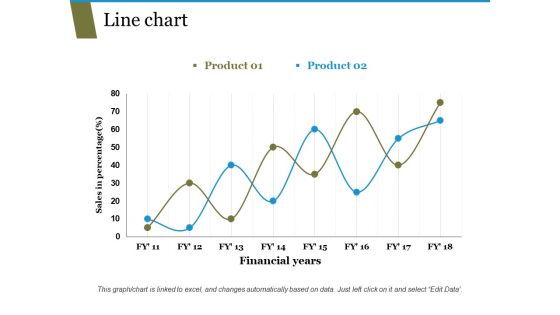
Line Chart Ppt PowerPoint Presentation Pictures Templates
This is a line chart ppt powerpoint presentation pictures templates. This is a two stage process. The stages in this process are sales in percentage, financial years, business, marketing, growth.

Line Chart Ppt PowerPoint Presentation Styles Themes
This is a line chart ppt powerpoint presentation styles themes. This is a two stage process. The stages in this process are business, marketing, financial years, sales in percentage.

Line Chart Template 2 Ppt PowerPoint Presentation Model Background Image
This is a line chart template 2 ppt powerpoint presentation model background image. This is a two stage process. The stages in this process are sales in percentage, financial years, business, marketing, strategy, graph.
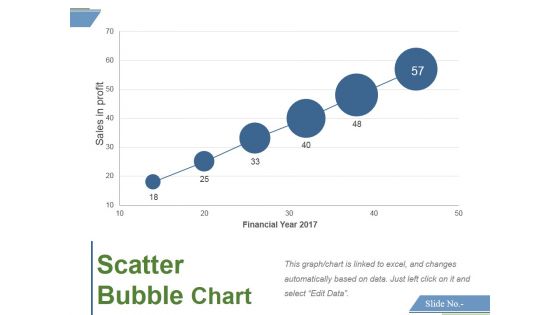
Scatter Bubble Chart Ppt PowerPoint Presentation Professional Model
This is a scatter bubble chart ppt powerpoint presentation professional model. This is a six stage process. The stages in this process are sales in profit, financial year, growth, business, marketing, strategy.
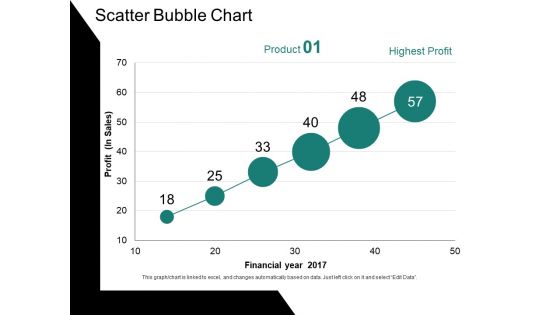
Scatter Bubble Chart Ppt PowerPoint Presentation Ideas Gallery
This is a scatter bubble chart ppt powerpoint presentation ideas gallery. This is a six stage process. The stages in this process are profit, financial year, chart, business, growth.

Line Bubble Chart Ppt PowerPoint Presentation Portfolio Slide Portrait
This is a line bubble chart ppt powerpoint presentation portfolio slide portrait. This is a six stage process. The stages in this process are highest profit, financial year, profit in sales, growth, business.
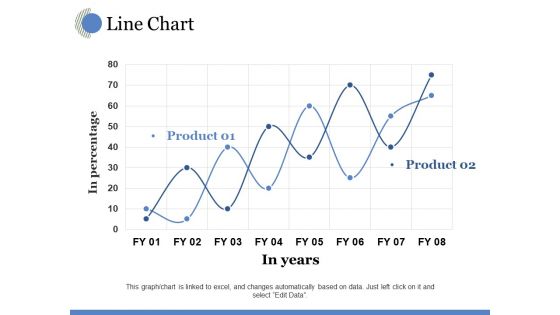
Line Chart Ppt PowerPoint Presentation Model Visual Aids
This is a line chart ppt powerpoint presentation model visual aids. This is a two stage process. The stages in this process are in years, in percentage, growth, business, marketing.

Line Chart Ppt PowerPoint Presentation Infographic Template Slides
This is a line chart ppt powerpoint presentation infographic template slides. This is a two stage process. The stages in this process are sales in percentage, financial years, business, marketing, graph.
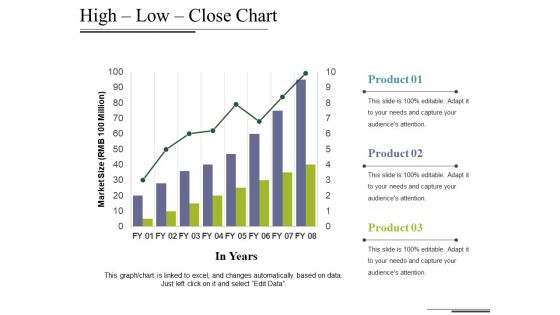
High Low Close Chart Ppt PowerPoint Presentation Styles Maker
This is a high low close chart ppt powerpoint presentation styles maker. This is a three stage process. The stages in this process are market size, in years, growth, business, marketing, graph.
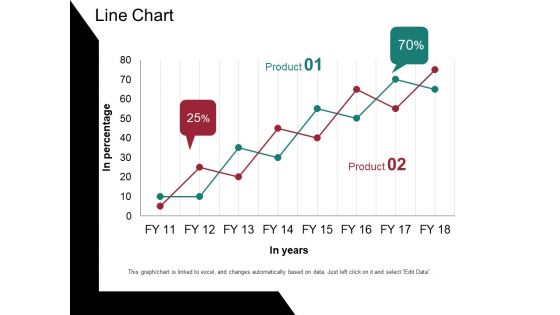
Line Chart Ppt PowerPoint Presentation Portfolio Design Templates
This is a line chart ppt powerpoint presentation portfolio design templates. This is a two stage process. The stages in this process are in percentage, in years, percentage, business, graph.

Line Chart Ppt PowerPoint Presentation Outline Infographic Template
This is a line chart ppt powerpoint presentation outline infographic template. This is a two stage process. The stages in this process are in percentage, product, in year, growth, success.

Clustered Column Ppt PowerPoint Presentation File Designs Download
This is a clustered column ppt powerpoint presentation file designs download. This is a six stage process. The stages in this process are dollars in thousands, financial year, product.
Expense Model Template Ppt PowerPoint Presentation Icon Vector
This is a expense model template ppt powerpoint presentation icon vector. This is a seven stage process. The stages in this process are name of company and purpose it serves, year, month, business, management.
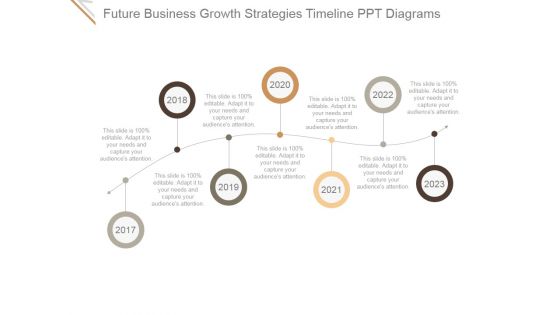
Future Business Growth Strategies Timeline Ppt PowerPoint Presentation Slides
This is a future business growth strategies timeline ppt powerpoint presentation slides. This is a seven stage process. The stages in this process are marketing, year, strategy, process, timeline.

Area Chart Financial Ppt PowerPoint Presentation Outline Professional
This is a area chart financial ppt powerpoint presentation outline professional. This is a four stage process. The stages in this process are product, sales in percentage, financial year.
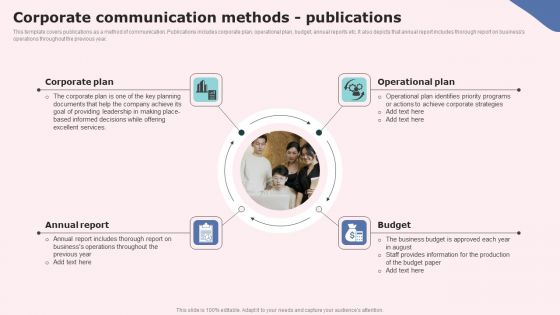
Corporate Communication Methods Publications Introduction PDF
This template covers publications as a method of communication. Publications includes corporate plan, operational plan, budget, annual reports etc. It also depicts that annual report includes thorough report on businesss operations throughout the previous year. Make sure to capture your audiences attention in your business displays with our gratis customizable Corporate Communication Methods Publications Introduction PDF. These are great for business strategies, office conferences, capital raising or task suggestions. If you desire to acquire more customers for your tech business and ensure they stay satisfied, create your own sales presentation with these plain slides.

Marketing And Sales Growth Timeline Ppt PowerPoint Presentation Guidelines
This is a marketing and sales growth timeline ppt powerpoint presentation guidelines. This is a five stage process. The stages in this process are year, icons, strategy, business, growth.

Business Intelligence And Analytics Timeline Ppt PowerPoint Presentation Shapes
This is a business intelligence and analytics timeline ppt powerpoint presentation shapes. This is a five stage process. The stages in this process are year, business, growth, success, timeline.

Evolution Of Quality Management System Ppt PowerPoint Presentation Visuals
This is a evolution of quality management system ppt powerpoint presentation visuals. This is a six stage process. The stages in this process are growth, year, business, marketing, success.

Project Performance Bar Graph Ppt PowerPoint Presentation Outline
This is a project performance bar graph ppt powerpoint presentation outline. This is a four stage process. The stages in this process are finance, year, business, marketing, future, marketing.

Area Chart Ppt PowerPoint Presentation Layouts Vector
This is a area chart ppt powerpoint presentation layouts vector. This is a two stage process. The stages in this process are area chart, product, sales in percentage, financial year.

Line Chart Ppt PowerPoint Presentation Layouts Show
This is a line chart ppt powerpoint presentation layouts show. This is a two stage process. The stages in this process are product, in years, in percentage, line chart, growth.

Column Chart Ppt PowerPoint Presentation Ideas Vector
This is a column chart ppt powerpoint presentation ideas vector. This is a two stage process. The stages in this process are column chart, product, financial years, sales in percentage, growth.

Line Chart Ppt PowerPoint Presentation Professional Grid
This is a line chart ppt powerpoint presentation professional grid. This is a two stage process. The stages in this process are sales in percentage, financial years, product, line chart.

Line Chart Ppt PowerPoint Presentation Ideas Elements
This is a line chart ppt powerpoint presentation ideas elements. This is a two stage process. The stages in this process are product, sales in percentage, financial year, business, line chart.
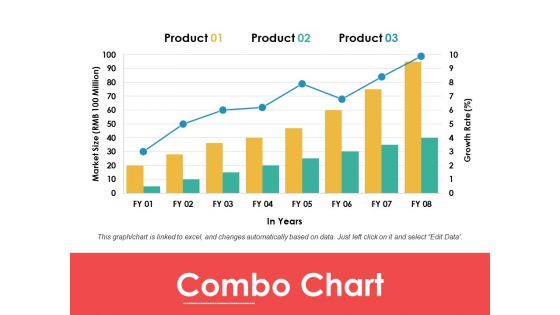
Combo Chart Ppt PowerPoint Presentation Pictures Objects
This is a combo chart ppt powerpoint presentation pictures objects. This is a three stage process. The stages in this process are product, combo chart, in years, market size.
Area Chart Ppt PowerPoint Presentation Icon Summary
This is a area chart ppt powerpoint presentation icon summary. This is a two stage process. The stages in this process are financial year, area chart, in percentage, product.
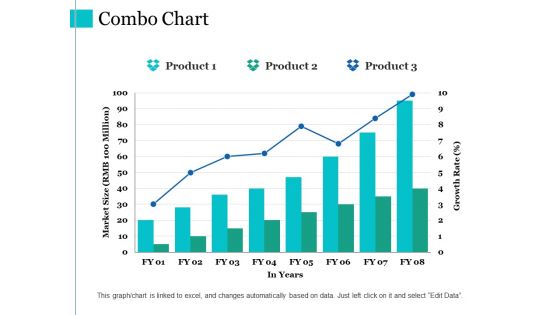
Combo Chart Ppt PowerPoint Presentation Gallery Diagrams
This is a combo chart ppt powerpoint presentation gallery diagrams. This is a three stage process. The stages in this process are combo chart, market size, product, in years, growth rate.
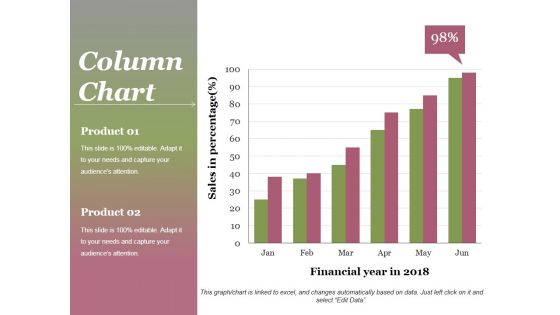
Column Chart Ppt PowerPoint Presentation Gallery Background
This is a column chart ppt powerpoint presentation gallery background. This is a two stage process. The stages in this process are product, sales in percentage, financial year, graph, success.
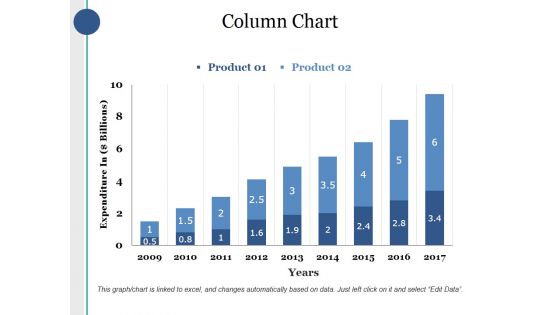
Column Chart Ppt PowerPoint Presentation Infographics Deck
This is a column chart ppt powerpoint presentation infographics deck. This is a two stage process. The stages in this process are product, expenditure in, years, bar graph, growth.

Column Chart Ppt PowerPoint Presentation Layouts Tips
This is a column chart ppt powerpoint presentation layouts tips. This is a six stage process. The stages in this process are sales in percentage, financial year, bar graph, growth, success.
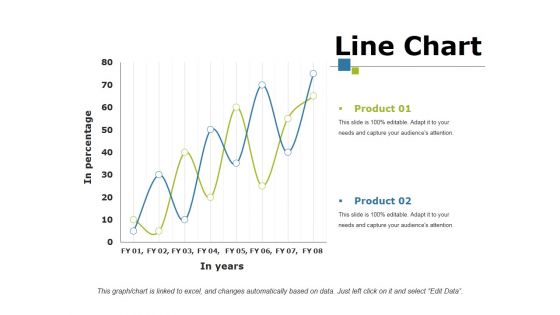
Line Chart Ppt PowerPoint Presentation Portfolio Mockup
This is a line chart ppt powerpoint presentation portfolio mockup. This is a two stage process. The stages in this process are product, in percentage, in year, growth, success.
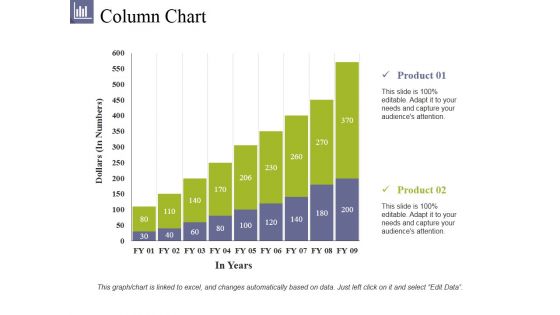
Column Chart Ppt PowerPoint Presentation File Summary
This is a column chart ppt powerpoint presentation file summary. This is a two stage process. The stages in this process are product, dollars, in years, bar graph, growth.
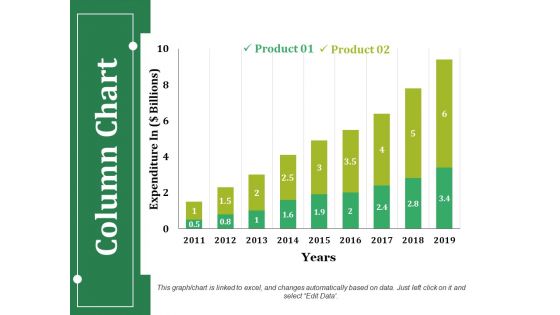
Column Chart Ppt PowerPoint Presentation Infographics Guidelines
This is a column chart ppt powerpoint presentation infographics guidelines. This is a two stage process. The stages in this process are product, expenditure in, years, business, bar graph.

Column Chart Ppt PowerPoint Presentation Slides Show
This is a column chart ppt powerpoint presentation slides show. This is a two stage process. The stages in this process are column chart, product, sales in percentage, financial year, growth.

Line Chart Ppt PowerPoint Presentation Summary Ideas
This is a line chart ppt powerpoint presentation summary ideas. This is a two stage process. The stages in this process are line chart, profit, product, financial years, business.
Column Chart Ppt PowerPoint Presentation Icon Show
This is a column chart ppt powerpoint presentation icon show. This is a two stage process. The stages in this process are column chart, product, years, bar graph, growth.
Area Chart Ppt PowerPoint Presentation Gallery Icons
This is a area chart ppt powerpoint presentation gallery icons. This is a two stage process. The stages in this process are financial year, sales in percentage, product, finance, graph.
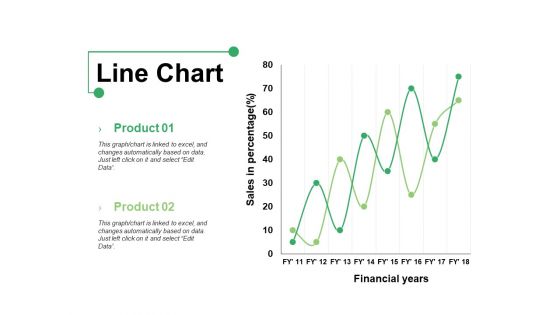
Line Chart Ppt PowerPoint Presentation Show Graphics Example
This is a line chart ppt powerpoint presentation show graphics example. This is a two stage process. The stages in this process are product, line chart, financial years, sales in percentage.
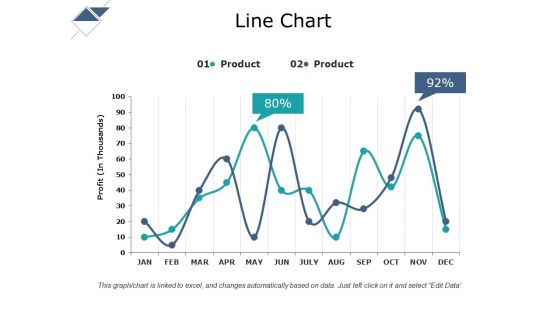
Line Chart Ppt PowerPoint Presentation Gallery Format Ideas
This is a line chart ppt powerpoint presentation gallery format ideas. This is a two stage process. The stages in this process are line chart, product, in year, profit.
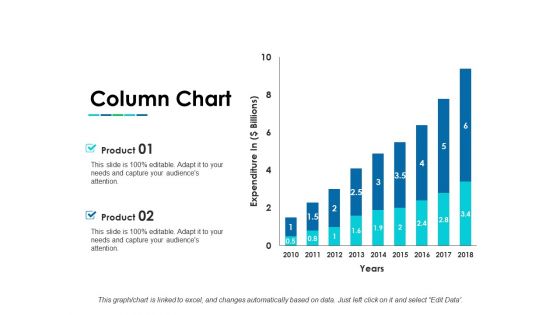
Column Chart Ppt PowerPoint Presentation Gallery Background Images
This is a column chart ppt powerpoint presentation gallery background images. This is a two stage process. The stages in this process are column chart, product, year, growth, expenditure.

 Home
Home