Non Automated Vs Automated Process Success Demonstration PDF
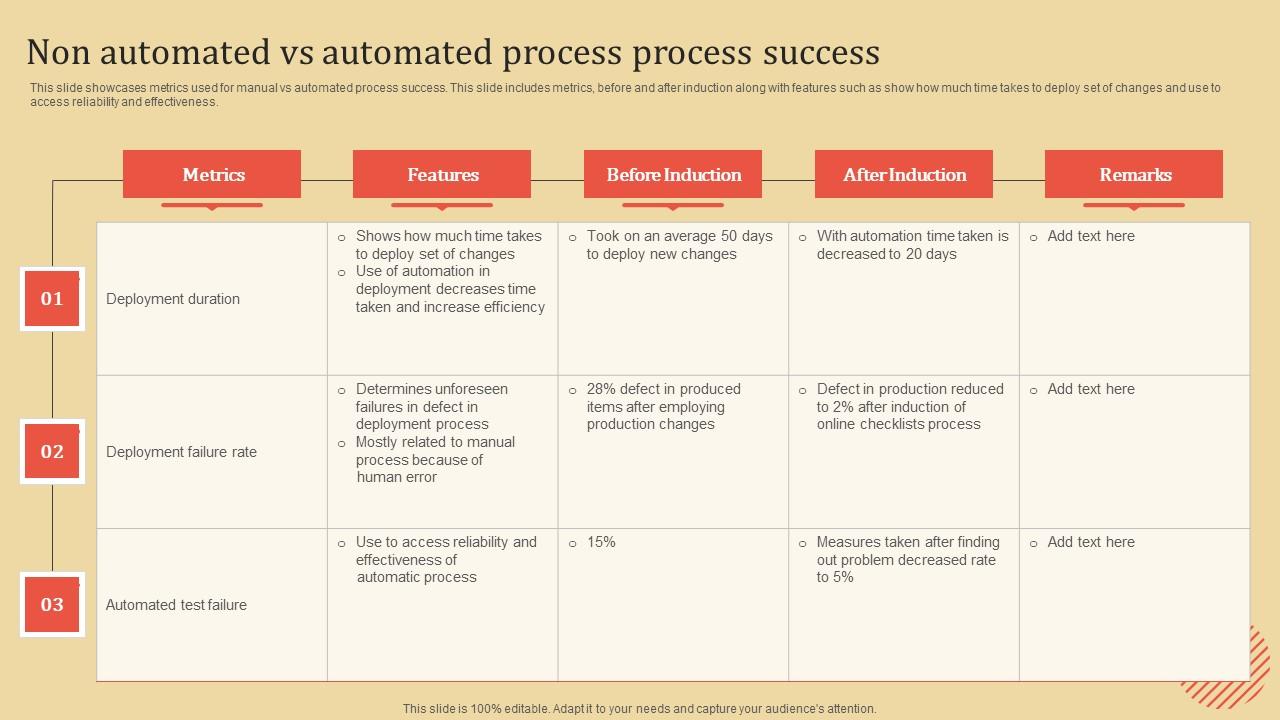
This slide showcases metrics used for manual vs automated process success. This slide includes metrics, before and after induction along with features such as show how much time takes to deploy set of changes and use to access reliability and effectiveness.
- Google Slides is a new FREE Presentation software from Google.
- All our content is 100% compatible with Google Slides.
- Just download our designs, and upload them to Google Slides and they will work automatically.
- Amaze your audience with SlideGeeks and Google Slides.
-
Want Changes to This PPT Slide? Check out our Presentation Design Services
- WideScreen Aspect ratio is becoming a very popular format. When you download this product, the downloaded ZIP will contain this product in both standard and widescreen format.
-

- Some older products that we have may only be in standard format, but they can easily be converted to widescreen.
- To do this, please open the SlideGeeks product in Powerpoint, and go to
- Design ( On the top bar) -> Page Setup -> and select "On-screen Show (16:9)” in the drop down for "Slides Sized for".
- The slide or theme will change to widescreen, and all graphics will adjust automatically. You can similarly convert our content to any other desired screen aspect ratio.
Compatible With Google Slides

Get This In WideScreen
You must be logged in to download this presentation.
 Impress Your
 Audience
 100%
100% Editable
Google Slides
Features of these PowerPoint presentation slides:
This slide showcases metrics used for manual vs automated process success. This slide includes metrics, before and after induction along with features such as show how much time takes to deploy set of changes and use to access reliability and effectiveness.Pitch your topic with ease and precision using this Non Automated Vs Automated Process Success Demonstration PDF This layout presents information on Deployment Duration, Deployment Failure, Automated Test Failure It is also available for immediate download and adjustment. So, changes can be made in the color, design, graphics or any other component to create a unique layout. This slide showcases metrics used for manual vs automated process success. This slide includes metrics, before and after induction along with features such as show how much time takes to deploy set of changes and use to access reliability and effectiveness.
People who downloaded this PowerPoint presentation also viewed the following :
Non Automated Vs Automated Process Success Demonstration PDF with all 9 slides:
Use our Non Automated Vs Automated Process Success Demonstration PDF to effectively help you save your valuable time. They are readymade to fit into any presentation structure.
Most Relevant Reviews
-
It saves your time and decrease your efforts in half.
-
Very unique and reliable designs.

 Home
Home 


