Financial KPI PowerPoint Presentation Templates
Explorе our comprеhеnsivе Financial KPI PPT tеmplatе, mеticulously craftеd to showcasе thе pivotal mеtrics illuminating an organization's financial efficiency. This thoughtfully curatеd presentation еmpowеrs financial еxpеrts to vividly illustratе financial indicators, shеdding light on thе path towards stratеgic objеctivеs. Elеvatе your contеnt's impact with this еxquisitе PowеrPoint and Googlе Slidеs gеm, attеsting to its indispеnsablе rolе in rеfining your narrativе. Download these financial kpi templates today and deliver an excellent presentation on excel kpi presentation.
Select Your Sub Category
- Analysis KPI
- Business KPI
- Call Center KPI
- Delivery KPI
- Digital Marketing KPI
- Employee KPI
- Engineering KPI
- Excel KPI
- Financial KPI
- Healthcare KPI
- HR KPI
- Inventory KPI
- IT KPI
- Maintenance KPI
- Management KPI
- Manufacturing KPI
- Marketing KPI
- Metrics KPI
- Monitoring KPI
- Online KPI
- Operations KPI
- Performance KPI
- Procurement KPI
- Quality KPI
-
Dashboard Showcasing Financial Metrics To Coffee Shop Business Plan Background PDF
This slide represents financial dashboard to develop coffee business plan. It covers revenue breakdown, revenue, cash flow, and cumulative cash flow for five years. Showcasing this set of slides titled dashboard showcasing financial metrics to coffee shop business plan background pdf. The topics addressed in these templates are dashboard showcasing financial metrics to coffee shop business plan. All the content presented in this PPT design is completely editable. Download it and make adjustments in color, background, font etc. as per your unique business setting.
-
Organizational Issue Resolution Tool Financial Performance Tracking Dashboard Background PDF
This slide presents the dashboard which will help firm in tracking the financial performance. This dashboard displays number of customers, vendors and revenues generated, expenses and profit incurred. Deliver an awe inspiring pitch with this creative Organizational Issue Resolution Tool Financial Performance Tracking Dashboard Background PDF bundle. Topics like Profit, Performance, Revenue can be discussed with this completely editable template. It is available for immediate download depending on the needs and requirements of the user.
-
Manual To Develop Strawman Proposal Financial Performance Tracking Dashboard Pictures PDF
This slide presents the dashboard which will help firm in tracking the financial performance. This dashboard displays number of customers, vendors and revenues generated, expenses and profit incurred. Deliver and pitch your topic in the best possible manner with this Manual To Develop Strawman Proposal Financial Performance Tracking Dashboard Pictures PDF. Use them to share invaluable insights on Profit, Revenue, Expense and impress your audience. This template can be altered and modified as per your expectations. So, grab it now.
-
Financial Report Of An IT Firm Companys Financials Dashboard Infographics PDF
Deliver an awe inspiring pitch with this creative Financial Report Of An IT Firm Companys Financials Dashboard Infographics PDF bundle. Topics like Operating Profit, Gross Profit, Income Statement can be discussed with this completely editable template. It is available for immediate download depending on the needs and requirements of the user.
-
Optimize Enterprise Core Financial Performance Tracking Dashboard Clipart PDF
This slide presents the dashboard which will help firm in tracking the financial performance. This dashboard displays number of customers, vendors and revenues generated, expenses and profit incurred. Deliver an awe inspiring pitch with this creative Optimize Enterprise Core Financial Performance Tracking Dashboard Clipart PDF bundle. Topics like Profit Revenue, Performance Expense, Budget Monthly can be discussed with this completely editable template. It is available for immediate download depending on the needs and requirements of the user.
-
Stock Requirement Plan Dashboard With Financial Overview Formats PDF
The following slide highlights the material requirement planning dashboard with financial overview. It depicts project details, project requirement, cost progress, hours progress, material planning, late orders and planning expectations. Showcasing this set of slides titled Stock Requirement Plan Dashboard With Financial Overview Formats PDF. The topics addressed in these templates are Project Requirement, Planning Expectations, Project Details. All the content presented in this PPT design is completely editable. Download it and make adjustments in color, background, font etc. as per your unique business setting.
-
Financial Forecast And Essential Metrics Dashboard Ppt File Show PDF
This slide elaborates about the multiple sources through which one can project about the growth and current status of the company. It includes lead conversion rate, monthly revenue , short term assets , net and gross profit margins, etc. Pitch your topic with ease and precision using this Financial Forecast And Essential Metrics Dashboard Ppt File Show PDF. This layout presents information on Monthly Revenue Growth, Short Term Assets, Overall Financial Performance, Net Profit Margin. It is also available for immediate download and adjustment. So, changes can be made in the color, design, graphics or any other component to create a unique layout.
-
Financial Forecast And Essential Metrics Dashboard Showing Cash Management Designs PDF
This slide contains the projections of the company financials to predict the future position so that better decisions could be taken for the growth prospective. It also includes ratios, cash balance, inventory analysis , etc. Showcasing this set of slides titled Financial Forecast And Essential Metrics Dashboard Showing Cash Management Designs PDF. The topics addressed in these templates are Days Sales Outstanding, Cash Management Dashboard, Days Inventory Outstanding. All the content presented in this PPT design is completely editable. Download it and make adjustments in color, background, font etc. as per your unique business setting.
-
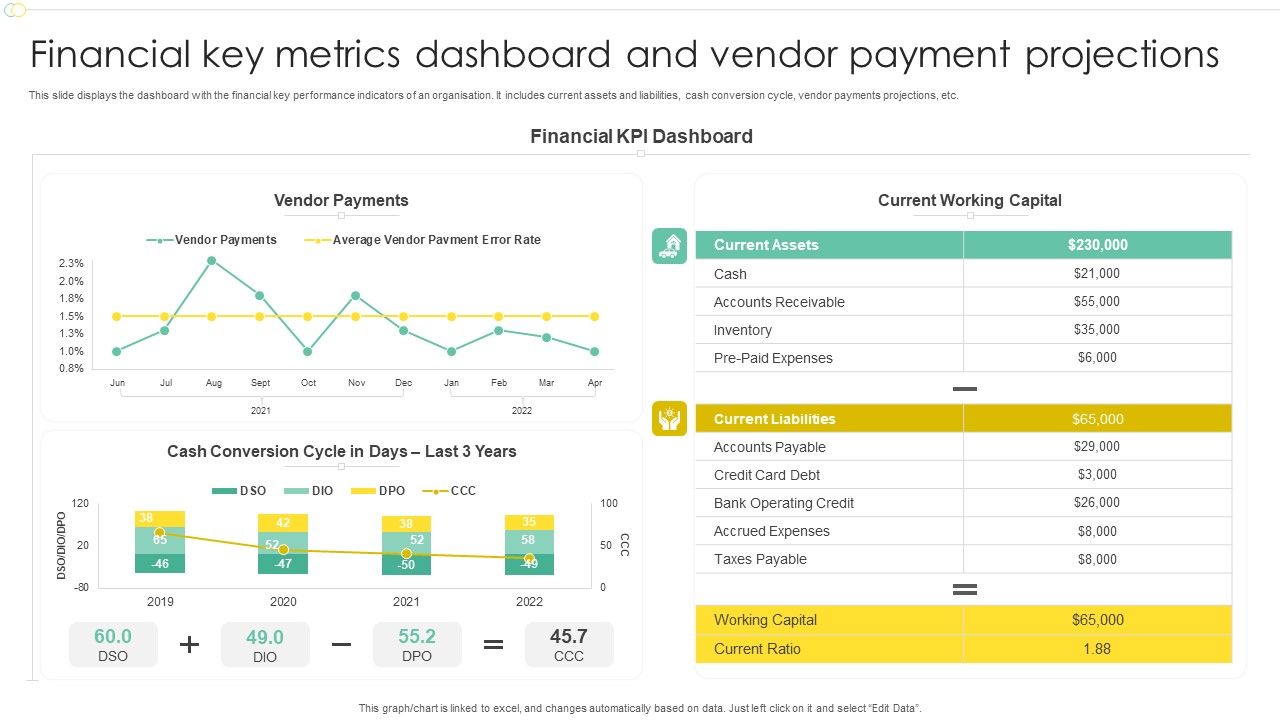
Financial Key Metrics Dashboard And Vendor Payment Projections Professional PDF
This slide displays the dashboard with the financial key performance indicators of an organisation. It includes current assets and liabilities, cash conversion cycle, vendor payments projections, etc. Pitch your topic with ease and precision using this Financial Key Metrics Dashboard And Vendor Payment Projections Professional PDF. This layout presents information on Financial KPI Dashboard, Current Working Capital, Vendor Payments. It is also available for immediate download and adjustment. So, changes can be made in the color, design, graphics or any other component to create a unique layout.
-
KPI Dashboard To Measure 360 Degree Financial Marketing Plan Slides PDF
This slide represents key performance indicator dashboard to analyse 360 degree financial strategy. It includes pie chart on revenue by product, summary and trends. Showcasing this set of slides titled KPI Dashboard To Measure 360 Degree Financial Marketing Plan Slides PDF. The topics addressed in these templates are Revenue Trend, Revenue Product YTD, Customer Information. All the content presented in this PPT design is completely editable. Download it and make adjustments in color, background, font etc. as per your unique business setting.
-
Project Budget Cost Dashboard For Financial Year Ideas PDF
Pitch your topic with ease and precision using this Project Budget Cost Dashboard For Financial Year Ideas PDF. This layout presents information on Budget, Service Provider, Redesign Employee. It is also available for immediate download and adjustment. So, changes can be made in the color, design, graphics or any other component to create a unique layout.
-
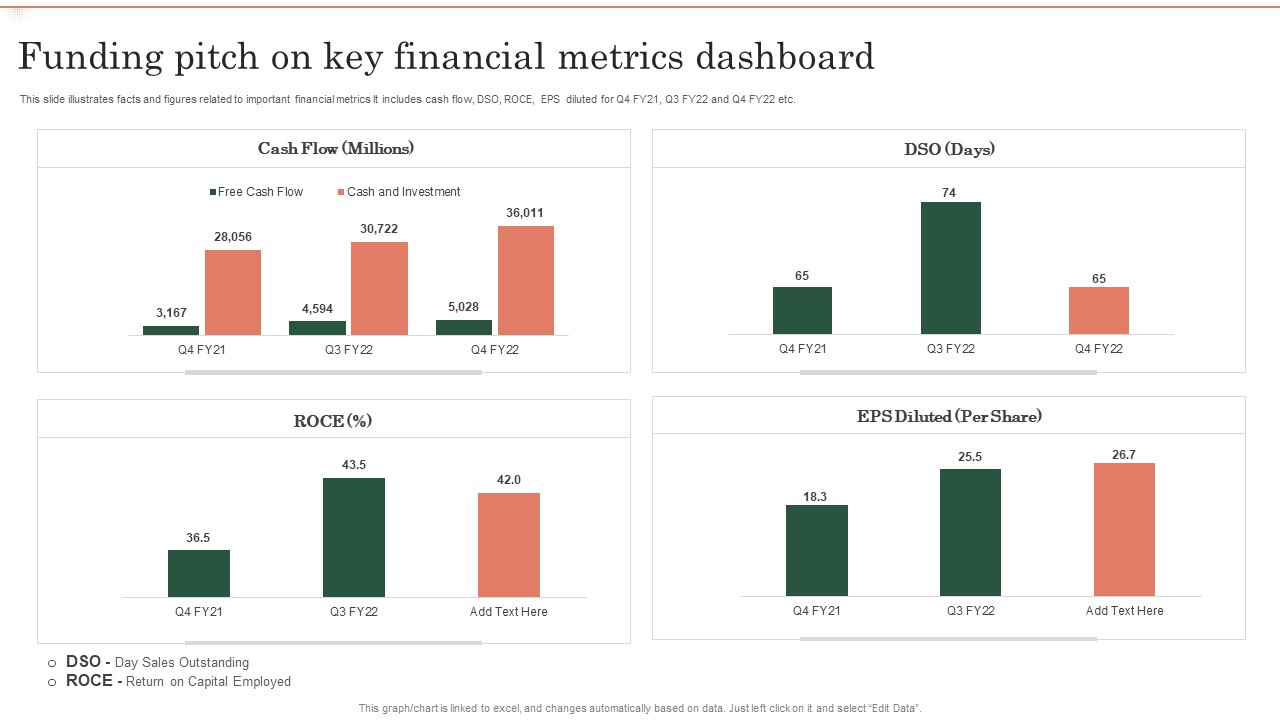
Funding Pitch On Key Financial Metrics Dashboard Ppt Ideas Deck PDF
This slide illustrates facts and figures related to important financial metrics It includes cash flow, DSO, ROCE, EPS diluted for Q4 FY21, Q3 FY22 and Q4 FY22 etc. Showcasing this set of slides titled Funding Pitch On Key Financial Metrics Dashboard Ppt Ideas Deck PDF. The topics addressed in these templates are Cash Flow, EPS Diluted, ROCE. All the content presented in this PPT design is completely editable. Download it and make adjustments in color, background, font etc. as per your unique business setting.
-
Financial Performance Indicator Dashboard Company Performance Evaluation Using KPI Structure PDF
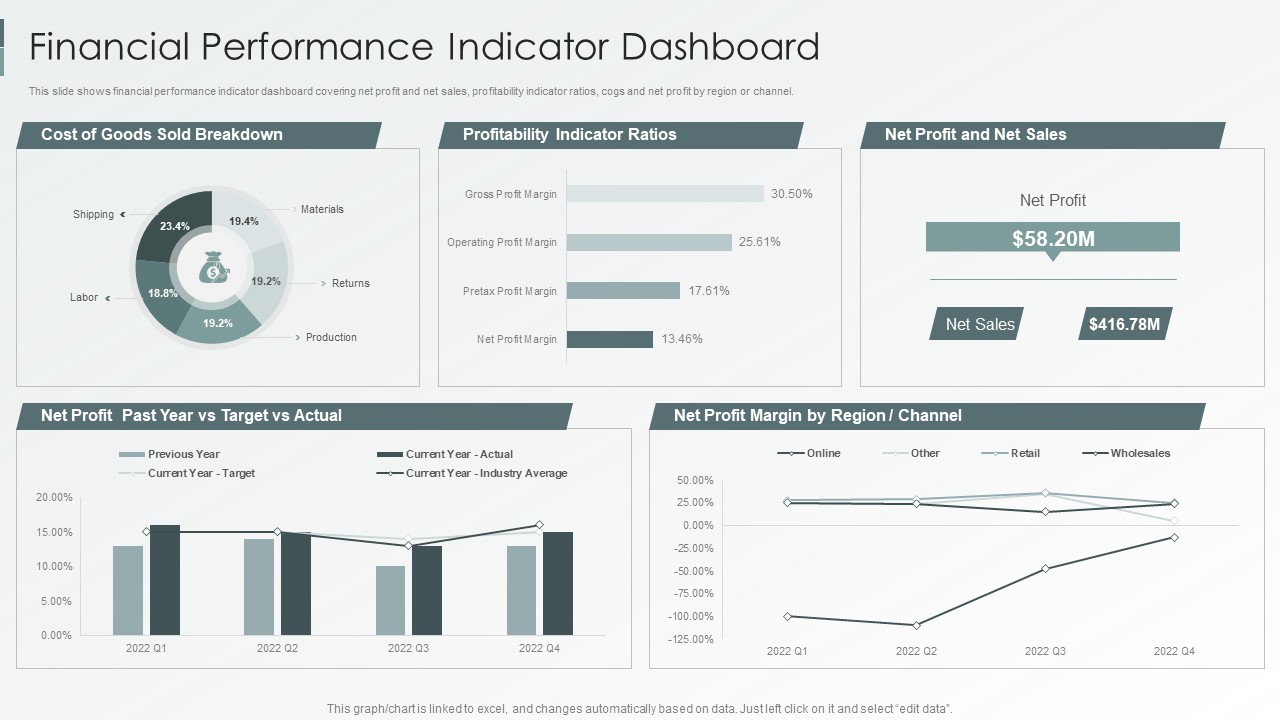
This slide shows financial performance indicator dashboard covering net profit and net sales, profitability indicator ratios, cogs and net profit by region or channel. Deliver and pitch your topic in the best possible manner with this Financial Performance Indicator Dashboard Company Performance Evaluation Using KPI Structure PDF. Use them to share invaluable insights on Financial Performance, Indicator Dashboard, Profitability Indicator and impress your audience. This template can be altered and modified as per your expectations. So, grab it now.
-
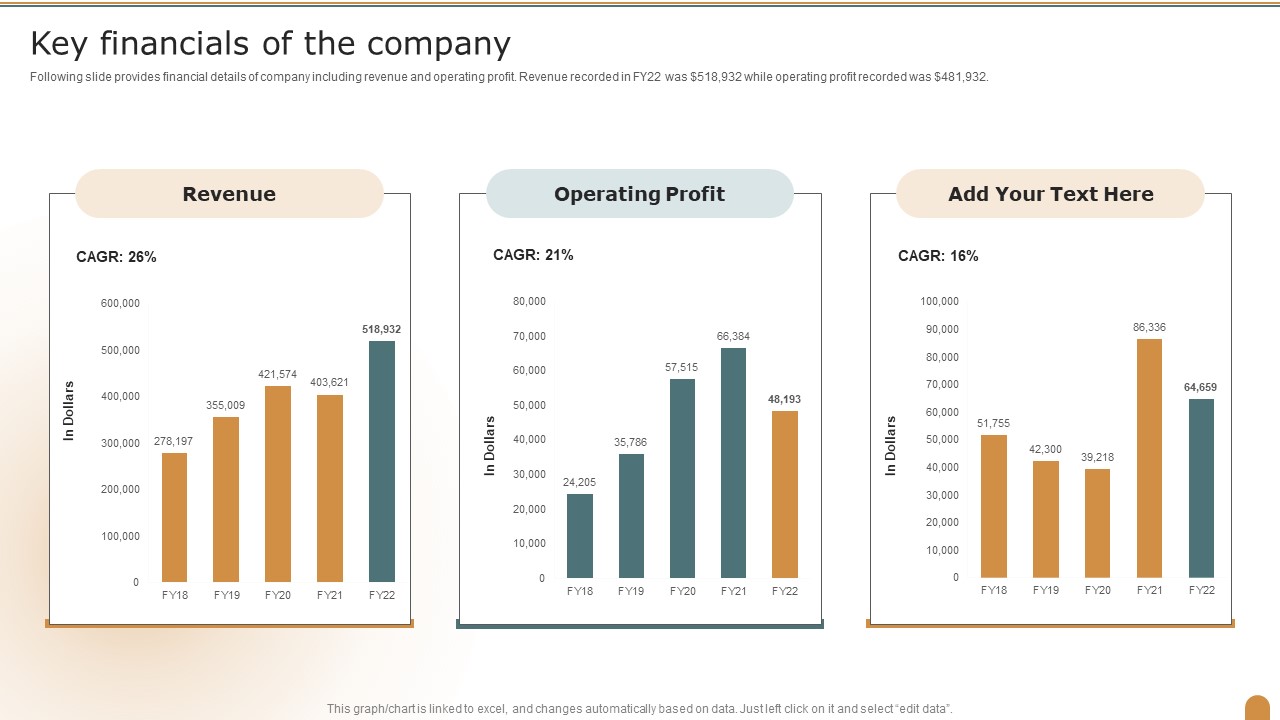
Key Financials Of The Company Company Performance Evaluation Using KPI Rules PDF
Following slide provides financial details of company including revenue and operating profit. Revenue recorded in FY22 was doller 518,932 while operating profit recorded was doller 481,932. Deliver an awe inspiring pitch with this creative Key Financials Of The Company Company Performance Evaluation Using KPI Rules PDF bundle. Topics like Revenue, Operating Profit, Company can be discussed with this completely editable template. It is available for immediate download depending on the needs and requirements of the user.
-
Financial Unsatisfactory Performance Dashboard With Accounting Ratios Diagrams PDF
This slide contains the information of the financial sector of the company to know where it stands and what needs to be done to improve the performance.It includes multiple ratios ROA, ROE, working capital ration and debt-equity ratio. Pitch your topic with ease and precision using this Financial Unsatisfactory Performance Dashboard With Accounting Ratios Diagrams PDF. This layout presents information on Return Assets, Working Capital, Return Equity. It is also available for immediate download and adjustment. So, changes can be made in the color, design, graphics or any other component to create a unique layout.
-
Quarterly Financial Performance Evaluation Dashboard Guidelines PDF
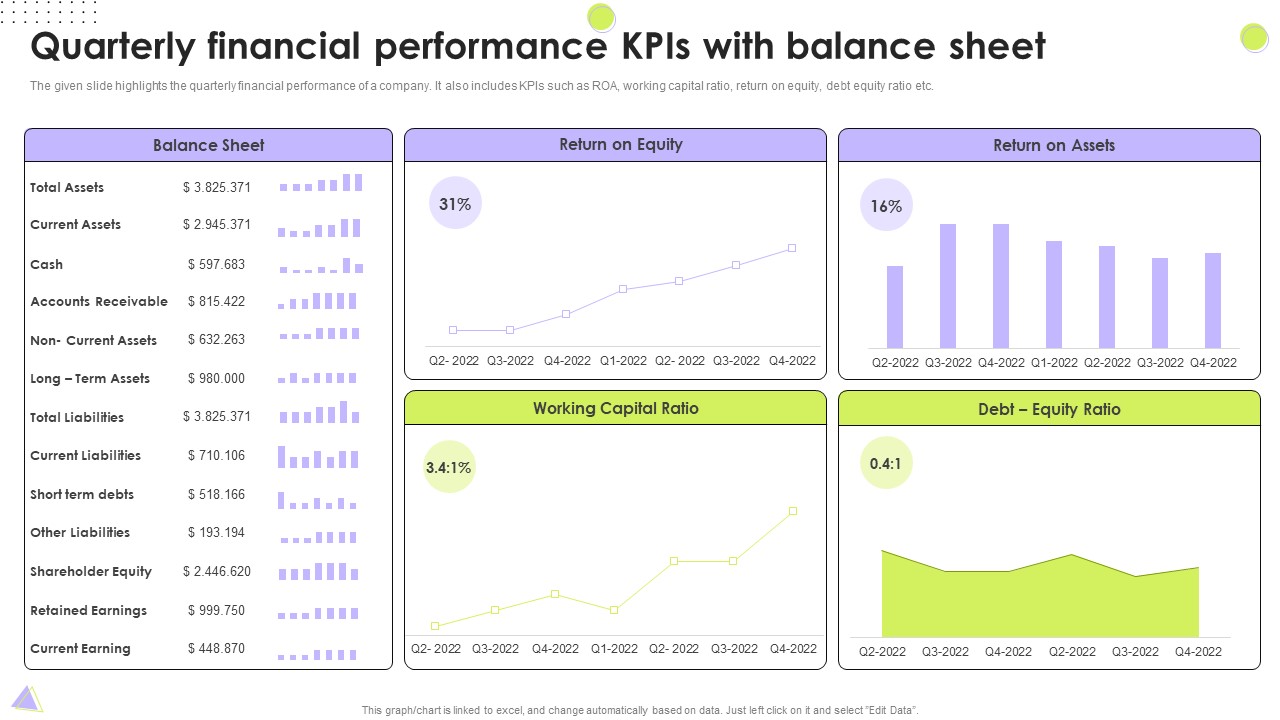
The following slide presents the KPI dashboard depicting the annual financial performance of the company quarter wise. It includes ROA, WCR, ROE, DER and balance sheet. Pitch your topic with ease and precision using this Quarterly Financial Performance Evaluation Dashboard Guidelines PDF. This layout presents information on Current Assets, Shareholder Equity, Common Stock. It is also available for immediate download and adjustment. So, changes can be made in the color, design, graphics or any other component to create a unique layout.
-
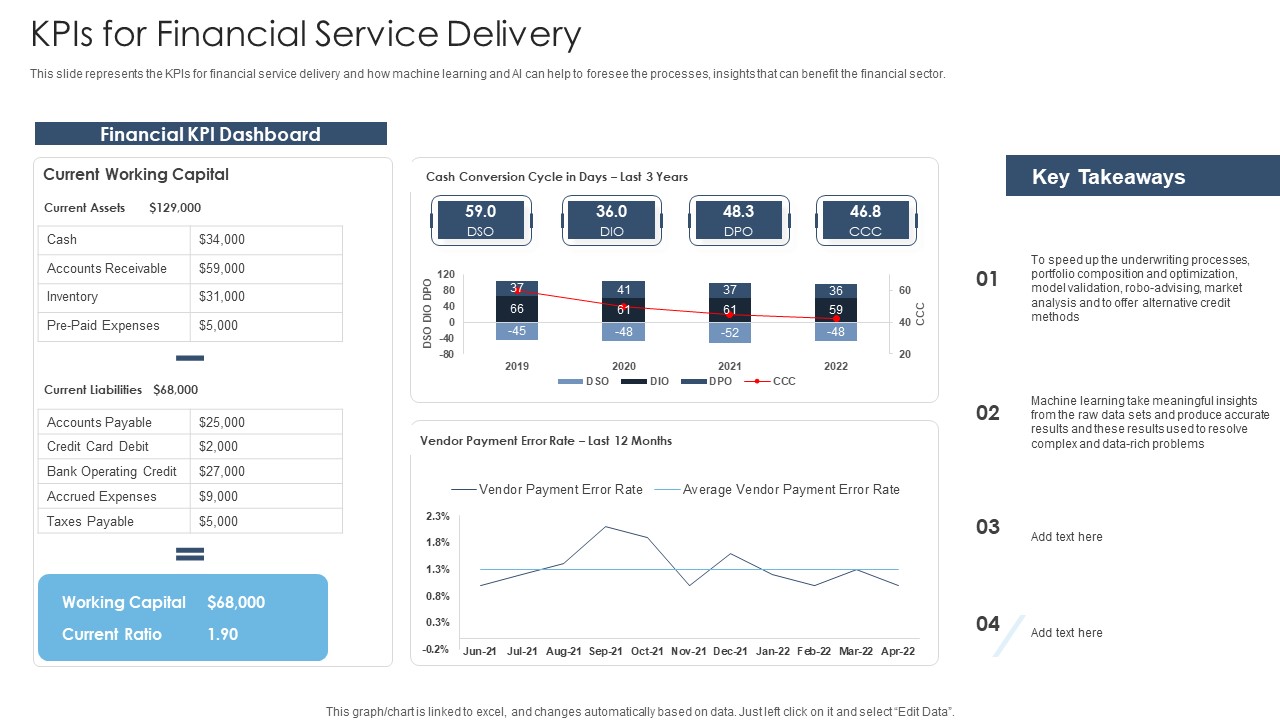
Achieving Proactive From Reactive Kpis For Financial Service Delivery Background PDF
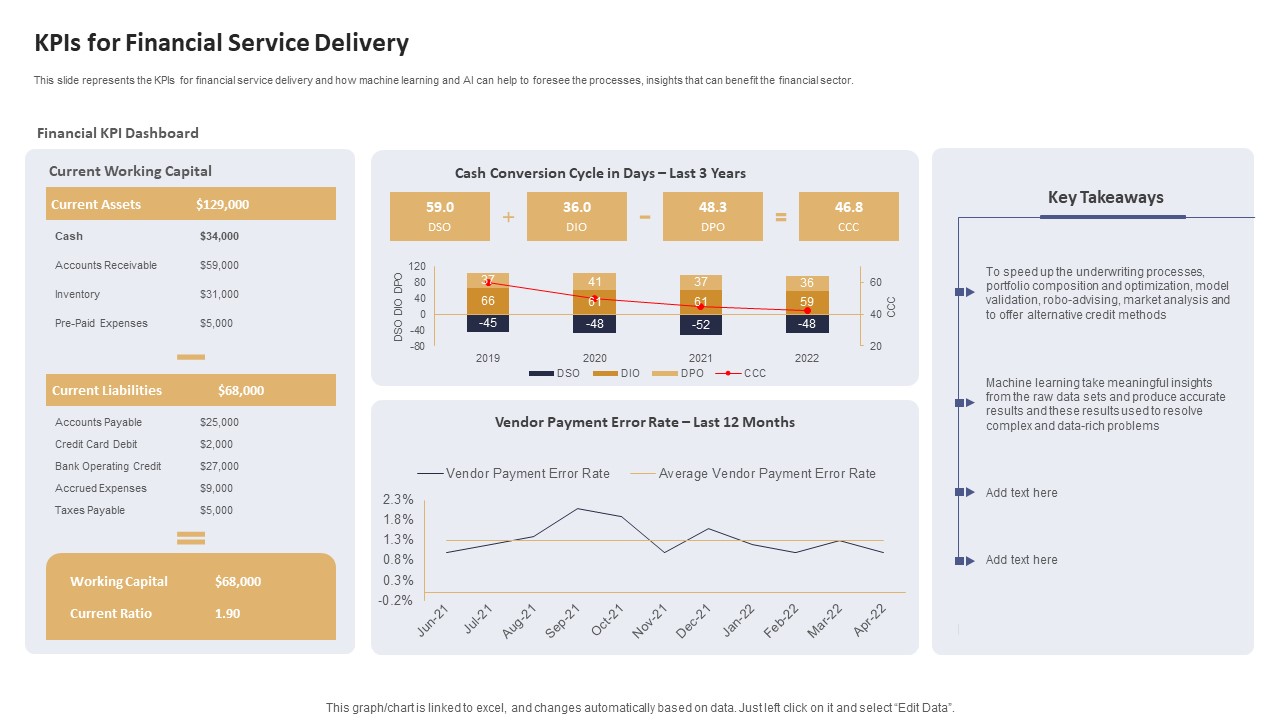
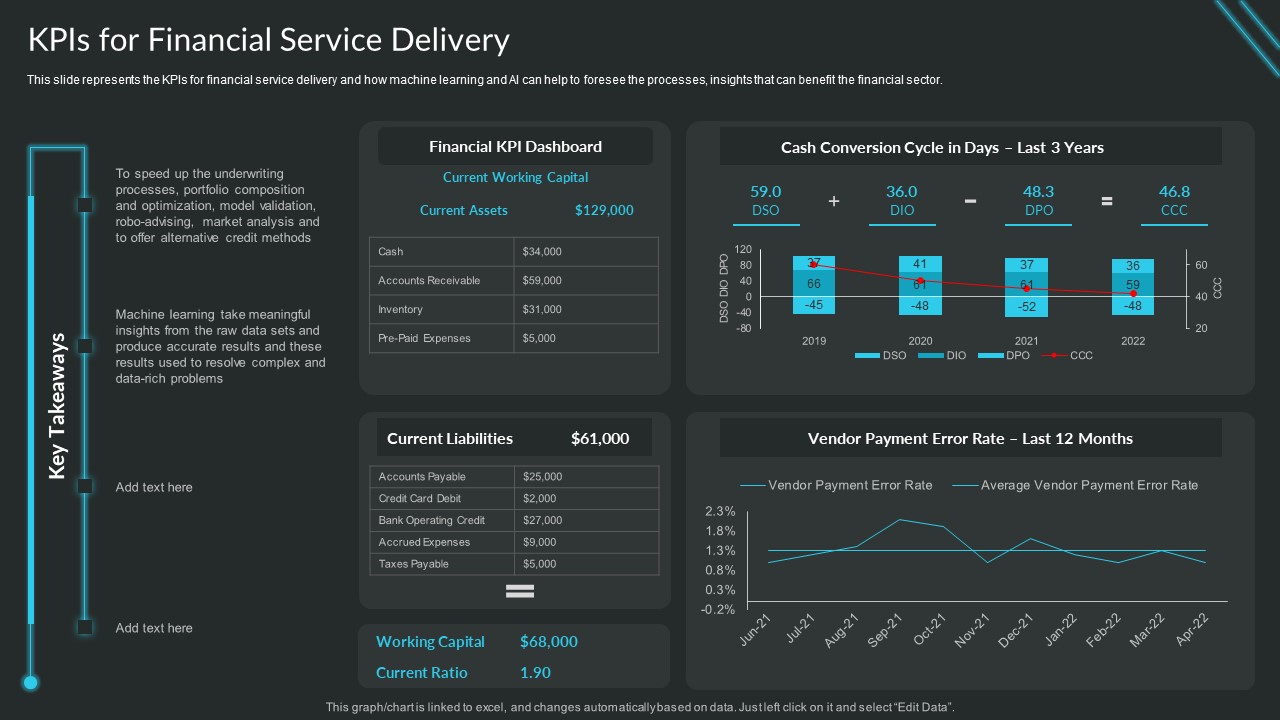
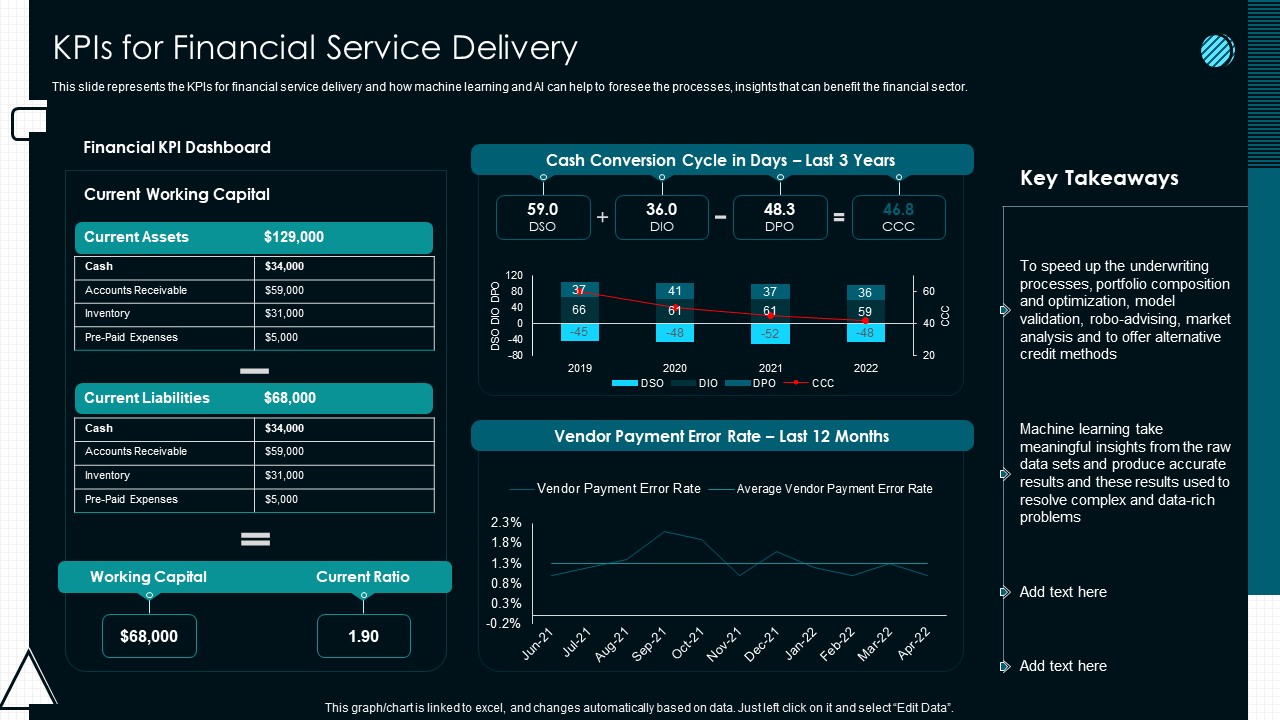
This slide represents the KPIs for financial service delivery and how machine learning and AI can help to foresee the processes, insights that can benefit the financial sector. Deliver an awe inspiring pitch with this creative Achieving Proactive From Reactive Kpis For Financial Service Delivery Background PDF bundle. Topics like Financial KPI Dashboard, Current Working Capital, Working Capital can be discussed with this completely editable template. It is available for immediate download depending on the needs and requirements of the user.
-
Data Processing Services Delivery Kpis For Financial Service Delivery Diagrams PDF
This slide represents the KPIs for financial service delivery and how machine learning and AI can help to foresee the processes, insights that can benefit the financial sector. Deliver an awe inspiring pitch with this creative Data Processing Services Delivery Kpis For Financial Service Delivery Diagrams PDF bundle. Topics like Financial KPI Dashboard, Current Working Capital, Cash Conversion can be discussed with this completely editable template. It is available for immediate download depending on the needs and requirements of the user.
-
Conducting Monetary Inclusion With Mobile Financial Services Branch Scoreboard Dashboard Sample PDF
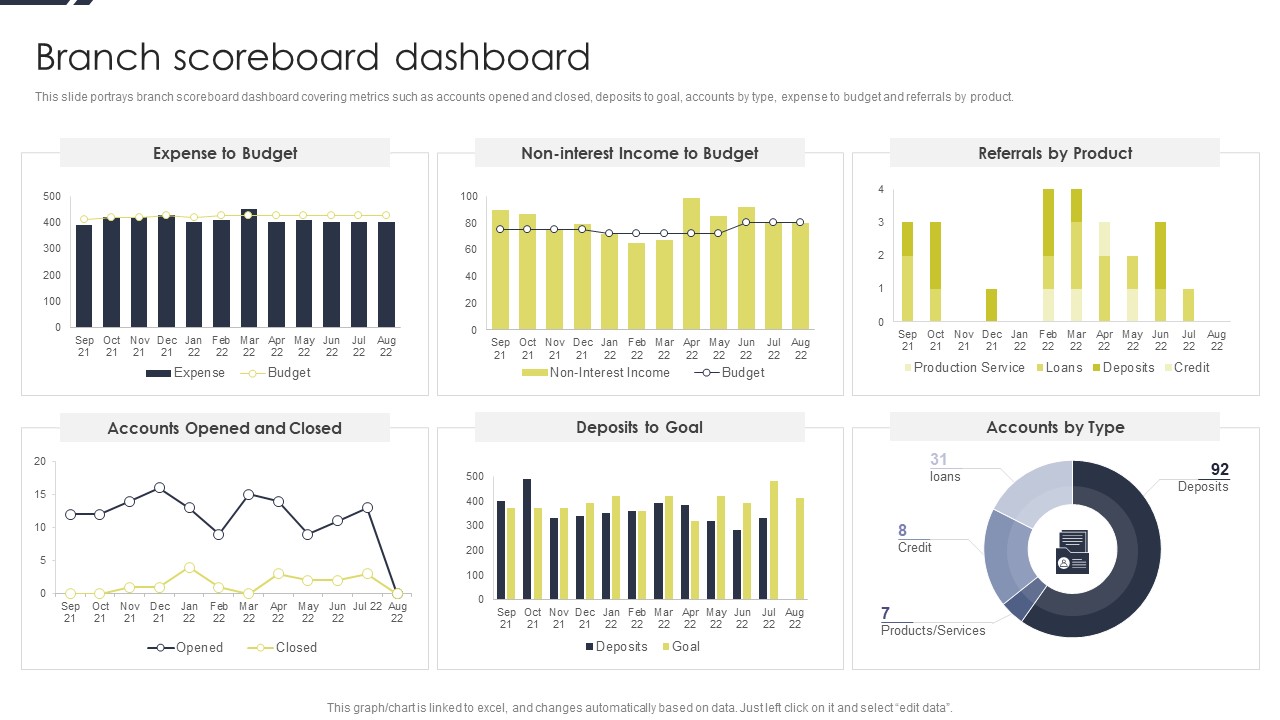
This slide portrays branch scoreboard dashboard covering metrics such as accounts opened and closed, deposits to goal, accounts by type, expense to budget and referrals by product. Deliver an awe inspiring pitch with this creative Conducting Monetary Inclusion With Mobile Financial Services Branch Scoreboard Dashboard Sample PDF bundle. Topics like Expense Budget, Referrals Product, Deposits To Goal can be discussed with this completely editable template. It is available for immediate download depending on the needs and requirements of the user.
-
Conducting Monetary Inclusion With Mobile Financial Services Total Loan And Deposits Dashboard Download PDF
This slide illustrates total loan and deposit dashboard covering information by region, by district along with twelve-month trend.Deliver and pitch your topic in the best possible manner with this Conducting Monetary Inclusion With Mobile Financial Services Total Loan And Deposits Dashboard Download PDF. Use them to share invaluable insights on Total Loan, Deposits Dashboard and impress your audience. This template can be altered and modified as per your expectations. So, grab it now.
-
Proactive Consumer Solution And How To Perform It Kpis For Financial Service Delivery Designs PDF
This slide represents the KPIs for financial service delivery and how machine learning and AI can help to foresee the processes, insights that can benefit the financial sector.Deliver an awe inspiring pitch with this creative Proactive Consumer Solution And How To Perform It Kpis For Financial Service Delivery Designs PDF bundle. Topics like Financial Dashboard, Machine Learning, Portfolio Composition can be discussed with this completely editable template. It is available for immediate download depending on the needs and requirements of the user.
-
KPI Dashboard To Monitor Financial Budget Allocation And Distribution Portrait PDF
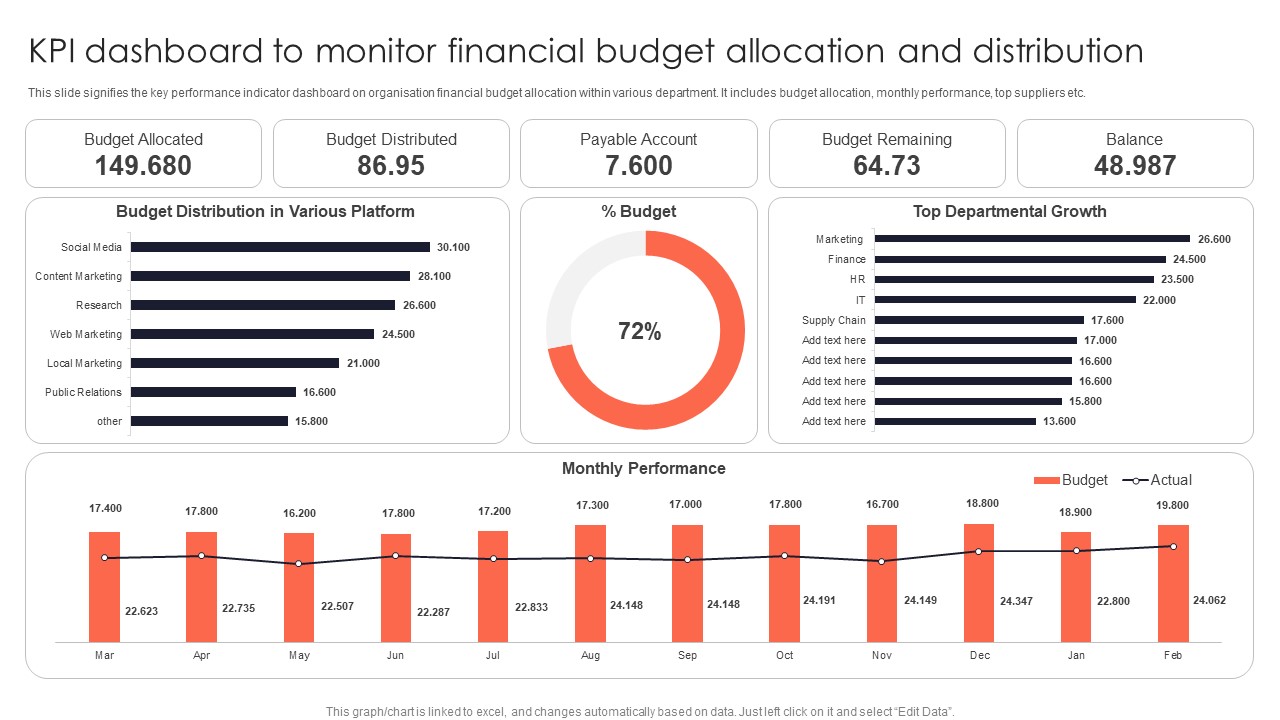
This slide signifies the key performance indicator dashboard on organisation financial budget allocation within various department. It includes budget allocation, monthly performance, top suppliers etc.Deliver an awe inspiring pitch with this creative KPI Dashboard To Monitor Financial Budget Allocation And Distribution Portrait PDF bundle. Topics like Budget Allocated, Budget Distributed, Payable Account can be discussed with this completely editable template. It is available for immediate download depending on the needs and requirements of the user.
-
Company Financial Performance Indicators Dashboard With Liquidity And Turnover Ratios Formats PDF
This graph or chart is linked to excel, and changes automatically based on data. Just left click on it and select Edit Data. Pitch your topic with ease and precision using this Company Financial Performance Indicators Dashboard With Liquidity And Turnover Ratios Formats PDF. This layout presents information on Cash Balance, Days Inventory Outstanding, Days Payable Outstanding. It is also available for immediate download and adjustment. So, changes can be made in the color, design, graphics or any other component to create a unique layout.
-
Company Financial Performance Indicators Dashboard With Working Capital And Cash Conversion Icons PDF
This slide shows dashboard of finance KPIs . It covers working capital, cash conversion cycle, vendor payment error rate ,current assets and liabilities. Showcasing this set of slides titled Company Financial Performance Indicators Dashboard With Working Capital And Cash Conversion Icons PDF. The topics addressed in these templates are Current Working Capital, Current Liabilities, Working Capital. All the content presented in this PPT design is completely editable. Download it and make adjustments in color, background, font etc. as per your unique business setting.
-
Financial Procedure Dashboard Depicting Cash Flow Metrics Structure PDF
This slide shows finance process dashboard depicting cash flow metrics which can be referred by managers to overlook current performance and make necessary decisions. It includes information about quick ratio, current ratio, cash balance, month end cash, unresolved sales, pending payables, etc. Pitch your topic with ease and precision using this Financial Procedure Dashboard Depicting Cash Flow Metrics Structure PDF. This layout presents information on Quick Ratio, Unresolved Sales, Pending Payables. It is also available for immediate download and adjustment. So, changes can be made in the color, design, graphics or any other component to create a unique layout.
-
Financial Procedure Dashboard Indicating Yearly Revenue Analysis Icons PDF
This slide illustrates finance process dashboard indicating yearly revenue analysis which contains gross profit margin, operating profit ratio, net profit, revenue and cost of goods sold cogs operating expenses, etc. It can be referred by company owners who can compare it with previous years performance and make related decisions for future. Showcasing this set of slides titled Financial Procedure Dashboard Indicating Yearly Revenue Analysis Icons PDF. The topics addressed in these templates are Operating Profit Percentage, Net Profit Percentage, Operating Profit Ratio. All the content presented in this PPT design is completely editable. Download it and make adjustments in color, background, font etc. as per your unique business setting.
-
Sales Enhancement Strategy Dashboard With Product Classification And Financial Analysis Formats PDF
This slide shows sales improvement plan dashboard for product classification and financial analysis which can be referred by companies which want to make quick decisions by having overview of organized and compiled data. It includes details such as comparison chart, state wise sales, total sales, adjusted margin, operational expenses, etc. Showcasing this set of slides titled Sales Enhancement Strategy Dashboard With Product Classification And Financial Analysis Formats PDF. The topics addressed in these templates are Gross Margin, Sales, Operational Expenses. All the content presented in this PPT design is completely editable. Download it and make adjustments in color, background, font etc. as per your unique business setting.
-
Insurance And Financial Product Insurance Agency Activities Tracking Dashboard Download PDF
This slide provides glimpse about insurance agency activities tracking dashboard which help management in monitoring activities. Deliver an awe inspiring pitch with this creative Insurance And Financial Product Insurance Agency Activities Tracking Dashboard Download PDF bundle. Topics like Scheduled Reports, Pending Activities, Latest Customers can be discussed with this completely editable template. It is available for immediate download depending on the needs and requirements of the user.
-
Financial Dashboard To Evaluate Internal Rate Of Return Microsoft PDF
This slide showcases dashboard that can help organization to calculate the internal rate of return on invested capital. Company can use it to communicate the return on investment to investors. Deliver an awe inspiring pitch with this creative Financial Dashboard To Evaluate Internal Rate Of Return Microsoft PDF bundle. Topics like Invested, Equity, Debt can be discussed with this completely editable template. It is available for immediate download depending on the needs and requirements of the user.
-
Financial Kpi Dashboard To Evaluate Fundraising Impact Demonstration PDF
This slide showcases dashboard that can help organization to evaluate key changes in financial KPIs post fundraising. Its key components are net profit margin, revenue, gross profit margin, debt to equity and return on equity. Deliver and pitch your topic in the best possible manner with this Financial Kpi Dashboard To Evaluate Fundraising Impact Demonstration PDF. Use them to share invaluable insights on Debt To Equity, Revenue, Gross Profit Margin and impress your audience. This template can be altered and modified as per your expectations. So, grab it now.
-
Optimize Service Delivery With Enhanced Kpis For Financial Service Delivery Demonstration PDF
This slide represents the KPIs for financial service delivery and how machine learning and AI can help to foresee the processes, insights that can benefit the financial sector.Deliver an awe inspiring pitch with this creative Optimize Service Delivery With Enhanced Kpis For Financial Service Delivery Demonstration PDF bundle. Topics like Underwriting Processes, Portfolio Composition, Optimization Model can be discussed with this completely editable template. It is available for immediate download depending on the needs and requirements of the user.
-
Metrics To Measure Business Performance Financial Performance Indicator Dashboard Pictures PDF
This slide shows financial performance indicator dashboard covering net profit and net sales, profitability indicator ratios, cogs and net profit by region or channel. Deliver an awe inspiring pitch with this creative Metrics To Measure Business Performance Financial Performance Indicator Dashboard Pictures PDF bundle. Topics like Net Profit, Net Sales, Cost Goods, Sold Breakdown can be discussed with this completely editable template. It is available for immediate download depending on the needs and requirements of the user.
-
Quarterly Financial Performance Kpis With Balance Sheet Designs PDF
The given slide highlights the quarterly financial performance of a company. It also includes KPIs such as ROA, working capital ratio, return on equity, debt equity ratio etc. Pitch your topic with ease and precision using this Quarterly Financial Performance Kpis With Balance Sheet Designs PDF. This layout presents information on Total Liabilities, Return On Equity, Working Capital Ratio. It is also available for immediate download and adjustment. So, changes can be made in the color, design, graphics or any other component to create a unique layout.
-
Kpis For Evaluating Business Sustainability Financial Performance Indicator Dashboard Demonstration PDF
This slide shows financial performance indicator dashboard covering net profit and net sales, profitability indicator ratios, cogs and net profit by region or channel. Deliver and pitch your topic in the best possible manner with this Kpis For Evaluating Business Sustainability Financial Performance Indicator Dashboard Demonstration PDF. Use them to share invaluable insights on Net Profit, Net Profit Margin, Profitability Indicator Ratios and impress your audience. This template can be altered and modified as per your expectations. So, grab it now.
-
Kpis For Evaluating Business Sustainability Key Financials Of The Company Rules PDF
Following slide provides financial details of company including revenue and operating profit. Revenue recorded in FY22 was dollar 518,932 while operating profit recorded was dollar 481,932. Deliver and pitch your topic in the best possible manner with this Kpis For Evaluating Business Sustainability Financial Performance Indicator Dashboard Demonstration PDF. Use them to share invaluable insights on Revenue, Operating Profit and impress your audience. This template can be altered and modified as per your expectations. So, grab it now.
-
Enterprise Sustainability Performance Metrics Financial Performance Indicator Dashboard Themes PDF
This slide shows financial performance indicator dashboard covering net profit and net sales, profitability indicator ratios, cogs and net profit by region or channel.Deliver an awe inspiring pitch with this creative Enterprise Sustainability Performance Metrics Financial Performance Indicator Dashboard Themes PDF bundle. Topics like Profitability Indicator, Sold Breakdown, Target Actual can be discussed with this completely editable template. It is available for immediate download depending on the needs and requirements of the user.
-
SAC Planning And Implementation SAP Analytics Cloud Dashboard For Financial Reporting Introduction PDF
This slide illustrates the SAP Analytics Cloud dashboard for financial reporting in terms of net revenue, operating profit, cost of goods sold, profitability trend and net revenue by country. It also provides details of net worth of incoming order and order distribution by country. Deliver an awe inspiring pitch with this creative SAC Planning And Implementation SAP Analytics Cloud Dashboard For Financial Reporting Introduction PDF bundle. Topics like Net Revenue, Operating Profit, Cost Goods Sold can be discussed with this completely editable template. It is available for immediate download depending on the needs and requirements of the user.
-
Project Metrics Dashboard With Financial Forecast Professional PDF
This slide shows the project management dashboard which includes the types of expenditure, follow up items, summary overview, with status updated, issues, risks, contingencies, financials, schedule and scope with starting and ending date, actual budget, etc. Showcasing this set of slides titled Project Metrics Dashboard With Financial Forecast Professional PDF. The topics addressed in these templates are Expenditure, Financial Forecast, Risks. All the content presented in this PPT design is completely editable. Download it and make adjustments in color, background, font etc. as per your unique business setting.
-
Project Portfolio Metrics Dashboard With Financial Summary Demonstration PDF
This slide focuses on project management dashboard which includes planned, remaining and actual cost, financial summary of portfolio, project workflows, statistics, portfolio variance summary with department, finish date, schedule, cost and work variance, etc. Showcasing this set of slides titled Project Portfolio Metrics Dashboard With Financial Summary Demonstration PDF. The topics addressed in these templates are Planned Cost, Portfolio Statistics, Portfolio Variances Summary. All the content presented in this PPT design is completely editable. Download it and make adjustments in color, background, font etc. as per your unique business setting.
-
Annual Financial Performance Administration Dashboard With Key Metrics Ppt PowerPoint Presentation Icon Visual Aids PDF
Showcasing this set of slides titled Annual Financial Performance Administration Dashboard With Key Metrics Ppt PowerPoint Presentation Icon Visual Aids PDF. The topics addressed in these templates are Accounts Receivable, Accounts Payable, Planned Profit Margin. All the content presented in this PPT design is completely editable. Download it and make adjustments in color, background, font etc. as per your unique business setting.
-
Strategic Financial Planning KPI Dashboard Ppt PowerPoint Presentation Layouts Background Designs PDF
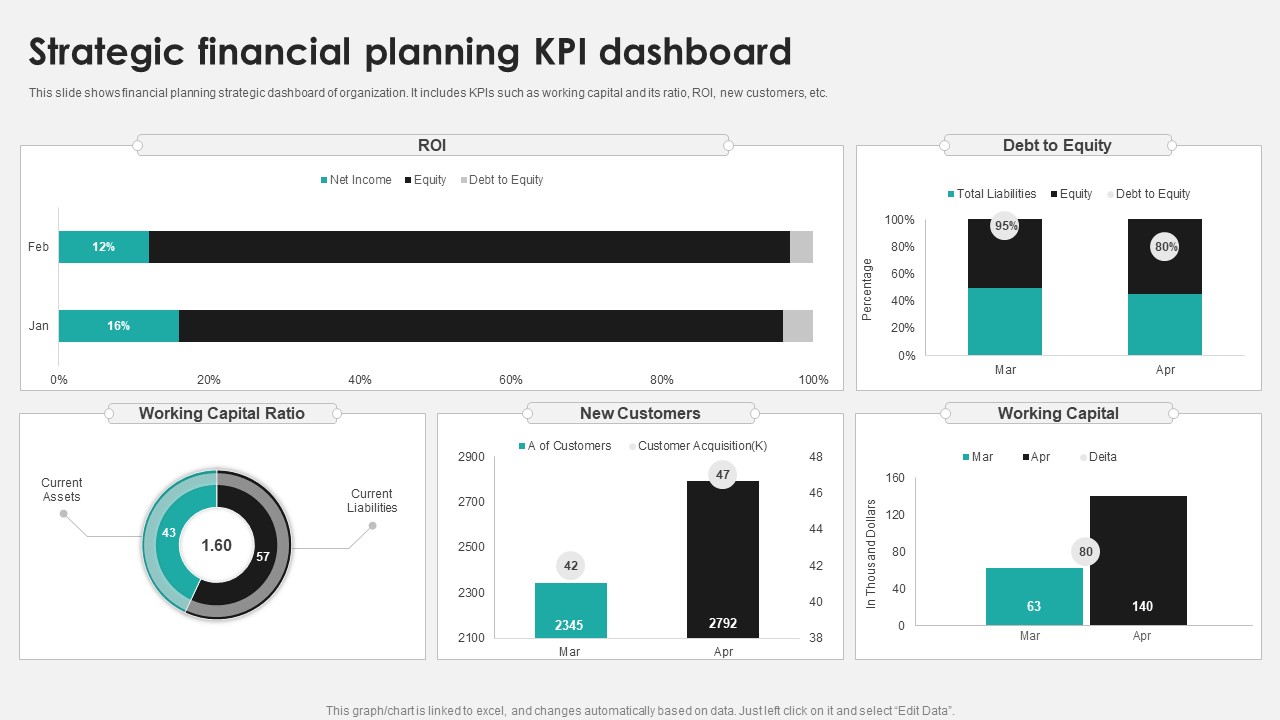
This slide shows financial planning strategic dashboard of organization. It includes KPIs such as working capital and its ratio, ROI, new customers, etc. Pitch your topic with ease and precision using this Strategic Financial Planning KPI Dashboard Ppt PowerPoint Presentation Layouts Background Designs PDF. This layout presents information on New Customers, Working Capital, Debt Equity. It is also available for immediate download and adjustment. So, changes can be made in the color, design, graphics or any other component to create a unique layout.
-
Financial Feasibility Analysis Dashboard Covering Cost Benefit Analysis Professional PDF
This slide illustrates economic feasibility dashboard covering cost benefit analysis. It contains information about development of project, support costs and fiscal year return. Showcasing this set of slides titled Financial Feasibility Analysis Dashboard Covering Cost Benefit Analysis Professional PDF. The topics addressed in these templates are Project Development Costs, Cost Benefit Analysis, Fiscal Year Return. All the content presented in this PPT design is completely editable. Download it and make adjustments in color, background, font etc. as per your unique business setting.
-
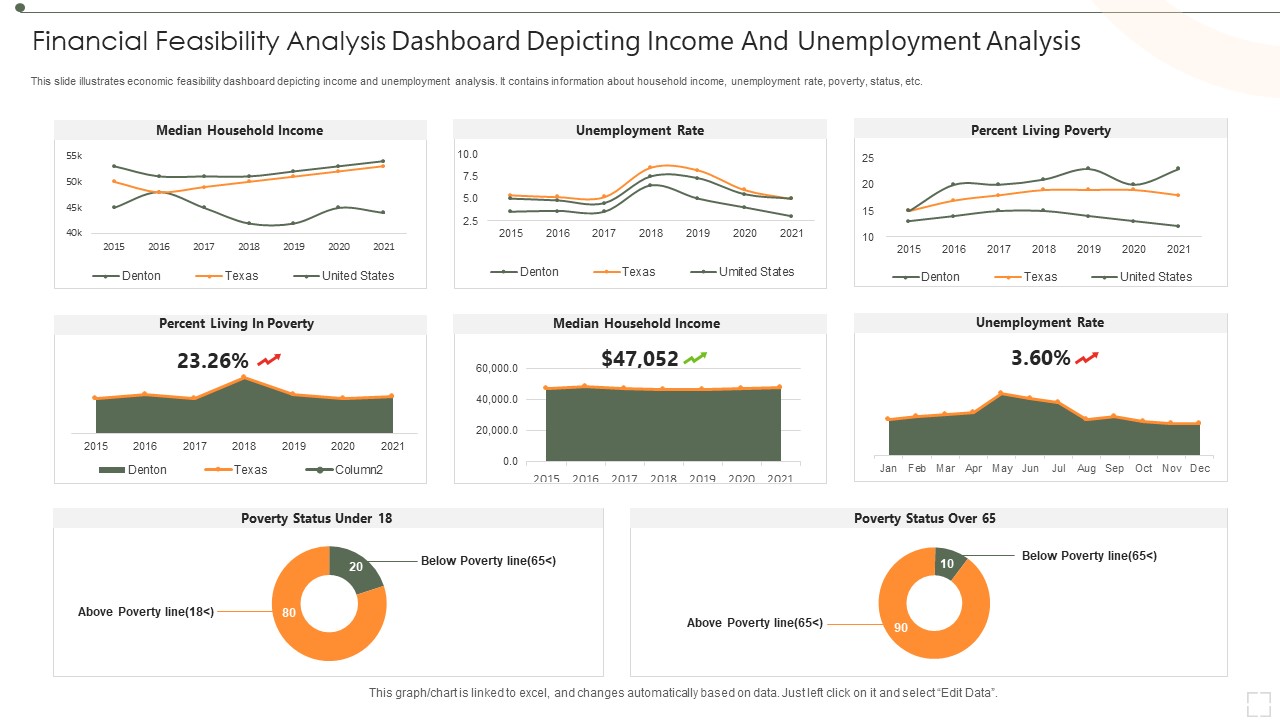
Financial Feasibility Analysis Dashboard Depicting Income And Unemployment Analysis Download PDF
This slide illustrates economic feasibility dashboard depicting income and unemployment analysis. It contains information about household income, unemployment rate, poverty, status, etc. Pitch your topic with ease and precision using this Financial Feasibility Analysis Dashboard Depicting Income And Unemployment Analysis Download PDF. This layout presents information on Median Household Income, Unemployment Rate, Percent Living Poverty. It is also available for immediate download and adjustment. So, changes can be made in the color, design, graphics or any other component to create a unique layout.
-
Earning Potential And Financial Forecasting Dashboard Summary PDF
This slide illustrates facts and figures related to sales figures. It includes data of monthly revenue generation FY23, yearly revenue, expected revenue generation FY23 etc. Pitch your topic with ease and precision using this Earning Potential And Financial Forecasting Dashboard Summary PDF. This layout presents information on Sales Revenue, Expected Revenue, Product. It is also available for immediate download and adjustment. So, changes can be made in the color, design, graphics or any other component to create a unique layout.
-
Financial Budgeting And Assessment Dashboard With Revenue Variance Designs PDF
This slide shows the dashboard representing financial analysis and planning of an organization. It highlights the set revenue targets and actual revenue with the help of graphs. Showcasing this set of slides titled Financial Budgeting And Assessment Dashboard With Revenue Variance Designs PDF. The topics addressed in these templates are YTD Revenue, Revenue Delta, Revenue Variance. All the content presented in this PPT design is completely editable. Download it and make adjustments in color, background, font etc. as per your unique business setting.
-
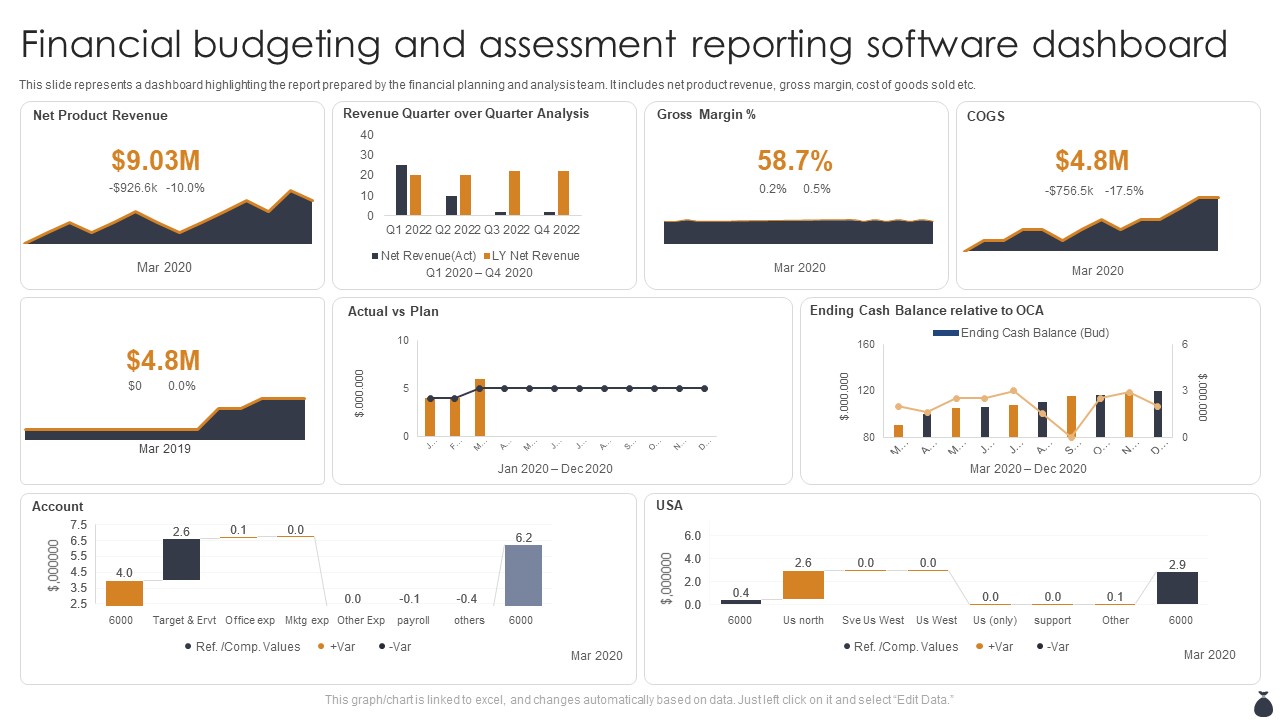
Financial Budgeting And Assessment Reporting Software Dashboard Template PDF
This slide represents a dashboard highlighting the report prepared by the financial planning and analysis team. It includes net product revenue, gross margin, cost of goods sold etc. Showcasing this set of slides titled Financial Budgeting And Assessment Reporting Software Dashboard Template PDF. The topics addressed in these templates are Net Product Revenue, Actual Vs Plan, Account. All the content presented in this PPT design is completely editable. Download it and make adjustments in color, background, font etc. as per your unique business setting.
-
Financial Kpi Dashboard To Measure Brand Performance Brand Value Estimation Guide Inspiration PDF
Mentioned slide showcases KPI dashboard that can be used to check the financial performance of a brand. Metrics covered in the dashboard are return on assets, working capital ratio, return on equity etc.Are you in need of a template that can accommodate all of your creative concepts This one is crafted professionally and can be altered to fit any style. Use it with Google Slides or PowerPoint. Include striking photographs, symbols, depictions, and other visuals. Fill, move around, or remove text boxes as desired. Test out color palettes and font mixtures. Edit and save your work, or work with colleagues. Download Financial Kpi Dashboard To Measure Brand Performance Brand Value Estimation Guide Inspiration PDF and observe how to make your presentation outstanding. Give an impeccable presentation to your group and make your presentation unforgettable.
-
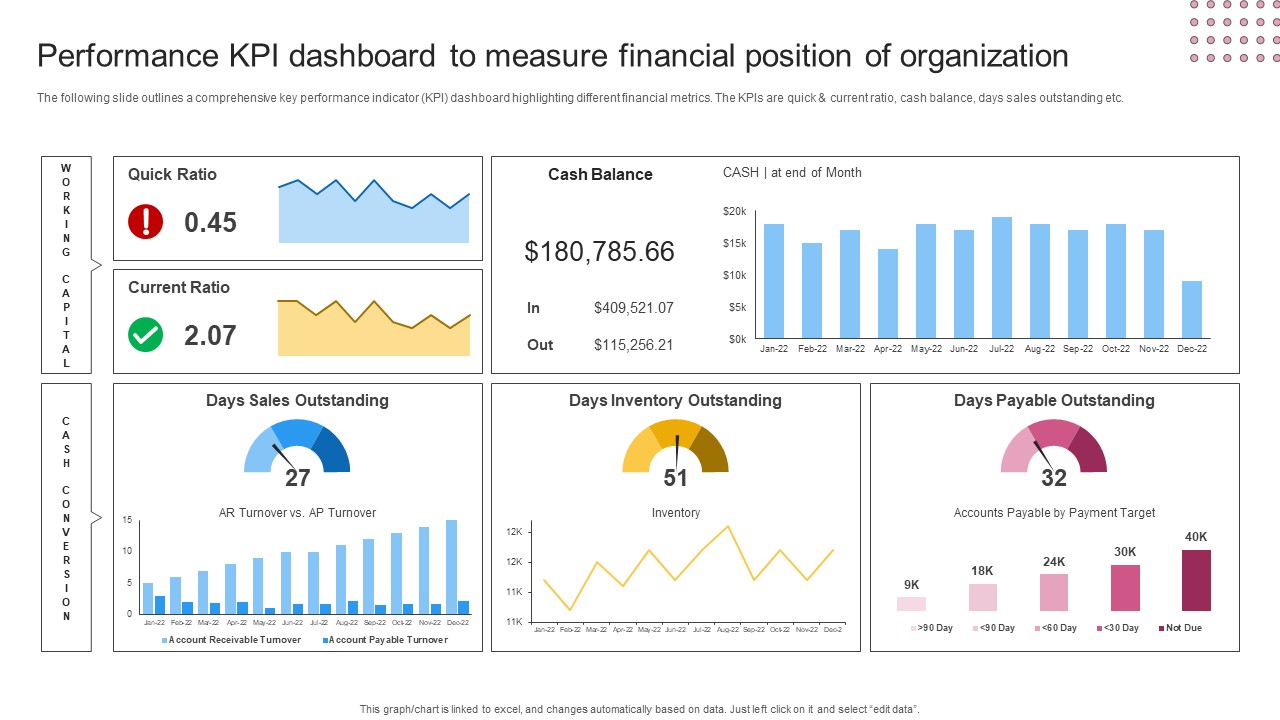
Performance KPI Dashboard To Measure Financial Position Of Organization Pictures PDF
The following slide outlines a comprehensive key performance indicator KPI dashboard highlighting different financial metrics. The KPIs are quick and current ratio, cash balance, days sales outstanding etc. Slidegeeks is here to make your presentations a breeze with Performance KPI Dashboard To Measure Financial Position Of Organization Pictures PDF With our easy to use and customizable templates, you can focus on delivering your ideas rather than worrying about formatting. With a variety of designs to choose from, you are sure to find one that suits your needs. And with animations and unique photos, illustrations, and fonts, you can make your presentation pop. So whether you are giving a sales pitch or presenting to the board, make sure to check out Slidegeeks first.
-
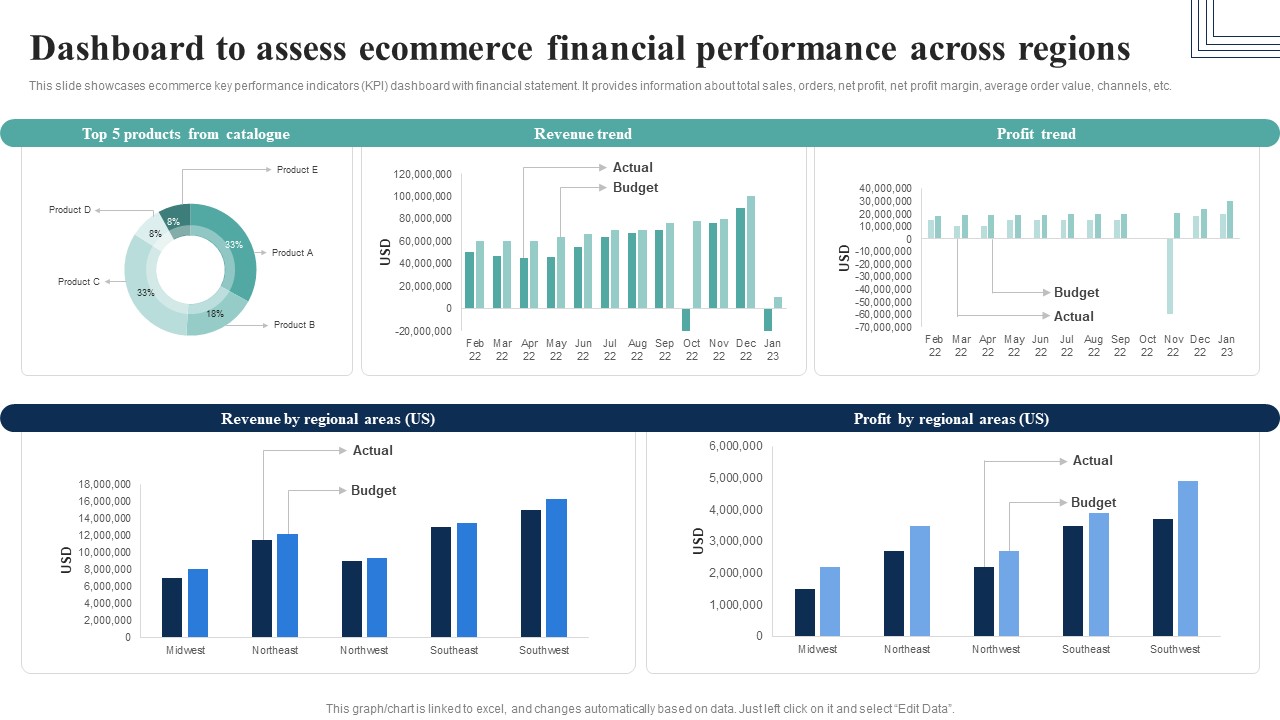
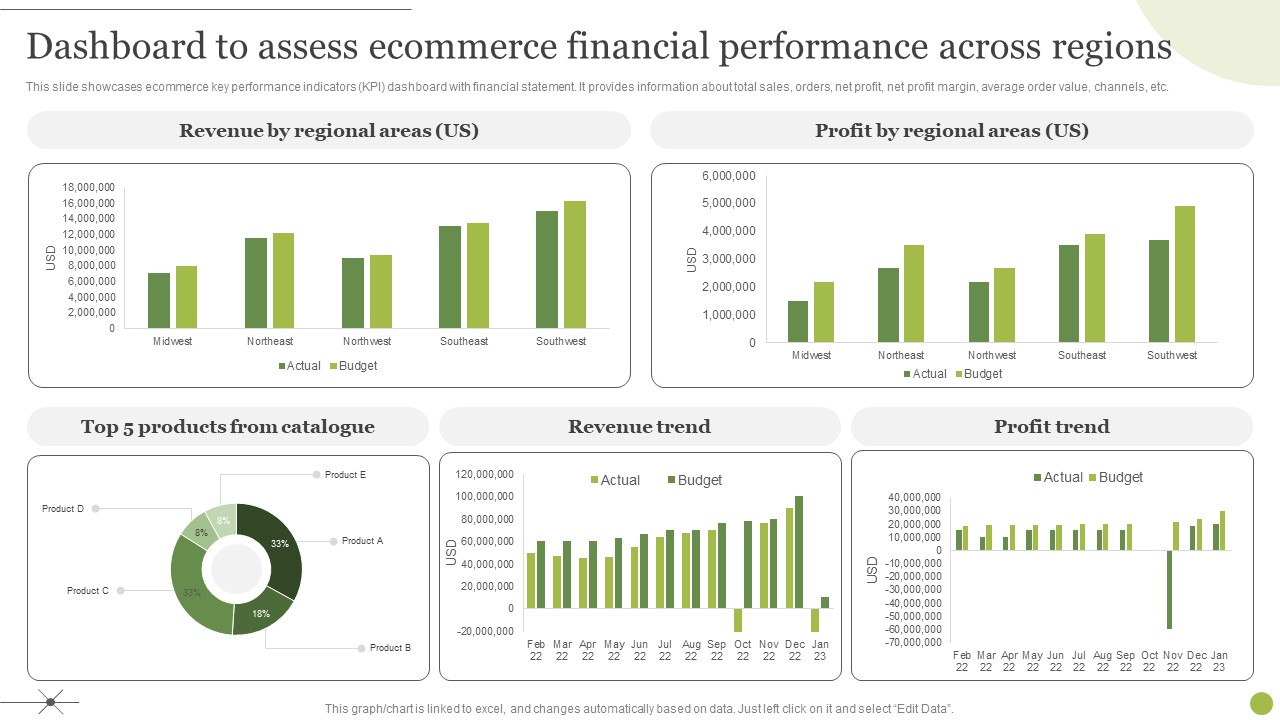
Dashboard To Assess Ecommerce Financial Performance Across Regions Infographics PDF
This slide showcases ecommerce key performance indicators KPI dashboard with financial statement. It provides information about total sales, orders, net profit, net profit margin, average order value, channels, etc.Here you can discover an assortment of the finest PowerPoint and Google Slides templates. With these templates, you can create presentations for a variety of purposes while simultaneously providing your audience with an eye-catching visual experience. Download Dashboard To Assess Ecommerce Financial Performance Across Regions Infographics PDF to deliver an impeccable presentation. These templates will make your job of preparing presentations much quicker, yet still, maintain a high level of quality. Slidegeeks has experienced researchers who prepare these templates and write high-quality content for you. Later on, you can personalize the content by editing the Dashboard To Assess Ecommerce Financial Performance Across Regions Infographics PDF.
-
How Electronic Commerce Financial Procedure Can Be Enhanced Dashboard Indicating Online Store Pictures PDF
The following slide showcases ecommerce accounts management dashboard. It provides information about income, expenses, cash collected, cash spent, tax collected, tax claim, stock sold, invoice, etc.Do you know about Slidesgeeks How Electronic Commerce Financial Procedure Can Be Enhanced Dashboard Indicating Online Store Pictures PDF These are perfect for delivering any kind od presentation. Using it, create PowerPoint presentations that communicate your ideas and engage audiences. Save time and effort by using our pre-designed presentation templates that are perfect for a wide range of topic. Our vast selection of designs covers a range of styles, from creative to business, and are all highly customizable and easy to edit. Download as a PowerPoint template or use them as Google Slides themes.
-
How Electronic Commerce Financial Procedure Can Be Enhanced Ecommerce Kpi Dashboard Slides PDF
This slide showcases ecommerce key performance indicators KPI dashboard with financial statement. It provides information about total sales, orders, net profit, net profit margin, average order value, channels, etc.Create an editable How Electronic Commerce Financial Procedure Can Be Enhanced Ecommerce Kpi Dashboard Slides PDF that communicates your idea and engages your audience. Whether you are presenting a business or an educational presentation, pre-designed presentation templates help save time. How Electronic Commerce Financial Procedure Can Be Enhanced Ecommerce Kpi Dashboard Slides PDF is highly customizable and very easy to edit, covering many different styles from creative to business presentations. Slidegeeks has creative team members who have crafted amazing templates. So, go and get them without any delay.
-
Managing E Commerce Business Accounting Dashboard To Assess Ecommerce Financial Performance Across Regions Graphics PDF
This slide showcases ecommerce key performance indicators KPI dashboard with financial statement. It provides information about total sales, orders, net profit, net profit margin, average order value, channels, etc. Do you have to make sure that everyone on your team knows about any specific topic I yes, then you should give Managing E Commerce Business Accounting Dashboard To Assess Ecommerce Financial Performance Across Regions Graphics PDF a try. Our experts have put a lot of knowledge and effort into creating this impeccable Managing E Commerce Business Accounting Dashboard To Assess Ecommerce Financial Performance Across Regions Graphics PDF. You can use this template for your upcoming presentations, as the slides are perfect to represent even the tiniest detail. You can download these templates from the Slidegeeks website and these are easy to edit. So grab these today.
-
KPI Dashboard To Track Financial Performance Of Company Management Clipart PDF
This slide shows the KPI dashboard of revenue and profit quarterly performance of business. It also includes quarterly productivity performance. Pitch your topic with ease and precision using this KPI Dashboard To Track Financial Performance Of Company Management Clipart PDF. This layout presents information on Revenue, Productivity, Profit. It is also available for immediate download and adjustment. So, changes can be made in the color, design, graphics or any other component to create a unique layout.
-
Financial KPI Dashboard With Liquidity Ratio Analysis And Current Assets Breakdown Ideas PDF
This showcases KPI dashboard the can help organization to evaluate the financial performance and analyze the liquidity ratios. Its key components are vendor payment error rate, budget variance and cash conversion cycle. Showcasing this set of slides titled. The topics addressed in these templates are Quick Status, Workning Capital, Budget Variance. All the content presented in this PPT design is completely editable. Download it and make adjustments in color, background, font etc. as per your unique business setting.
-
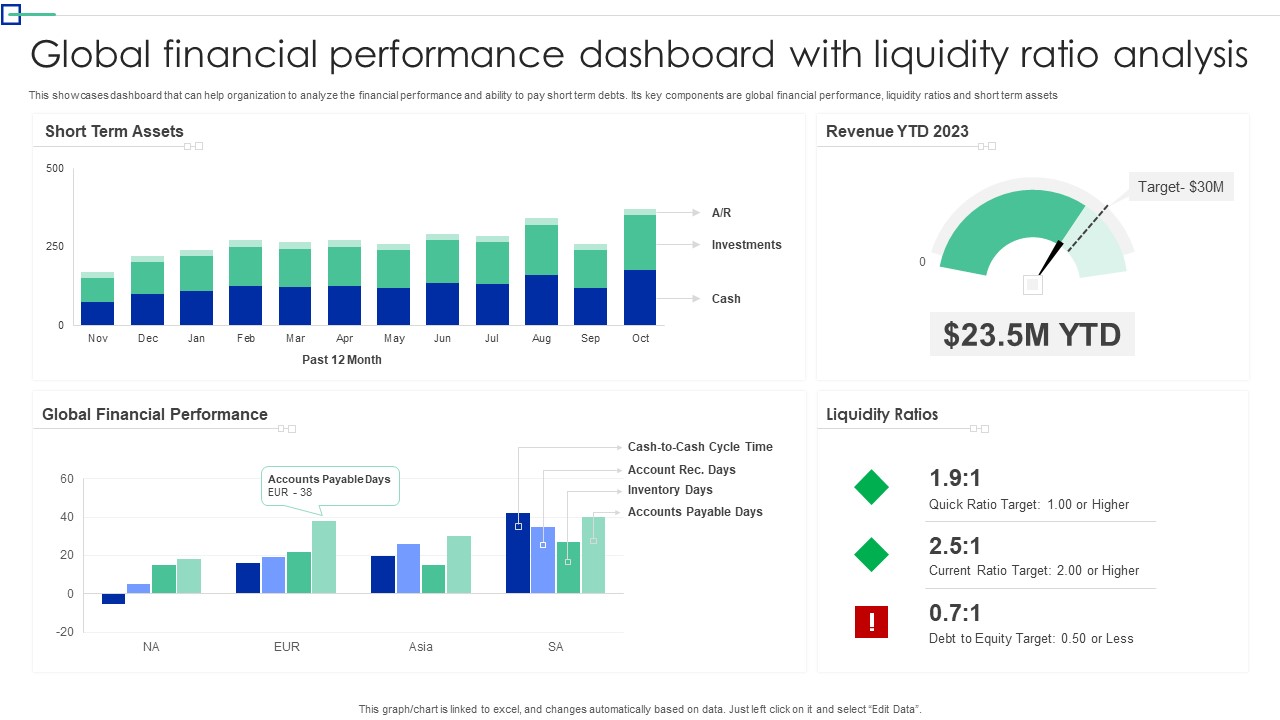
Global Financial Performance Dashboard With Liquidity Ratio Analysis Information PDF
This showcases dashboard that can help organization to analyze the financial performance and ability to pay short term debts. Its key components are global financial performance, liquidity ratios and short term assets. Pitch your topic with ease and precision using this Global Financial Performance Dashboard With Liquidity Ratio Analysis Information PDF. This layout presents information on Short Term Assets, Global Financial Performance, Liquidity Ratios. It is also available for immediate download and adjustment. So, changes can be made in the color, design, graphics or any other component to create a unique layout.
-
Department Salary Management Dashboard With Financial Summary Portrait PDF
The following slide highlights the department payroll management dashboard with financial summary illustrating key headings which includes company name, department name, payroll period, net pay employees, payment mode, net cash, employee tax and employer tax. Showcasing this set of slides titled Department Salary Management Dashboard With Financial Summary Portrait PDF. The topics addressed in these templates are Sales Department, Employee Tax, Financial Summary. All the content presented in this PPT design is completely editable. Download it and make adjustments in color, background, font etc. as per your unique business setting.
-
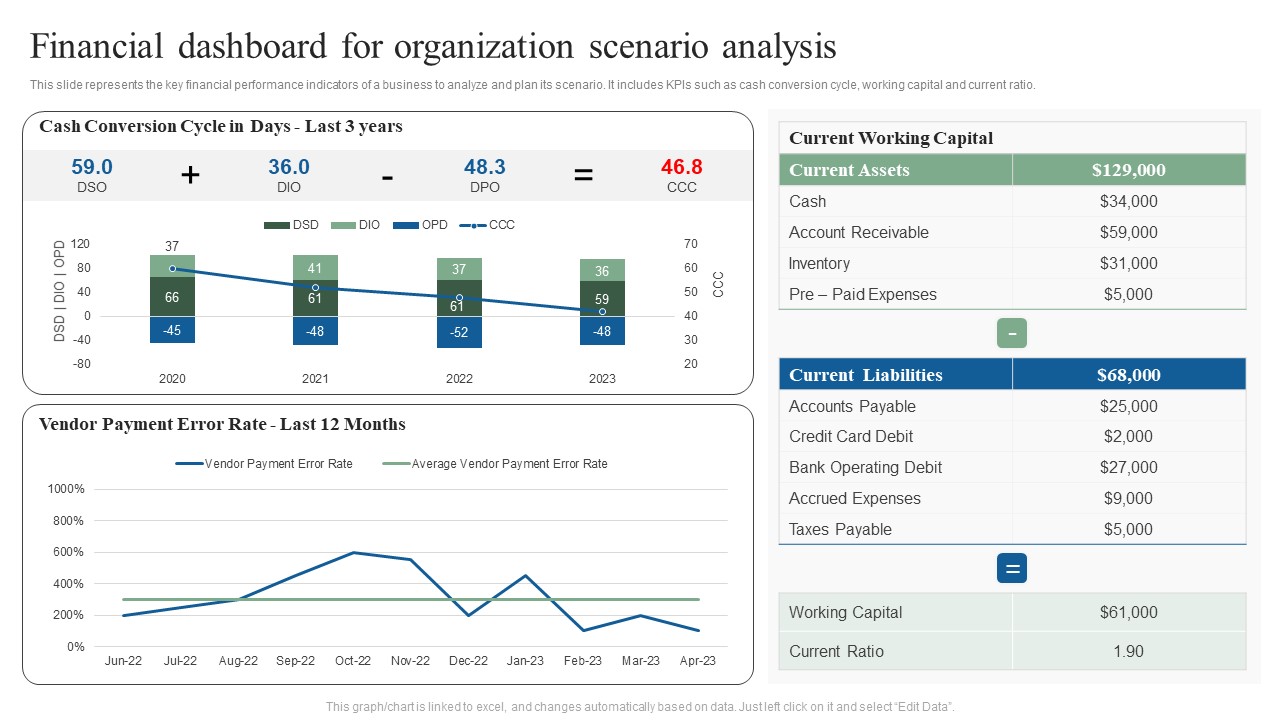
Financial Dashboard For Organization Scenario Analysis Ppt Show Ideas PDF
This slide represents the key financial performance indicators of a business to analyze and plan its scenario. It includes KPIs such as cash conversion cycle, working capital and current ratio. Showcasing this set of slides titled Financial Dashboard For Organization Scenario Analysis Ppt Show Ideas PDF. The topics addressed in these templates are Current Working Capital, Current Liabilities, Current Assets. All the content presented in this PPT design is completely editable. Download it and make adjustments in color, background, font etc. as per your unique business setting.
-
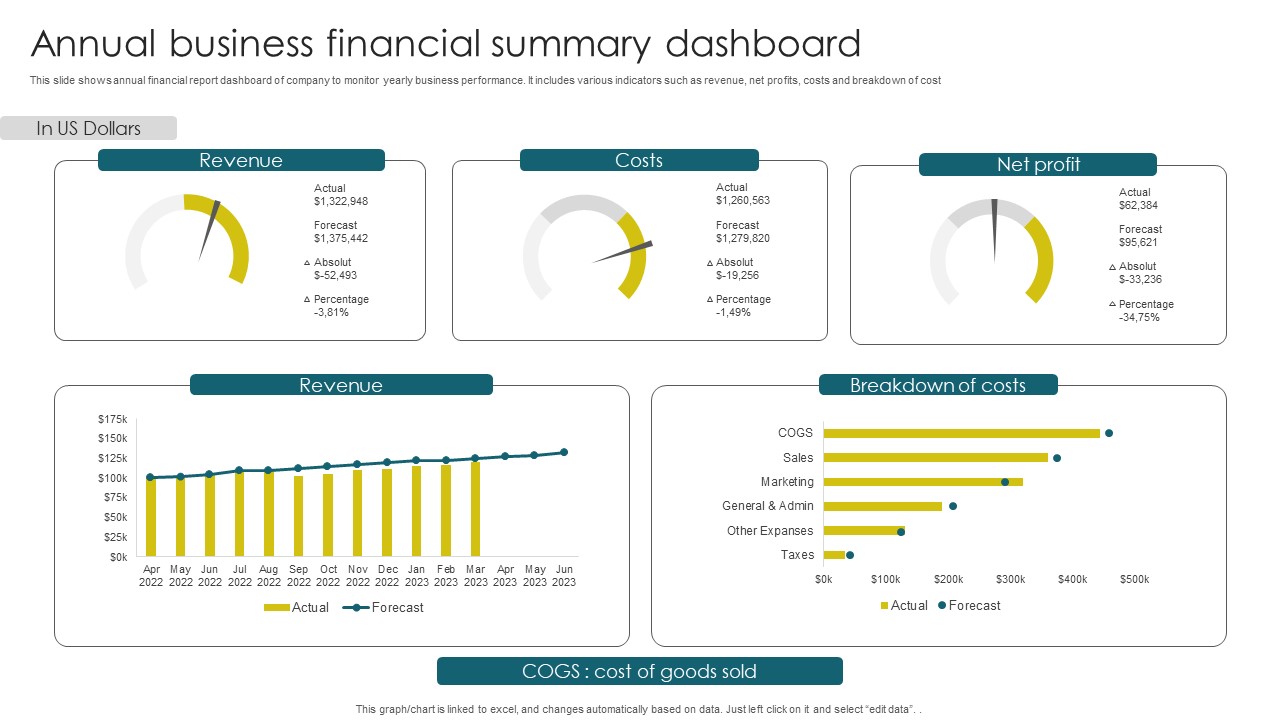
Annual Business Financial Summary Dashboard Themes PDF
This slide shows annual financial report dashboard of company to monitor yearly business performance. It includes various indicators such as revenue, net profits, costs and breakdown of cost. Showcasing this set of slides titled Annual Business Financial Summary Dashboard Themes PDF. The topics addressed in these templates are Revenue, Costs, Net Profit. All the content presented in this PPT design is completely editable. Download it and make adjustments in color, background, font etc. as per your unique business setting.
-
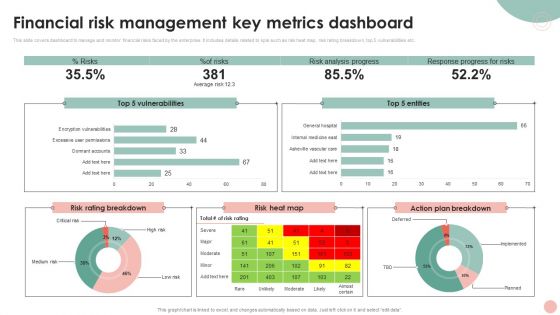
Company Risk Assessment Plan Financial Risk Management Key Metrics Dashboard Brochure PDF
This slide covers dashboard to manage and monitor financial risks faced by the enterprise. It includes details related to kpis such as risk heat map, risk rating breakdown, top 5 vulnerabilities etc. Crafting an eye catching presentation has never been more straightforward. Let your presentation shine with this tasteful yet straight forward Company Risk Assessment Plan Financial Risk Management Key Metrics Dashboard Brochure PDF template. It offers a minimalistic and classy look that is great for making a statement. The colors have been employed intelligently to add a bit of playfulness while still remaining professional. Construct the ideal Company Risk Assessment Plan Financial Risk Management Key Metrics Dashboard Brochure PDF that effortlessly grabs the attention of your audience. Begin now and be certain to wow your customers.
-
Dashboard To Assess Ecommerce Financial Performance Across Regions Themes PDF
This slide showcases ecommerce key performance indicators KPI dashboard with financial statement. It provides information about total sales, orders, net profit, net profit margin, average order value, channels, etc. Here you can discover an assortment of the finest PowerPoint and Google Slides templates. With these templates, you can create presentations for a variety of purposes while simultaneously providing your audience with an eye catching visual experience. Download Dashboard To Assess Ecommerce Financial Performance Across Regions Themes PDF to deliver an impeccable presentation. These templates will make your job of preparing presentations much quicker, yet still, maintain a high level of quality. Slidegeeks has experienced researchers who prepare these templates and write high quality content for you. Later on, you can personalize the content by editing the Dashboard To Assess Ecommerce Financial Performance Across Regions Themes PDF.

 Home
Home 


