Data Analytics For Informed Decision Making Ppt Sample
Our Data Analytics For Informed Decision Making Ppt Sample are topically designed to provide an attractive backdrop to any subject. Use them to look like a presentation pro.
- Google Slides is a new FREE Presentation software from Google.
- All our content is 100% compatible with Google Slides.
- Just download our designs, and upload them to Google Slides and they will work automatically.
- Amaze your audience with SlideGeeks and Google Slides.
-
Want Changes to This PPT Slide? Check out our Presentation Design Services
- WideScreen Aspect ratio is becoming a very popular format. When you download this product, the downloaded ZIP will contain this product in both standard and widescreen format.
-

- Some older products that we have may only be in standard format, but they can easily be converted to widescreen.
- To do this, please open the SlideGeeks product in Powerpoint, and go to
- Design ( On the top bar) -> Page Setup -> and select "On-screen Show (16:9)” in the drop down for "Slides Sized for".
- The slide or theme will change to widescreen, and all graphics will adjust automatically. You can similarly convert our content to any other desired screen aspect ratio.
Compatible With Google Slides

Get This In WideScreen
You must be logged in to download this presentation.
 Impress Your
 Audience
 100%
100% Editable
Google Slides
Features of these PowerPoint presentation slides:
People who downloaded this PowerPoint presentation also viewed the following :
Content of this Powerpoint Presentation
Slide 1: This slide introduces Data Analytics for Informed Decision-Making.
Slide 2: This slide states Agenda of the presentation.
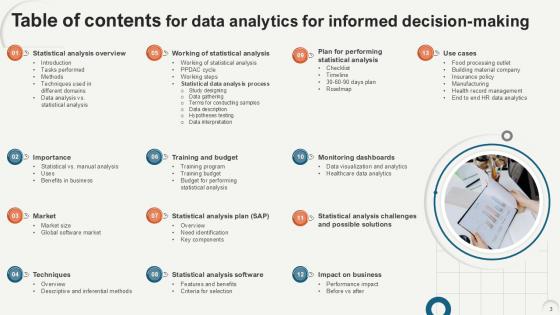
Slide 3: This slide shows Table of Content for the presentation.
Slide 4: This slide highlights title for topics that are to be covered next in the template.
Slide 5: The purpose of this slide is to discuss the statistical data analysis.
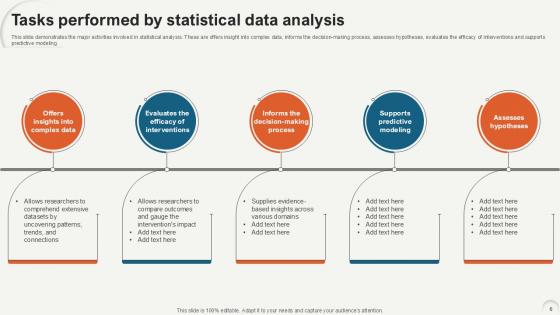
Slide 6: This slide demonstrates the major activities involved in statistical analysis.
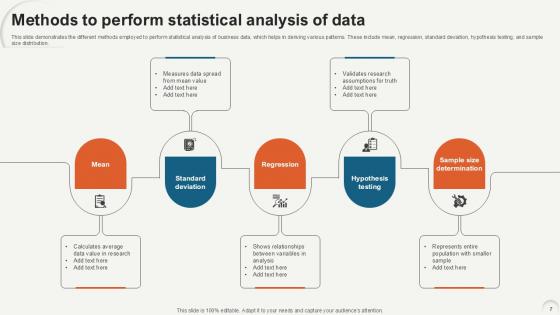
Slide 7: This slide demonstrates the different methods employed to perform statistical analysis of business data, which helps in deriving various patterns.
Slide 8: This slide outlines the statistical and data analysis methods applied in different fields.
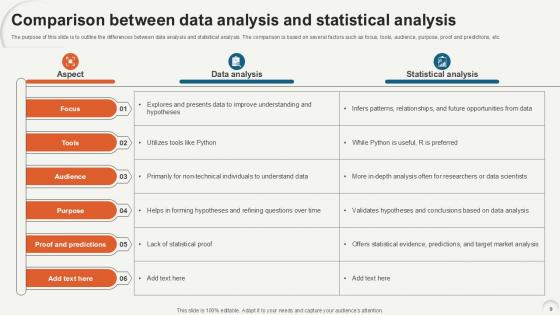
Slide 9: The purpose of this slide is to outline the differences between data analysis and statistical analysis.
Slide 10: This slide highlights title for topics that are to be covered next in the template.
Slide 11: This slide highlights the drawbacks of manual analysis process.
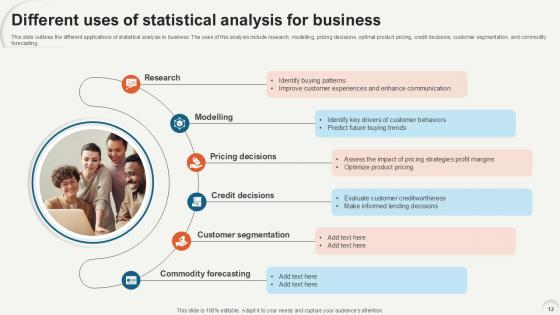
Slide 12: This slide outlines the different applications of statistical analysis in business.
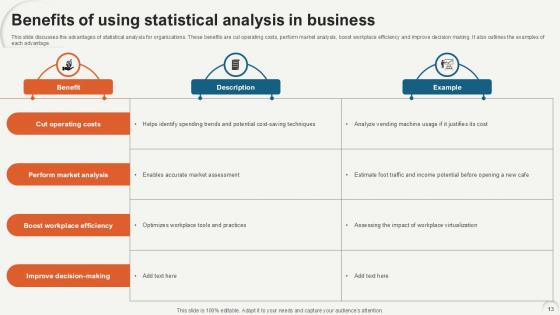
Slide 13: This slide discusses the advantages of statistical analysis for organizations.
Slide 14: This slide highlights title for topics that are to be covered next in the template.
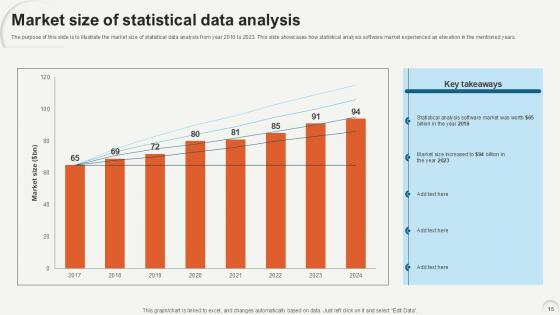
Slide 15: The purpose of this slide is to illustrate the market size of statistical data analysis from year 2016 to 2023.
Slide 16: This slide depicts the forecast value of statistical analysis software market.
Slide 17: This slide highlights title for topics that are to be covered next in the template.
Slide 18: This slide outlines the various types of statistical analysis.
Slide 19: The purpose of this slide is to outline the various methods of performing statistical analysis and their key focus.
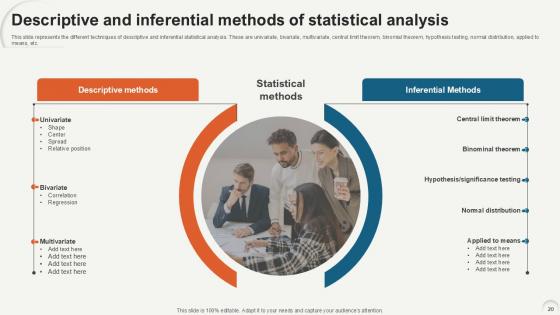
Slide 20: This slide represents the different techniques of descriptive and inferential statistical analysis.
Slide 21: This slide highlights title for topics that are to be covered next in the template.
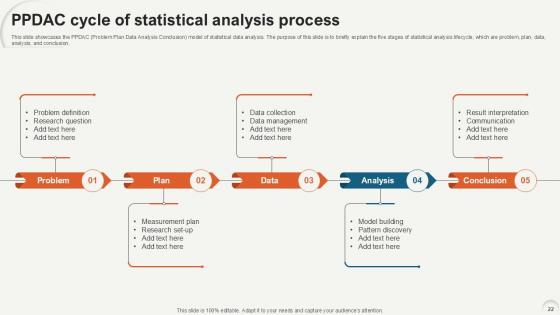
Slide 22: This slide showcases the PPDAC (Problem Plan Data Analysis Conclusion) model of statistical data analysis.
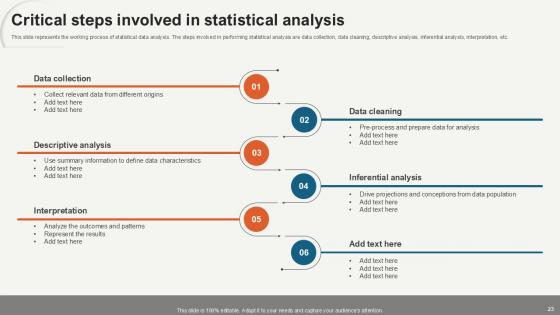
Slide 23: This slide represents the working process of statistical data analysis.
Slide 24: This slide highlights title for topics that are to be covered next in the template.
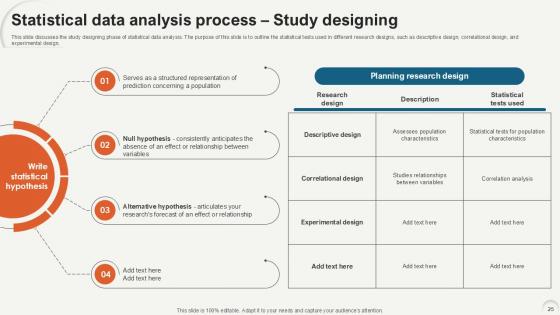
Slide 25: This slide discusses the study designing phase of statistical data analysis.
Slide 26: This slide discusses the data-gathering phase of the statistical data analysis process.
Slide 27: The purpose of this slide is to outline the statistical measures involved in sampling data for analytical processes.
Slide 28: This slide discusses the data description phase of statistical analysis, which includes methods such as scatter plot, bar chart, frequency distribution, etc.
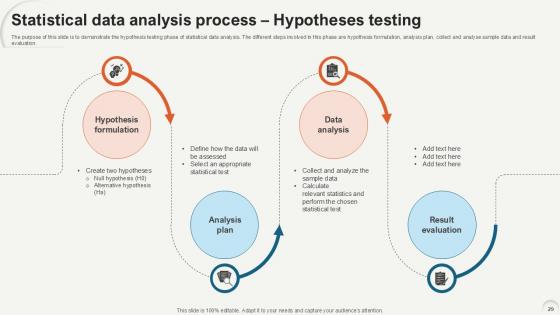
Slide 29: The purpose of this slide is to demonstrate the hypothesis testing phase of statistical data analysis.
Slide 30: This slide represents the data interpretation phase of statistical analysis.
Slide 31: This slide highlights title for topics that are to be covered next in the template.
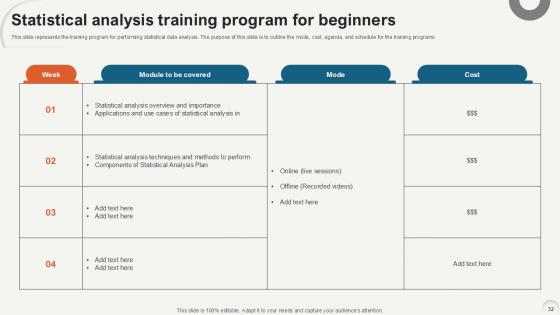
Slide 32: This slide represents the training program for performing statistical data analysis.
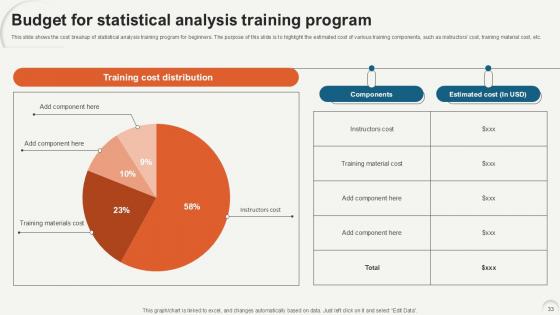
Slide 33: This slide shows the cost breakup of statistical analysis training program for beginners.
Slide 34: This slide outlines the different costs involved in conducting statistical data analysis.
Slide 35: This slide highlights title for topics that are to be covered next in the template.
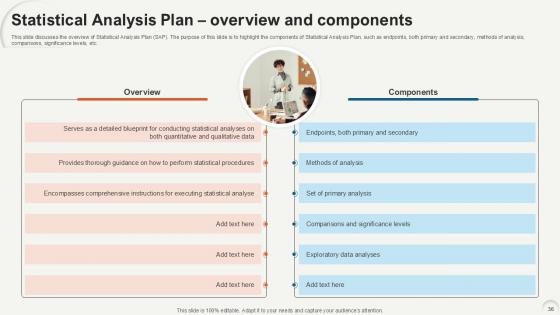
Slide 36: This slide discusses the overview of Statistical Analysis Plan (SAP).
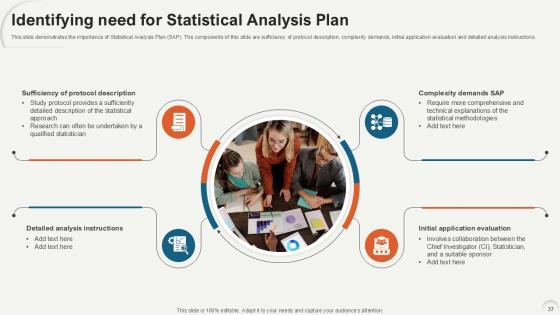
Slide 37: This slide demonstrates the importance of Statistical Analysis Plan (SAP).
Slide 38: This slide outlines the various sections of Statistical Analysis Plan (SAP).
Slide 39: This slide highlights title for topics that are to be covered next in the template.
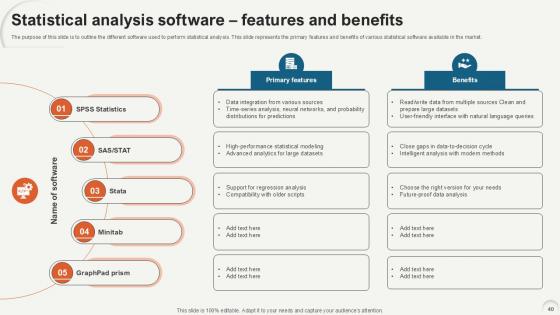
Slide 40: The purpose of this slide is to outline the different software used to perform statistical analysis.
Slide 41: This slide represents the features and cost of various statistical analysis software available in the market.
Slide 42: This slide highlights title for topics that are to be covered next in the template.
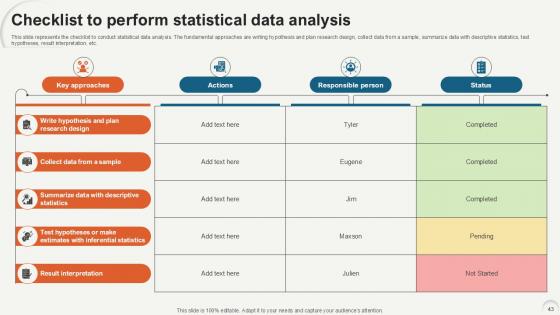
Slide 43: This slide represents the checklist to conduct statistical data analysis.
Slide 44: This slide shows the timeline for performing statistical data analysis.
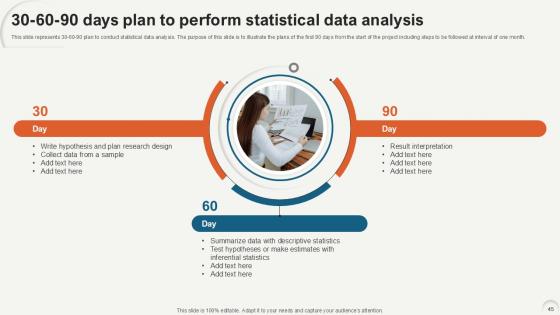
Slide 45: This slide represents 30-60-90 plan to conduct statistical data analysis.
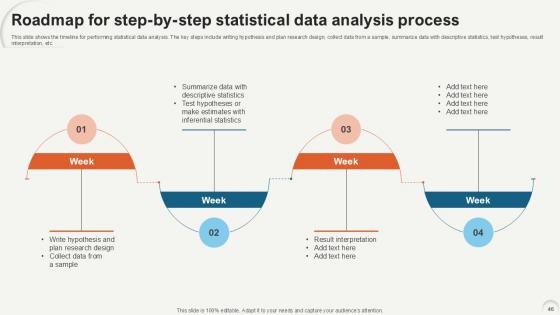
Slide 46: This slide shows the timeline for performing statistical data analysis.
Slide 47: This slide highlights title for topics that are to be covered next in the template.
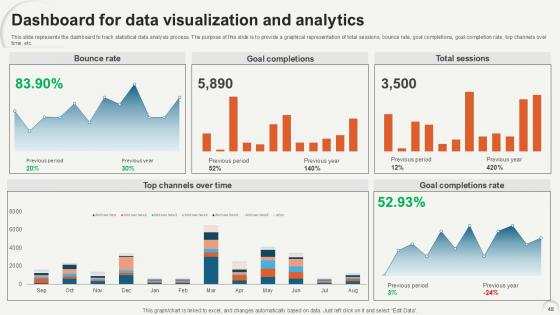
Slide 48: This slide represents the dashboard to track statistical data analysis process.
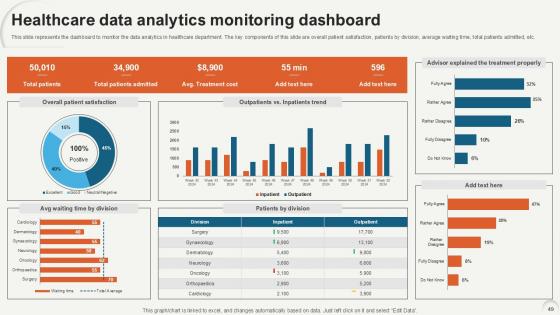
Slide 49: This slide represents the dashboard to monitor the data analytics in healthcare department.
Slide 50: This slide highlights title for topics that are to be covered next in the template.
Slide 51: The purpose of this slide is to discuss the limitations of statistical analysis and their possible solutions.
Slide 52: This slide highlights title for topics that are to be covered next in the template.
Slide 53: This slide illustrates the business impact of performing statistical analysis.
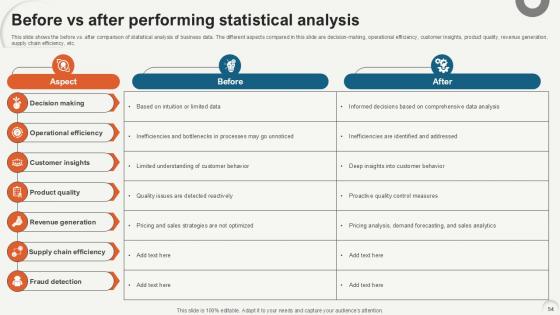
Slide 54: This slide shows the before vs. after comparison of statistical analysis of business data.
Slide 55: This slide highlights title for topics that are to be covered next in the template.
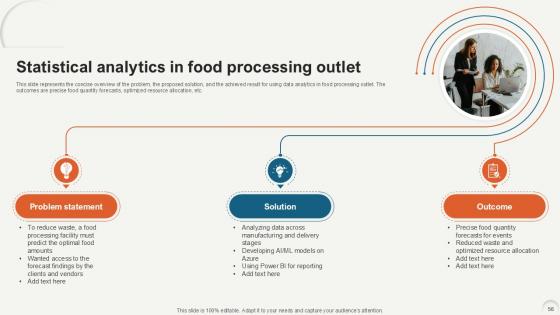
Slide 56: This slide represents the concise overview of the problem, the proposed solution, and the achieved result for using data analytics in food processing outlet.
Slide 57: This slide represents the concise overview of the problem, the proposed solution, and the achieved result for using data analytics in building material manufacturing company.
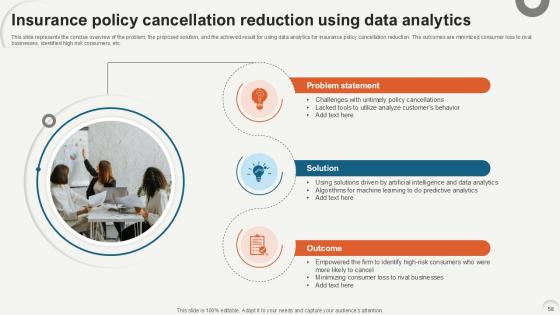
Slide 58: This slide represents the concise overview of the problem, the proposed solution, and the achieved result for using data analytics for insurance policy cancellation reduction.
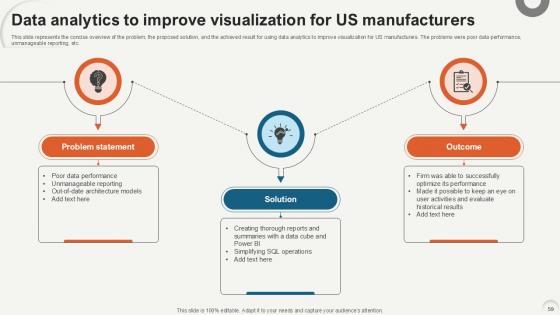
Slide 59: This slide represents the concise overview of the problem, the proposed solution, and the achieved result for using data analytics to improve visualization for US manufacturers.
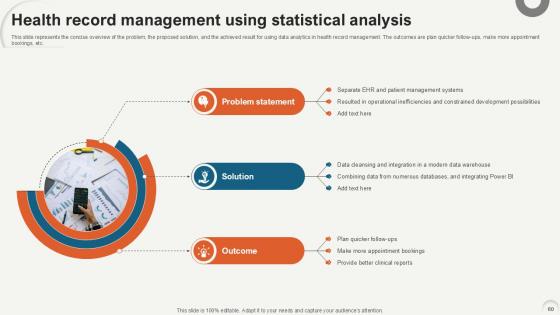
Slide 60: This slide represents the concise overview of the problem, the proposed solution, and the achieved result for using data analytics in health record management.
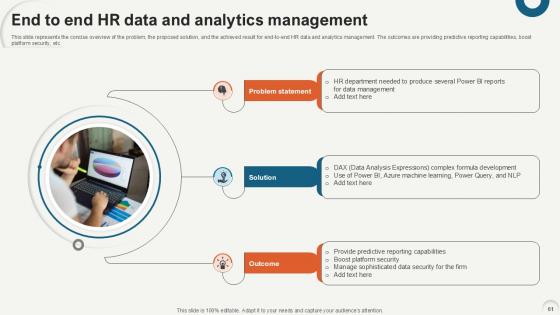
Slide 61: This slide represents the concise overview of the problem, the proposed solution, and the achieved result for end-to-end HR data and analytics management.
Slide 62: This slide contains all the icons used in this presentation.
Slide 63: This slide is titled as Additional Slides for moving forward.
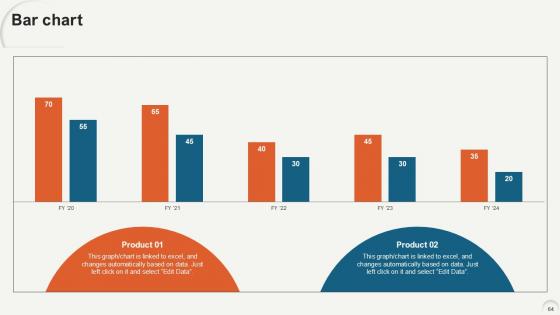
Slide 64: This slide presents Bar chart with two products comparison.
Slide 65: This is a Timeline slide. Show data related to time intervals here.
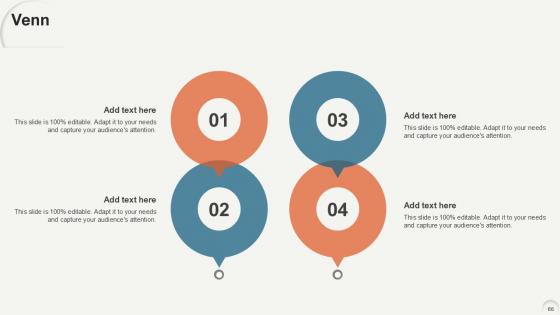
Slide 66: This slide depicts Venn diagram with text boxes.
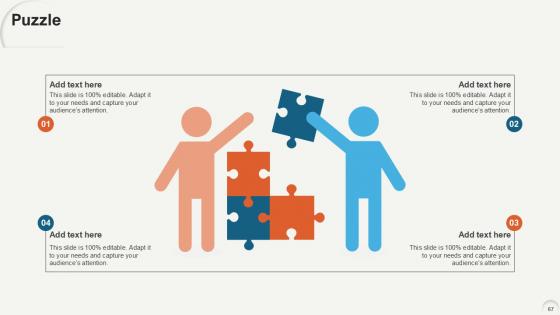
Slide 67: This slide contains Puzzle with related icons and text.
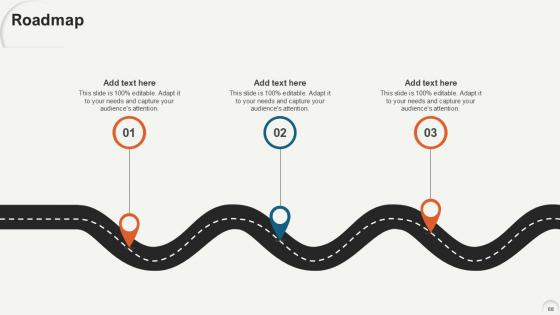
Slide 68: This slide presents Roadmap with additional textboxes.
Slide 69: This is a Thank You slide with address, contact numbers and email address.
Data Analytics For Informed Decision Making Ppt Sample with all 77 slides:
Use our Data Analytics For Informed Decision Making Ppt Sample to effectively help you save your valuable time. They are readymade to fit into any presentation structure.
Most Relevant Reviews
-
Easy to edit slides with easy to understand instructions.
-
It saves your time and decrease your efforts in half.

 Home
Home 