Dashboard For Data Visualization Data Analytics For Informed Decision Ppt Sample
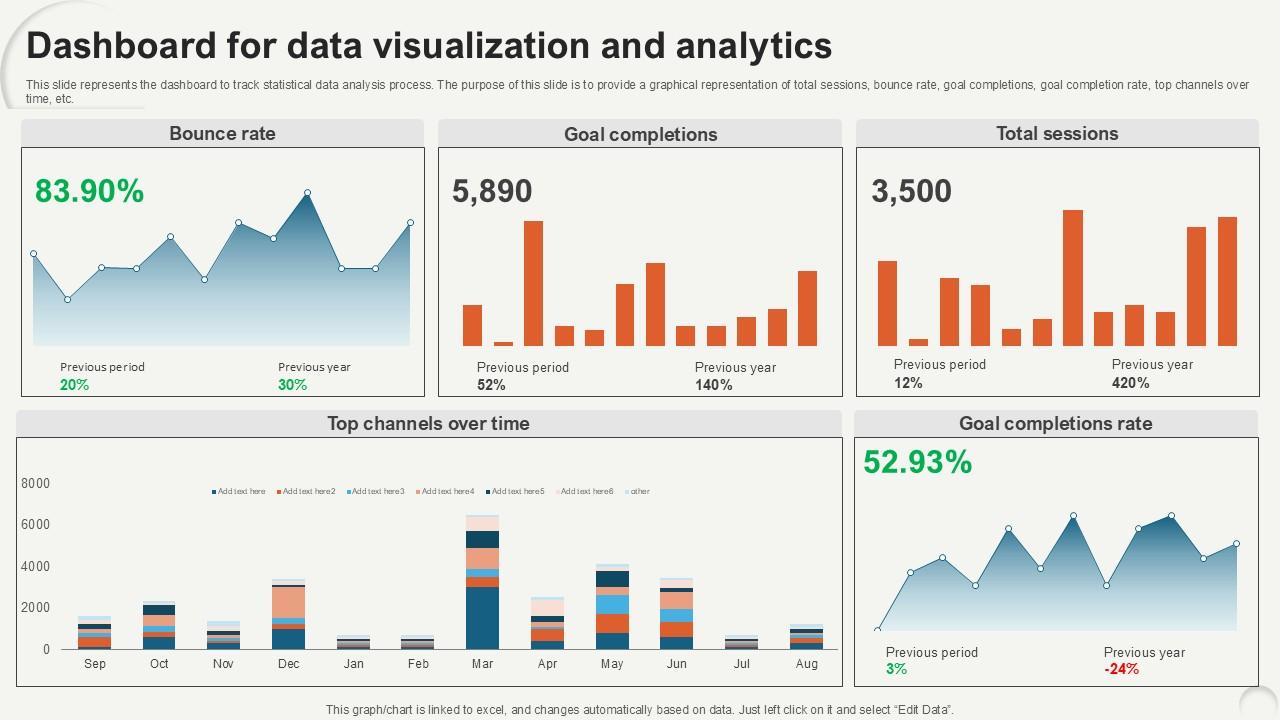
This slide represents the dashboard to track statistical data analysis process. The purpose of this slide is to provide a graphical representation of total sessions, bounce rate, goal completions, goal completion rate, top channels over time, etc.
- Google Slides is a new FREE Presentation software from Google.
- All our content is 100% compatible with Google Slides.
- Just download our designs, and upload them to Google Slides and they will work automatically.
- Amaze your audience with SlideGeeks and Google Slides.
-
Want Changes to This PPT Slide? Check out our Presentation Design Services
- WideScreen Aspect ratio is becoming a very popular format. When you download this product, the downloaded ZIP will contain this product in both standard and widescreen format.
-

- Some older products that we have may only be in standard format, but they can easily be converted to widescreen.
- To do this, please open the SlideGeeks product in Powerpoint, and go to
- Design ( On the top bar) -> Page Setup -> and select "On-screen Show (16:9)” in the drop down for "Slides Sized for".
- The slide or theme will change to widescreen, and all graphics will adjust automatically. You can similarly convert our content to any other desired screen aspect ratio.
Compatible With Google Slides

Get This In WideScreen
You must be logged in to download this presentation.
 Impress Your
 Audience
 100%
100% Editable
Google Slides
Features of these PowerPoint presentation slides:
This slide represents the dashboard to track statistical data analysis process. The purpose of this slide is to provide a graphical representation of total sessions, bounce rate, goal completions, goal completion rate, top channels over time, etc. Do you have an important presentation coming up Are you looking for something that will make your presentation stand out from the rest Look no further than Dashboard For Data Visualization Data Analytics For Informed Decision Ppt Sample. With our professional designs, you can trust that your presentation will pop and make delivering it a smooth process. And with Slidegeeks, you can trust that your presentation will be unique and memorable. So why wait Grab Dashboard For Data Visualization Data Analytics For Informed Decision Ppt Sample today and make your presentation stand out from the rest This slide represents the dashboard to track statistical data analysis process. The purpose of this slide is to provide a graphical representation of total sessions, bounce rate, goal completions, goal completion rate, top channels over time, etc.
People who downloaded this PowerPoint presentation also viewed the following :
Dashboard For Data Visualization Data Analytics For Informed Decision Ppt Sample with all 10 slides:
Use our Dashboard For Data Visualization Data Analytics For Informed Decision Ppt Sample to effectively help you save your valuable time. They are readymade to fit into any presentation structure.
Most Relevant Reviews
-
Very unique, user-friendly presentation interface.
-
Excellent work done on template design and graphics.

 Home
Home 


