Charts and Graphs
-
Real Estate Development Project Financing KPI Dashboard To Monitor Project Status Themes PDF
Following slide illustrates KPI dashboard for monitoring the project performance. KPIs covered in the dashboard are project progress task status, project health and project timeline.Deliver and pitch your topic in the best possible manner with this Real Estate Development Project Financing KPI Dashboard To Monitor Project Status Themes PDF. Use them to share invaluable insights on Management Dashboard, Project Progress, Resource Plan and impress your audience. This template can be altered and modified as per your expectations. So, grab it now.
-
Project Planner Ppt PowerPoint Presentation Professional
This is a project planner ppt powerpoint presentation professional. This is a two stage process. The stages in this process are plan, act.
-
Assessment Of Fixed Assets Fixed Asset Dashboard Download PDF
Presenting this set of slides with name assessment of fixed assets fixed asset dashboard download pdf. The topics discussed in these slides are cost, value, original, fixed asset. This is a completely editable PowerPoint presentation and is available for immediate download. Download now and impress your audience.
-
Dashboard Of Net Promoter Score Survey Response Results KPI Portrait PDF
Pitch your topic with ease and precision using this Dashboard Of Net Promoter Score Survey Response Results KPI Portrait PDF. This layout presents information on Product Average, Promoter Score, Product Experience. It is also available for immediate download and adjustment. So, changes can be made in the color, design, graphics or any other component to create a unique layout.
-
Planning For Future Workforce Needs Ppt PowerPoint Presentation Outline Templates
This is a planning for future workforce needs ppt powerpoint presentation outline templates. This is a seven stage process. The stages in this process are total new hires needed, planning, business, marketing, success.
-
Firm KPI Dashboard With Program Progress Report Ppt Pictures Deck PDF
This graph or chart is linked to excel, and changes automatically based on data. Just left click on it and select Edit Data. Showcasing this set of slides titled Firm KPI Dashboard With Program Progress Report Ppt Pictures Deck PDF. The topics addressed in these templates are Budget By Employee, Total Budget, 3 Overdue Tasks, Workload. All the content presented in this PPT design is completely editable. Download it and make adjustments in color, background, font etc. as per your unique business setting.
-
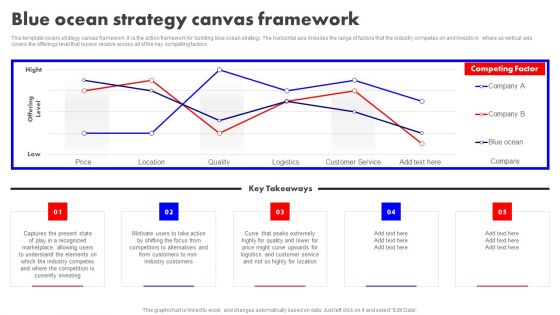
Detailed Analysis Of Red Ocean Vs Blue Ocean Approach Blue Ocean Strategy Canvas Framework Sample PDF
This template covers strategy canvas framework. It is the action framework for building blue ocean strategy. The horizontal axis includes the range of factors that the industry competes on and invests in , where as vertical axis covers the offerings level that buyers receive across all of the key competing factors. Whether you have daily or monthly meetings, a brilliant presentation is necessary. Detailed Analysis Of Red Ocean Vs Blue Ocean Approach Blue Ocean Strategy Canvas Framework Sample PDF can be your best option for delivering a presentation. Represent everything in detail using Detailed Analysis Of Red Ocean Vs Blue Ocean Approach Blue Ocean Strategy Canvas Framework Sample PDF and make yourself stand out in meetings. The template is versatile and follows a structure that will cater to your requirements. All the templates prepared by Slidegeeks are easy to download and edit. Our research experts have taken care of the corporate themes as well. So, give it a try and see the results.
-
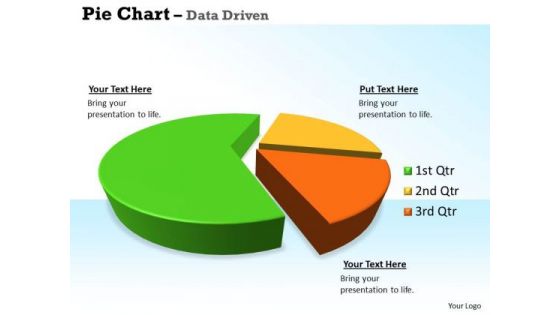
Quantitative Data Analysis 3d Pie Chart For Business Statistics PowerPoint Templates
Our quantitative data analysis 3d pie chart for business statistics Powerpoint Templates Allow You To Do It With Ease. Just Like Picking The Low Hanging Fruit.
-
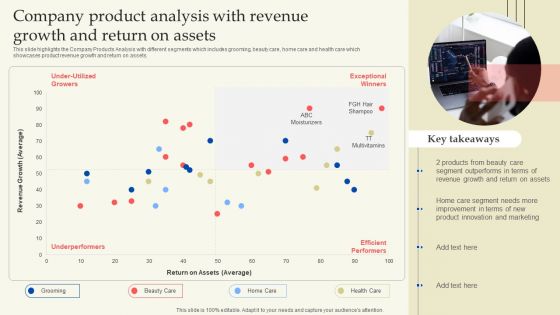
Company Product Analysis With Revenue Growth And Return On Assets Portrait PDF
This slide highlights the Company Products Analysis with different segments which includes grooming, beauty care, home care and health care which showcases product revenue growth and return on assets. Here you can discover an assortment of the finest PowerPoint and Google Slides templates. With these templates, you can create presentations for a variety of purposes while simultaneously providing your audience with an eye catching visual experience. Download Company Product Analysis With Revenue Growth And Return On Assets Portrait PDF to deliver an impeccable presentation. These templates will make your job of preparing presentations much quicker, yet still, maintain a high level of quality. Slidegeeks has experienced researchers who prepare these templates and write high quality content for you. Later on, you can personalize the content by editing the Company Product Analysis With Revenue Growth And Return On Assets Portrait PDF.
-
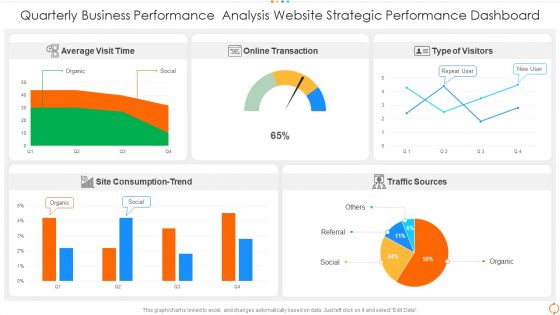
Quarterly Business Performance Analysis Website Strategic Performance Dashboard Portrait PDF
Pitch your topic with ease and precision using this quarterly business performance analysis website strategic performance dashboard portrait pdf. This layout presents information on quarterly business performance analysis website strategic performance dashboard. It is also available for immediate download and adjustment. So, changes can be made in the color, design, graphics or any other component to create a unique layout.
-
Cyber Security Cases Action Plan Risk Tracking Dashboard For Response Ppt PowerPoint Presentation File Graphics Example PDF
This slide highlights dashboard to identify and track security threats occurred in the company. The purpose of this template is to provide information to the management about severities of the incidents along with risk rating in form of heat map. Showcasing this set of slides titled Cyber Security Cases Action Plan Risk Tracking Dashboard For Response Ppt PowerPoint Presentation File Graphics Example PDF. The topics addressed in these templates are Risk Heat Map, Action Plan Breakdown, Risk Rating Breakdown. All the content presented in this PPT design is completely editable. Download it and make adjustments in color, background, font etc. as per your unique business setting.
-
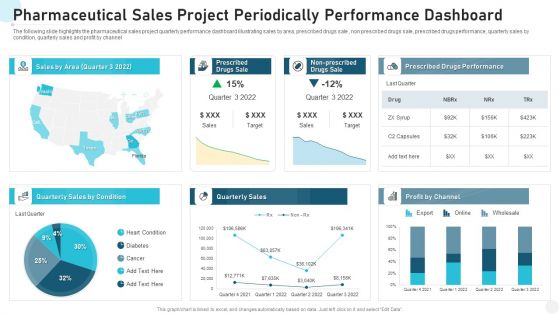
Pharmaceutical Sales Project Periodically Performance Dashboard Brochure PDF
The following slide highlights the pharmaceutical sales project quarterly performance dashboard illustrating sales by area, prescribed drugs sale , non prescribed drugs sale, prescribed drugs performance, quarterly sales by condition, quarterly sales and profit by channel Showcasing this set of slides titled pharmaceutical sales project periodically performance dashboard brochure pdf. The topics addressed in these templates are pharmaceutical sales project periodically performance dashboard. All the content presented in this PPT design is completely editable. Download it and make adjustments in color, background, font etc. as per your unique business setting.
-
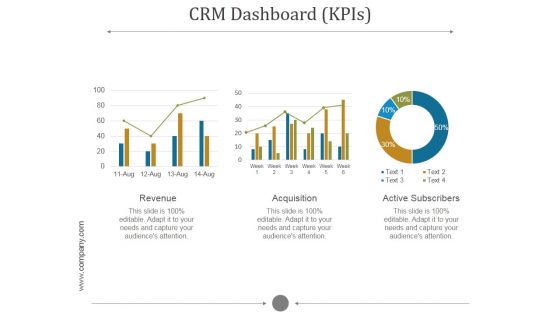
Crm Dashboard Kpis Ppt PowerPoint Presentation Pictures
This is a crm dashboard kpis ppt powerpoint presentation pictures. This is a five stage process. The stages in this process are revenue, acquisition, active subscribers.
-
Top Customer Issues In Todays Healthcare Industry Elements PDF
This slide has showcased top Customer Issues in todays healthcare which can be referred by health services industry to cater various needs of customer to boost their revenues. It contains information about insurance expenses and prices, provider pricing in health tests and affording and payment for services. Showcasing this set of slides titled top customer issues in todays healthcare industry elements pdf. The topics addressed in these templates are top customer issues in todays healthcare industry. All the content presented in this PPT design is completely editable. Download it and make adjustments in color, background, font etc. as per your unique business setting.
-
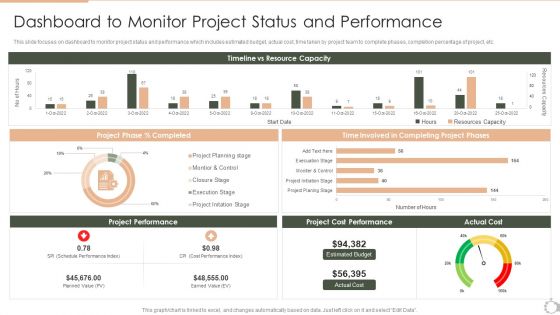
Project Time Management Execution Strategies Dashboard To Monitor Project Status And Performance Summary PDF
This slide focuses on dashboard to monitor project status and performance which includes estimated budget, actual cost, time taken by project team to complete phases, completion percentage of project, etc. If you are looking for a format to display your unique thoughts, then the professionally designed Project Time Management Execution Strategies Dashboard To Monitor Project Status And Performance Summary PDF is the one for you. You can use it as a Google Slides template or a PowerPoint template. Incorporate impressive visuals, symbols, images, and other charts. Modify or reorganize the text boxes as you desire. Experiment with shade schemes and font pairings. Alter, share or cooperate with other people on your work. Download Project Time Management Execution Strategies Dashboard To Monitor Project Status And Performance Summary PDF and find out how to give a successful presentation. Present a perfect display to your team and make your presentation unforgettable.
-
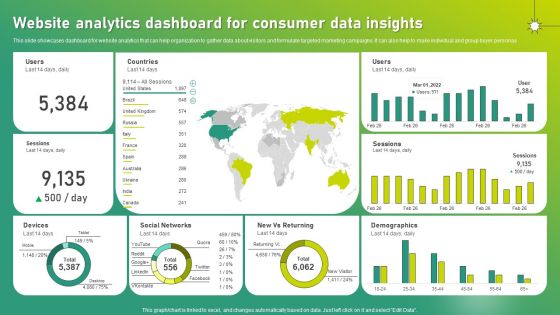
Targeted Marketing Strategic Plan For Audience Engagement Website Analytics Dashboard For Consumer Data Insights Guidelines PDF
This slide showcases dashboard for website analytics that can help organization to gather data about visitors and formulate targeted marketing campaigns. It can also help to make individual and group buyer personas. This Targeted Marketing Strategic Plan For Audience Engagement Website Analytics Dashboard For Consumer Data Insights Guidelines PDF is perfect for any presentation, be it in front of clients or colleagues. It is a versatile and stylish solution for organizing your meetings. The Targeted Marketing Strategic Plan For Audience Engagement Website Analytics Dashboard For Consumer Data Insights Guidelines PDF features a modern design for your presentation meetings. The adjustable and customizable slides provide unlimited possibilities for acing up your presentation. Slidegeeks has done all the homework before launching the product for you. So, do not wait, grab the presentation templates today.
-
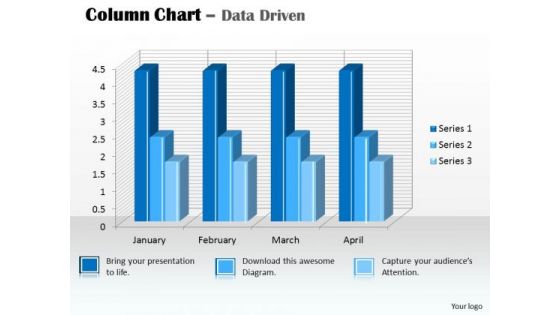
Data Analysis In Excel 3d Column Chart For PowerPoint Templates
Our data analysis in excel 3d column chart for Powerpoint Templates And Your Ideas Make A Great Doubles Pair. Play The Net With Assured Hands.
-
Sales Analytics Leaderboard Dashboard Ppt PowerPoint Presentation Infographic Template Templates PDF
Presenting this set of slides with name sales analytics leaderboard dashboard ppt powerpoint presentation infographic template templates pdf. The topics discussed in these slides are top performers, deal size, sales analytics, leaderboard dashboard. This is a completely editable PowerPoint presentation and is available for immediate download. Download now and impress your audience.
-
Burndown Graph With Remaining And Completed Tasks Ppt PowerPoint Presentation Icon Show PDF
Presenting this set of slides with name burndown graph with remaining and completed tasks ppt powerpoint presentation icon show pdf. The topics discussed in these slides are task completed, efforts remained, ideal burndown, task remained. This is a completely editable PowerPoint presentation and is available for immediate download. Download now and impress your audience.
-
Agile Application Development Agile Techniques And Scaling Agile Slides PDF
This slide covers agile most used techniques and scaling transformation model for the organization to use. Deliver and pitch your topic in the best possible manner with this agile application development agile techniques and scaling agile slides pdf. Use them to share invaluable insights on agile techniques and scaling agile transformation model and impress your audience. This template can be altered and modified as per your expectations. So, grab it now.
-
Adjusting Financial Strategies And Planning KPI Dashboard To Analyze Financial Improvements Inspiration PDF
This slide showcases the KPIs that would help our business organization to evaluate improvements with the new financial strategy implementation. It includes total income, total expenses, accounts receivable, etc. The best PPT templates are a great way to save time, energy, and resources. Slidegeeks have 100 percent editable powerpoint slides making them incredibly versatile. With these quality presentation templates, you can create a captivating and memorable presentation by combining visually appealing slides and effectively communicating your message. Download Adjusting Financial Strategies And Planning KPI Dashboard To Analyze Financial Improvements Inspiration PDF from Slidegeeks and deliver a wonderful presentation.
-
Call Centre Performance Evaluation Dashboard Icons PDF
Showcasing this set of slides titled call centre performance evaluation dashboard icons pdf. The topics addressed in these templates are call centre performance evaluation dashboard. All the content presented in this PPT design is completely editable. Download it and make adjustments in color, background, font etc. as per your unique business setting.
-
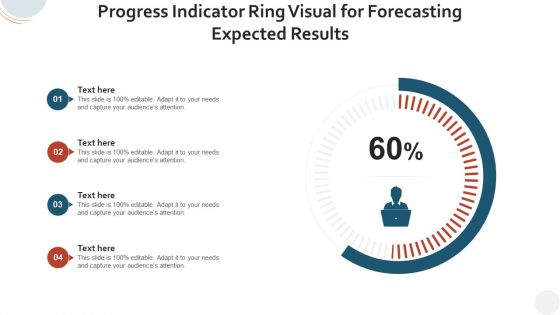
Progress Indicator Ring Visual For Forecasting Expected Results Diagrams PDF
Pitch your topic with ease and precision using this progress indicator ring visual for forecasting expected results diagrams pdf. This layout presents information on progress indicator ring visual for forecasting expected results. It is also available for immediate download and adjustment. So, changes can be made in the color, design, graphics or any other component to create a unique layout.
-
Adjusting Financial Strategies And Planning Tracking The Cashflow Improvements With Cash Management Diagrams PDF
This slide showcases the KPIs that would help our business organization to track the improvements in the new cash management process. It includes quick ratio, cash balance, current ratio, days inventory outstanding, etc. Retrieve professionally designed Adjusting Financial Strategies And Planning Tracking The Cashflow Improvements With Cash Management Diagrams PDF to effectively convey your message and captivate your listeners. Save time by selecting pre made slideshows that are appropriate for various topics, from business to educational purposes. These themes come in many different styles, from creative to corporate, and all of them are easily adjustable and can be edited quickly. Access them as PowerPoint templates or as Google Slides themes. You do not have to go on a hunt for the perfect presentation because Slidegeeks got you covered from everywhere.
-
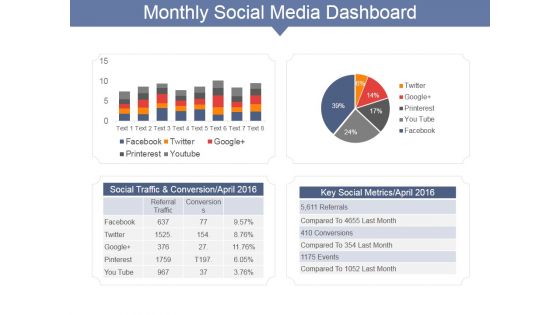
Monthly Social Media Dashboard Ppt PowerPoint Presentation Gallery Show
This is a monthly social media dashboard ppt powerpoint presentation gallery show. This is a two stage process. The stages in this process are social traffic and conversion april, key social metrics april, facebook, twitter.
-
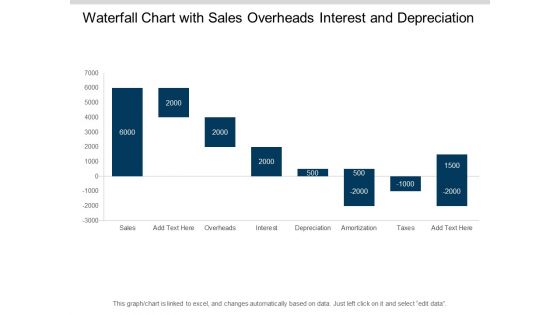
Waterfall Chart With Sales Overheads Interest And Depreciation Ppt PowerPoint Presentation File Display
This is a waterfall chart with sales overheads interest and depreciation ppt powerpoint presentation file display. This is a eight stage process. The stages in this process are sales waterfall, waterfall chart, business.
-
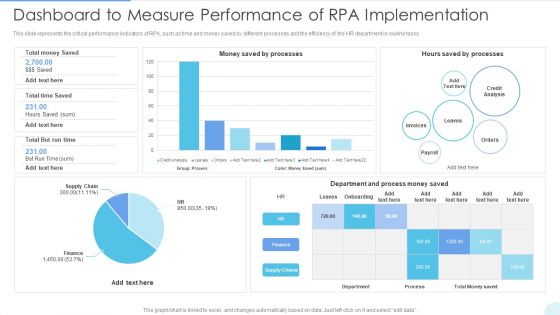
Dashboard To Measure Performance Of RPA Implementation Mockup PDF
This slide represents the critical performance indicators of RPA, such as time and money saved by different processes and the efficiency of the HR department in routine tasks. Deliver and pitch your topic in the best possible manner with this Dashboard To Measure Performance Of RPA Implementation Mockup PDF. Use them to share invaluable insights on Credit Analysis, Department And Process and impress your audience. This template can be altered and modified as per your expectations. So, grab it now.
-
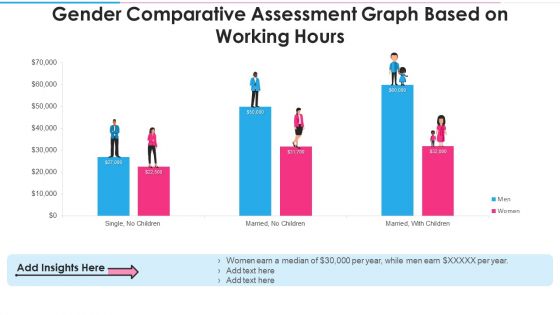
Gender Comparative Assessment Graph Based On Working Hours Elements PDF
Showcasing this set of slides titled gender comparative assessment graph based on working hours elements pdf. The topics addressed in these templates are gender comparative assessment graph based on working hours. All the content presented in this PPT design is completely editable. Download it and make adjustments in color, background, font etc. as per your unique business setting.
-
KPI Dashboard To Measure Overall Business Performance Themes PDF
Deliver and pitch your topic in the best possible manner with this KPI Dashboard To Measure Overall Business Performance Themes PDF. Use them to share invaluable insights on Sales Comparison, Product Category, Brand Profitability and impress your audience. This template can be altered and modified as per your expectations. So, grab it now.
-
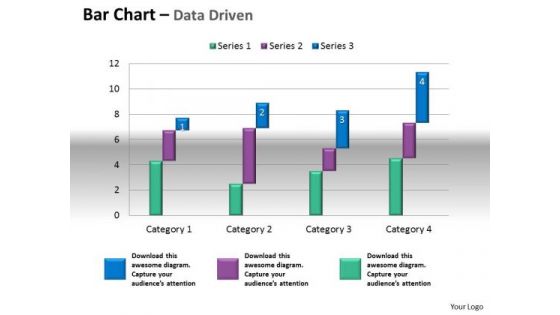
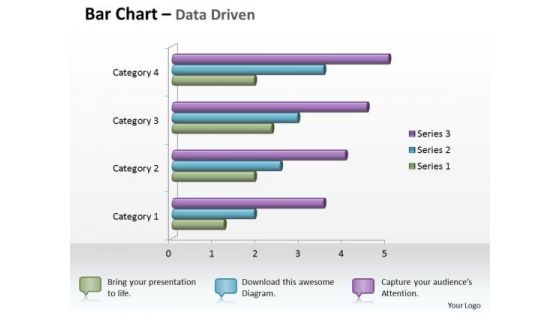
Microsoft Excel Data Analysis Bar Chart To Compare Quantities PowerPoint Templates
Our microsoft excel data analysis bar chart to compare quantities Powerpoint Templates Leave No One In Doubt. Provide A Certainty To Your Views.
-
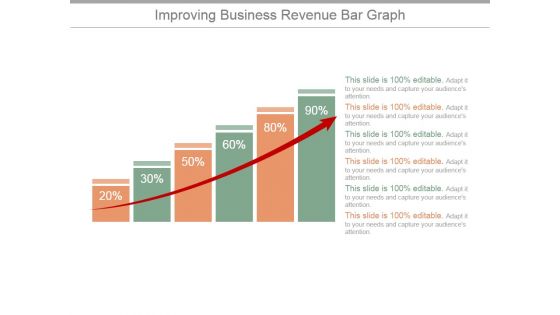
Improving Business Revenue Bar Graph Ppt PowerPoint Presentation Infographic Template
This is a improving business revenue bar graph ppt powerpoint presentation infographic template. This is a six stage process. The stages in this process are graph, arrow, finance, percentage, success.
-
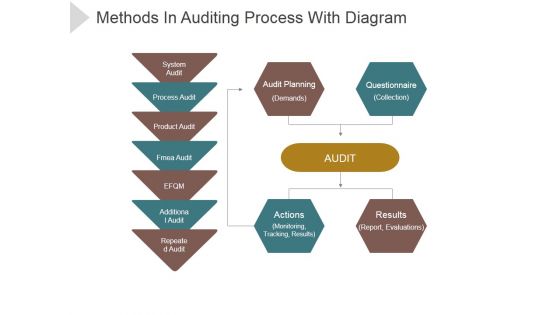
Methods In Auditing Process With Diagram Ppt PowerPoint Presentation Visual Aids
This is a methods in auditing process with diagram ppt powerpoint presentation visual aids. This is a four stage process. The stages in this process are system audit, process audit, product audit, fame audit, additional audit.
-
Data Analysis In Excel 3d Bar Chart For Business Statistics PowerPoint Templates
Knock On The Door To Success With Our data analysis in excel 3d bar chart for business statistics Powerpoint Templates . Be Assured Of Gaining Entry.
-
Project Scope Management Deliverables Project Status And Tasks Report Dashboards Introduction PDF
This slide shows the dashboards related to project details such as tasks, progress, time, costs, workloads, etc. Deliver and pitch your topic in the best possible manner with this project scope management deliverables project status and tasks report dashboards introduction pdf. Use them to share invaluable insights on tasks, progress, time, cost, workload and impress your audience. This template can be altered and modified as per your expectations. So, grab it now.
-
Global Healthcare Business Process Outsourcing Industry Outlook Guidelines PDF
This slide brings forth the market projection of business process outsourcing companies with major reference to healthcare industry. The key elements are market size, key drivers, market size projection, incremental growth, largest market, by geography, service provider and life science service Showcasing this set of slides titled Global Healthcare Business Process Outsourcing Industry Outlook Guidelines PDF. The topics addressed in these templates are Market Size, Market Size Projection, Largest Market. All the content presented in this PPT design is completely editable. Download it and make adjustments in color, background, font etc. as per your unique business setting.
-
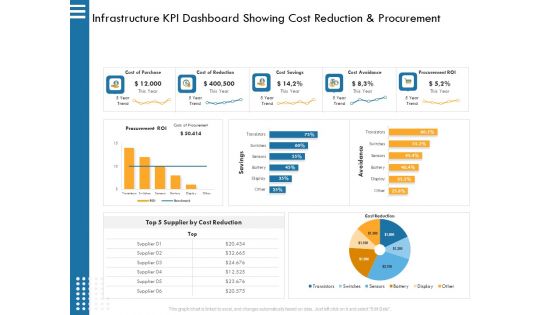
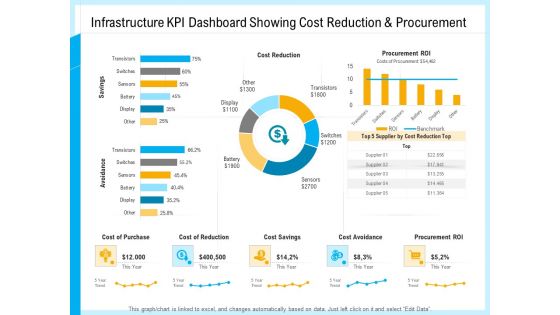
IT Infrastructure Governance Infrastructure KPI Dashboard Showing Cost Reduction And Procurement Ppt Infographics Picture PDF
Deliver an awe inspiring pitch with this creative it infrastructure governance infrastructure kpi dashboard showing cost reduction and procurement ppt infographics picture pdf. bundle. Topics like supplier, cost, reduction, procurement, avoidance. can be discussed with this completely editable template. It is available for immediate download depending on the needs and requirements of the user.
-
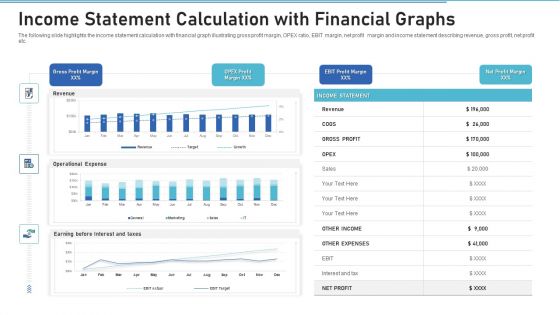
Income Statement Calculation With Financial Graphs Pictures PDF
Showcasing this set of slides titled income statement calculation with financial graphs pictures pdf. The topics addressed in these templates are revenue, gross profit, expenses. All the content presented in this PPT design is completely editable. Download it and make adjustments in color, background, font etc. as per your unique business setting.
-
Five Point Scale Likert Scale With Survey Results Diagrams PDF
Pitch your topic with ease and precision using this five point scale likert scale with survey results diagrams pdf. This layout presents information on service, customer, survey. It is also available for immediate download and adjustment. So, changes can be made in the color, design, graphics or any other component to create a unique layout.
-
Project Quality Management Plan Dashboard Tracking Quality Ppt Summary Rules PDF
Presenting this set of slides with name project quality management plan dashboard tracking quality ppt summary rules pdf. The topics discussed in these slide is dashboard tracking quality. This is a completely editable PowerPoint presentation and is available for immediate download. Download now and impress your audience.
-
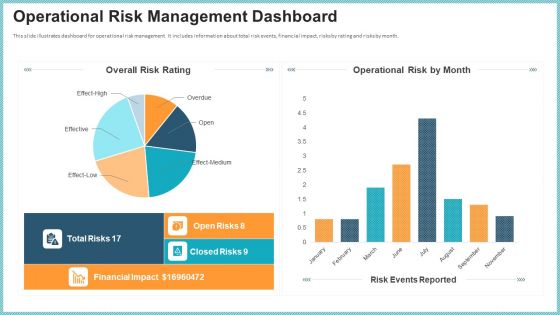
OP Risk Management Operational Risk Management Dashboard Formats PDF
This slide illustrates dashboard for operational risk management. It includes information about total risk events, financial impact, risks by rating and risks by month. Deliver an awe inspiring pitch with this creative op risk management operational risk management dashboard formats pdf bundle. Topics like operational risk management dashboard can be discussed with this completely editable template. It is available for immediate download depending on the needs and requirements of the user.
-
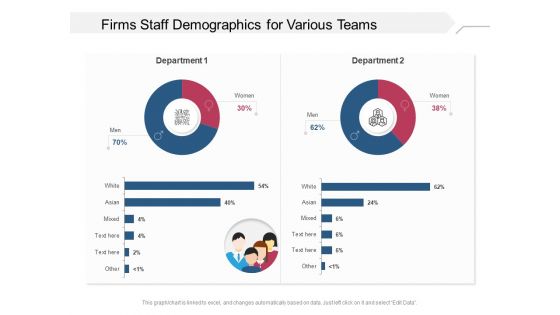
Firms Staff Demographics For Various Teams Ppt PowerPoint Presentation Gallery Templates PDF
Presenting this set of slides with name firms staff demographics for various teams ppt powerpoint presentation gallery templates pdf. The topics discussed in these slides are men, women. This is a completely editable PowerPoint presentation and is available for immediate download. Download now and impress your audience.
-
Hiring Key Performance Indicators With Job Reference Source Ppt PowerPoint Presentation Gallery Graphics Example PDF
Presenting this set of slides with name hiring key performance indicators with job reference source ppt powerpoint presentation gallery graphics example pdf. The topics discussed in these slides are source, cost, recruitment. This is a completely editable PowerPoint presentation and is available for immediate download. Download now and impress your audience.
-
IT And Cloud Facilities Management Infrastructure KPI Dashboard Showing Cost Reduction And Procurement Introduction PDF
Deliver an awe-inspiring pitch with this creative it and cloud facilities management infrastructure kpi dashboard showing cost reduction and procurement introduction pdf bundle. Topics like cost reduction, avoidance, procurement roi, cost purchase, cost savings, cost avoidance can be discussed with this completely editable template. It is available for immediate download depending on the needs and requirements of the user.
-
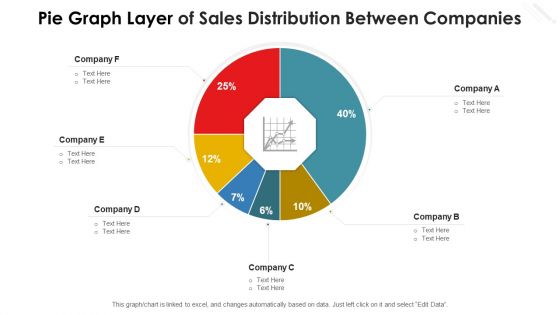
Pie Graph Layer Of Sales Distribution Between Companies Template PDF
Showcasing this set of slides titled pie graph layer of sales distribution between companies template pdf. The topics addressed in these templates are pie graph layer of sales distribution between companies. All the content presented in this PPT design is completely editable. Download it and make adjustments in color, background, font etc. as per your unique business setting.
-
Pie Graph Layer Of Marketing Expenditure Themes PDF
Pitch your topic with ease and precision using this pie graph layer of marketing expenditure themes pdf. This layout presents information on online advertising, trade shows, sales training, catalogs and brochures. It is also available for immediate download and adjustment. So, changes can be made in the color, design, graphics or any other component to create a unique layout.
-
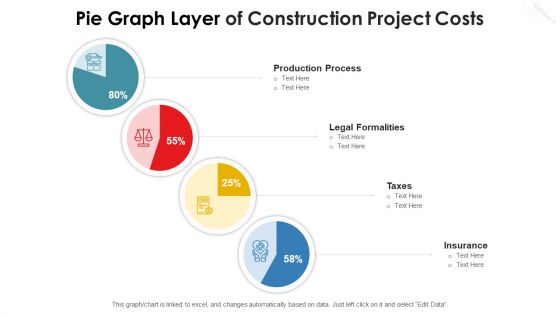
Pie Graph Layer Of Construction Project Costs Diagrams PDF
Showcasing this set of slides titled pie graph layer of construction project costs diagrams pdf. The topics addressed in these templates are production process, taxes, legal formalities, insurance. All the content presented in this PPT design is completely editable. Download it and make adjustments in color, background, font etc. as per your unique business setting.
-
Total Account Payable And Receivable Metrics Ppt PowerPoint Presentation Icon Diagrams PDF
Presenting this set of slides with name total account payable and receivable metrics ppt powerpoint presentation icon diagrams pdf. The topics discussed in these slides are total accounts receivables, current ratio, total accounts payable, equity ratio, debt equity, total accounts receivable and payable aging. This is a completely editable PowerPoint presentation and is available for immediate download. Download now and impress your audience.
-
Mobile Users Demographic Based On Age Ppt PowerPoint Presentation File Structure PDF
Presenting this set of slides with name mobile users demographic based on age ppt powerpoint presentation file structure pdf. The topics discussed in these slide is mobile users demographic based on age. This is a completely editable PowerPoint presentation and is available for immediate download. Download now and impress your audience.
-
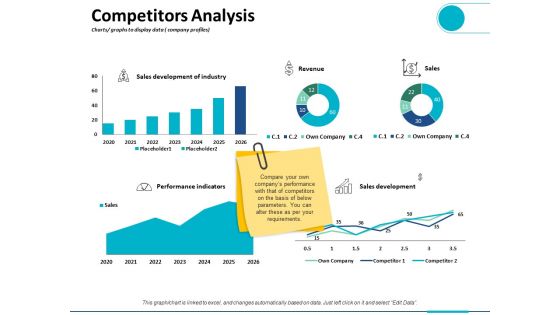
Competitors Analysis Charts Graphs To Display Data Company Profiles Ppt PowerPoint Presentation Outline Visual Aids
This is a competitors analysis charts graphs to display data company profiles ppt powerpoint presentation outline visual aids. This is a five stage process. The stages in this process are finance, analysis, business, investment, marketing.
-
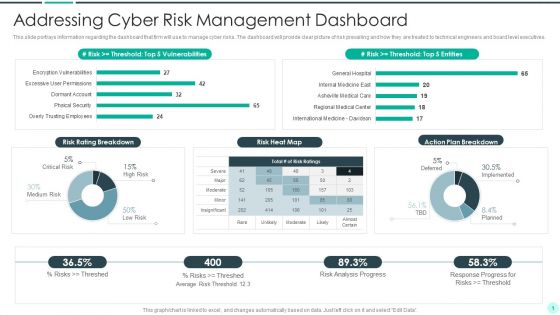
Executing Advance Data Analytics At Workspace Addressing Cyber Risk Guidelines PDF
This slide portrays information regarding the dashboard that firm will use to manage cyber risks. The dashboard will provide clear picture of risk prevailing and how they are treated to technical engineers and board level executives.Deliver an awe inspiring pitch with this creative executing advance data analytics at workspace addressing cyber risk guidelines pdf bundle. Topics like addressing cyber risk management dashboard can be discussed with this completely editable template. It is available for immediate download depending on the needs and requirements of the user.
-
Data Mining Report With Age And Occupation Details Background PDF
The following slide highlights the data profiling report with age and occupation illustrating data table and pie chart for age band, occupational type, and marital status Showcasing this set of slides titled data mining report with age and occupation details background pdf . The topics addressed in these templates are data mining report with age and occupation details . All the content presented in this PPT design is completely editable. Download it and make adjustments in color, background, font etc. as per your unique business setting.
-
Techniques For Timely Project Dashboard To Monitor Project Status And Performance Microsoft PDF
This slide focuses on dashboard to monitor project status and performance which includes estimated budget, actual cost, time taken by project team to complete phases, completion percentage of project, etc. Deliver and pitch your topic in the best possible manner with this Techniques For Timely Project Dashboard To Monitor Project Status And Performance Microsoft PDF. Use them to share invaluable insights on Timeline vs, Resource Capacity, Project Phase, Time Involved and impress your audience. This template can be altered and modified as per your expectations. So, grab it now.
-
Graph Showing Financial Prediction Of Company Sales Revenue Topics PDF
Pitch your topic with ease and precision using this graph showing financial prediction of company sales revenue topics pdf. This layout presents information on graph showing financial prediction of company sales revenue. It is also available for immediate download and adjustment. So, changes can be made in the color, design, graphics or any other component to create a unique layout.
-
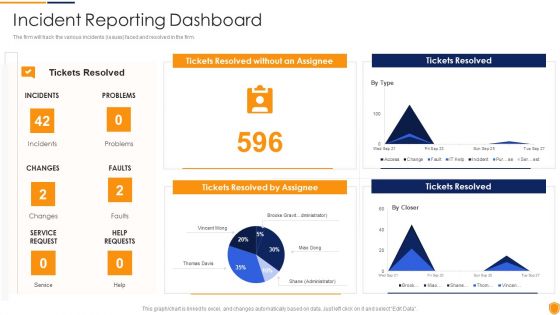
Mitigating Cybersecurity Threats And Vulnerabilities Incident Reporting Dashboard Demonstration PDF
The firm will track the various incidents issues faced and resolved in the firm. Deliver an awe inspiring pitch with this creative mitigating cybersecurity threats and vulnerabilities incident reporting dashboard demonstration pdf bundle. Topics like incident reporting dashboard can be discussed with this completely editable template. It is available for immediate download depending on the needs and requirements of the user.
-
Venture Capitalist Control Board Key Performance Indicators Dashboard For Operational Performance Analysis Formats PDF
Presenting this set of slides with name venture capitalist control board key performance indicators dashboard for operational performance analysis formats pdf. The topics discussed in these slides are revenue and volume, research production, new client onboarding, trade support staff productivity, trade error frequency. This is a completely editable PowerPoint presentation and is available for immediate download. Download now and impress your audience.
-
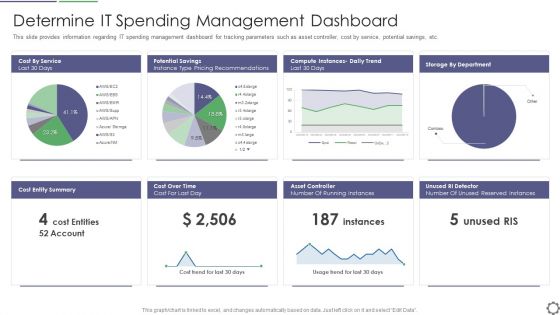
Determine IT Spending Management Dashboard Ppt PowerPoint Presentation Gallery Slide PDF
This slide provides information regarding IT spending management dashboard for tracking parameters such as asset controller, cost by service, potential savings, etc. Deliver and pitch your topic in the best possible manner with this determine it spending management dashboard ppt powerpoint presentation gallery slide pdf. Use them to share invaluable insights on cost entities, cost over time, cost for last day, asset controller, number of running instances and impress your audience. This template can be altered and modified as per your expectations. So, grab it now.
-
Determine IT Project Portfolio Management Tracking Dashboard Ppt Slides Pictures PDF
This slide provides information regarding IT project portfolio management tracking dashboard including details about allocated budget across portfolios, used budget percentage, estimated vs. actual cost, etc. Deliver an awe inspiring pitch with this creative determine it project portfolio management tracking dashboard ppt slides pictures pdf bundle. Topics like budget across portfolios, budget percentage, financials can be discussed with this completely editable template. It is available for immediate download depending on the needs and requirements of the user.
-
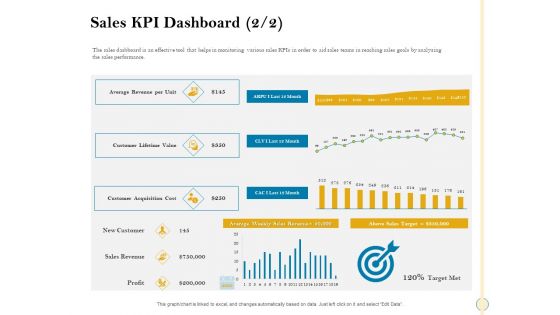
Sales Optimization Best Practices To Close More Deals Sales KPI Dashboard Revenue Diagrams PDF
The sales dashboard is an effective tool that helps in monitoring various sales KPIs in order to aid sales teams in reaching sales goals by analyzing the sales performance. Deliver an awe inspiring pitch with this creative sales optimization best practices to close more deals sales kpi dashboard revenue diagrams pdf bundle. Topics like sales kpi dashboard can be discussed with this completely editable template. It is available for immediate download depending on the needs and requirements of the user.
-
Fixed Asset Management Framework Implementation Metric Dashboard For Tracking Assets And Equipments Pictures PDF
This slide represents fixed asset dashboard for asset tracking. It highlights active assets, processors, operating system, devices etc.Deliver and pitch your topic in the best possible manner with this Fixed Asset Management Framework Implementation Metric Dashboard For Tracking Assets And Equipments Pictures PDF Use them to share invaluable insights on Active Assets, Operating System, Manufacture Model and impress your audience. This template can be altered and modified as per your expectations. So, grab it now.
-
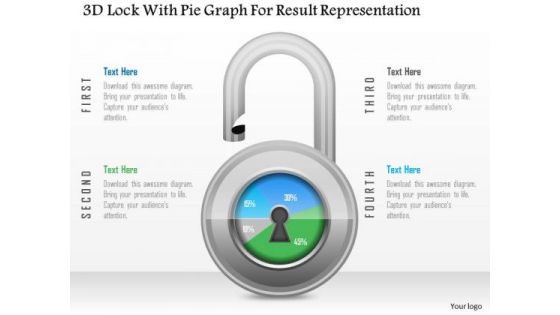
Business Diagram 3d Lock With Pie Graph For Result Representation PowerPoint Slide
This Power Point diagram has been crafted with pie chart in shape of lock. It contains diagram of lock pie chart to compare and present data in an effective manner. Use this diagram to build professional presentations for your viewers.

 Home
Home 


