Charts and Graphs
-
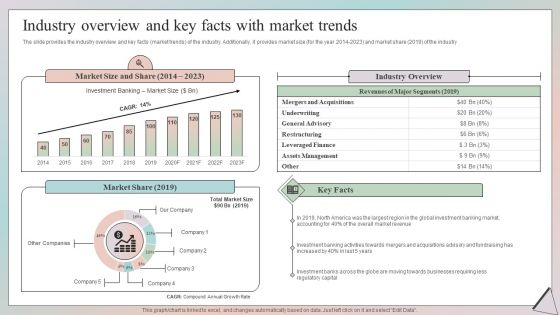
Grow Capital Through Equity Debt Industry Overview And Key Facts With Market Trends Structure PDF
The slide provides the executive summary related to the company which includes needs for the funds, strong preference for unsecured senior notes, etc.Create an editable Grow Capital Through Equity Debt Industry Overview And Key Facts With Market Trends Structure PDF that communicates your idea and engages your audience. Whether you are presenting a business or an educational presentation, pre designed presentation templates help save time. Grow Capital Through Equity Debt Industry Overview And Key Facts With Market Trends Structure PDF is highly customizable and very easy to edit, covering many different styles from creative to business presentations. Slidegeeks has creative team members who have crafted amazing templates. So, go and get them without any delay.
-
Monthly Organizational Expense Tracker Sheet Professional PDF
The following slide depicts the various Organizational expenses month wise details to track and eliminate unproductive expenditures. It includes elements such as monthly budget, total expenditure utilities, telephone, equipment, internet, meals etc. Showcasing this set of slides titled Monthly Organizational Expense Tracker Sheet Professional PDF. The topics addressed in these templates are Equipment, Expense, Expenditure. All the content presented in this PPT design is completely editable. Download it and make adjustments in color, background, font etc. as per your unique business setting.
-
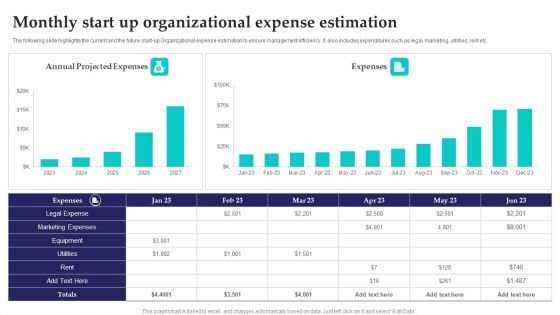
Monthly Start Up Organizational Expense Estimation Information PDF
The following slide highlights the current and the future start up Organizational expense estimation to ensure management efficiency. It also includes expenditures such as legal, marketing, utilities, rent etc. Pitch your topic with ease and precision using this Monthly Start Up Organizational Expense Estimation Information PDF. This layout presents information on Marketing Expenses, Equipment, Organizational. It is also available for immediate download and adjustment. So, changes can be made in the color, design, graphics or any other component to create a unique layout.
-
Grow Capital Through Equity Debt Financing Requirements By The Company Pictures PDF
The slide provides the convertible bond funding costa with shares issued, after tax cost of equity funding, cost of debt funding, etc.Boost your pitch with our creative Grow Capital Through Equity Debt Financing Requirements By The Company Pictures PDF. Deliver an awe-inspiring pitch that will mesmerize everyone. Using these presentation templates you will surely catch everyones attention. You can browse the ppts collection on our website. We have researchers who are experts at creating the right content for the templates. So you do not have to invest time in any additional work. Just grab the template now and use them.
-
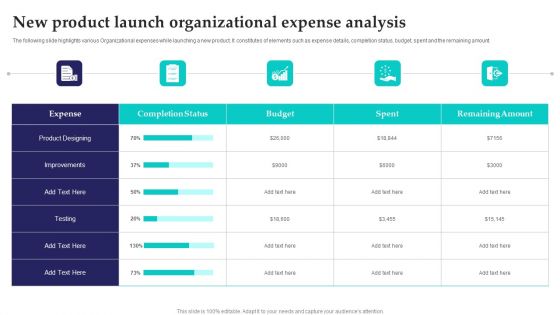
New Product Launch Organizational Expense Analysis Elements PDF
The following slide highlights various Organizational expenses while launching a new product. It constitutes of elements such as expense details, completion status, budget, spent and the remaining amount. Showcasing this set of slides titled New Product Launch Organizational Expense Analysis Elements PDF. The topics addressed in these templates are Product Designing, Budget, Organizational Expense Analysis. All the content presented in this PPT design is completely editable. Download it and make adjustments in color, background, font etc. as per your unique business setting.
-
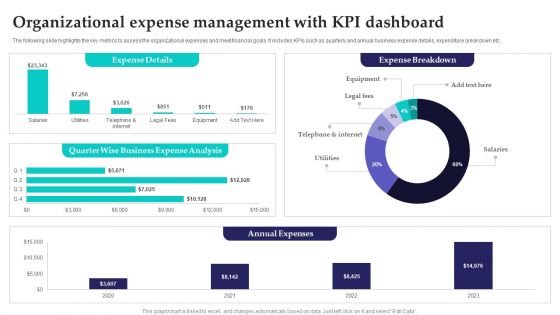
Organizational Expense Management With Kpi Dashboard Slides PDF
The following slide highlights the key metrics to assess the organizational expenses and meet financial goals. It includes KPIs such as quarterly and annual business expense details, expenditure breakdown etc. Showcasing this set of slides titled Organizational Expense Management With Kpi Dashboard Slides PDF. The topics addressed in these templates are Annual Expenses, Expense Details, Expense Breakdown. All the content presented in this PPT design is completely editable. Download it and make adjustments in color, background, font etc. as per your unique business setting.
-
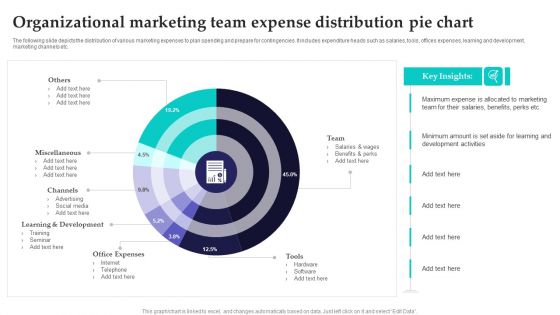
Organizational Marketing Team Expense Distribution Pie Chart Infographics PDF
The following slide depicts the distribution of various marketing expenses to plan spending and prepare for contingencies. It includes expenditure heads such as salaries, tools, offices expenses, learning and development, marketing channels etc. Pitch your topic with ease and precision using this Organizational Marketing Team Expense Distribution Pie Chart Infographics PDF. This layout presents information on Development, Office Expenses, Internet. It is also available for immediate download and adjustment. So, changes can be made in the color, design, graphics or any other component to create a unique layout.
-
Project Tracking Budget Risk And Health Tracker Inspiration PDF
The following slide depicts the tracker to trace the progress of project tracking at the same time. It includes various kpis such as task, budget, resource, issues and risk status etc. Showcasing this set of slides titled Project Tracking Budget Risk And Health Tracker Inspiration PDF. The topics addressed in these templates are Risk And Health Tracker, Project Tracking Budget. All the content presented in this PPT design is completely editable. Download it and make adjustments in color, background, font etc. as per your unique business setting.
-
Project Tracking Bug And Progress Tracker Dashboard Elements PDF
The following slide showcases the progress status of project tracking activities to achieve objectives. It constitutes of elements such as number of projects, features, work items, number of bugs along with the progress status etc. Pitch your topic with ease and precision using this Project Tracking Bug And Progress Tracker Dashboard Elements PDF. This layout presents information on Project Tracking, Progress Tracker Dashboard. It is also available for immediate download and adjustment. So, changes can be made in the color, design, graphics or any other component to create a unique layout.
-
Project Tracking Cost Tracker Dashboard Elements PDF
The following slide highlights the cost analysis of various projects to perform feasibility analysis. It includes budgeted versus actual cost, project wise cost and revenue allocation etc. Showcasing this set of slides titled Project Tracking Cost Tracker Dashboard Elements PDF. The topics addressed in these templates are Budgeted Costs, Resource Allocation, Project Costs. All the content presented in this PPT design is completely editable. Download it and make adjustments in color, background, font etc. as per your unique business setting.
-
Project Tracking Dashboard With Multiple Metrics Pictures PDF
The following slide highlights the KPI of project management to avoid deviations. It includes elements such as schedule, tasks, issue assessment, budget and risk analysis etc. Pitch your topic with ease and precision using this Project Tracking Dashboard With Multiple Metrics Pictures PDF. This layout presents information on Projected Budget Analysis, Risk Analysis, Quality Affirmation. It is also available for immediate download and adjustment. So, changes can be made in the color, design, graphics or any other component to create a unique layout.
-
Grow Capital Through Equity Debt Brief Introduction With Revenue Split Background PDF
The slide provides the brief introduction about the company introducing IPO. key points included are business overview, mission, vision, five years financials revenue, operating net margin and revenue split by business operations.Retrieve professionally designed Grow Capital Through Equity Debt Brief Introduction With Revenue Split Background PDF to effectively convey your message and captivate your listeners. Save time by selecting pre-made slideshows that are appropriate for various topics, from business to educational purposes. These themes come in many different styles, from creative to corporate, and all of them are easily adjustable and can be edited quickly. Access them as PowerPoint templates or as Google Slides themes. You do not have to go on a hunt for the perfect presentation because Slidegeeks got you covered from everywhere.
-
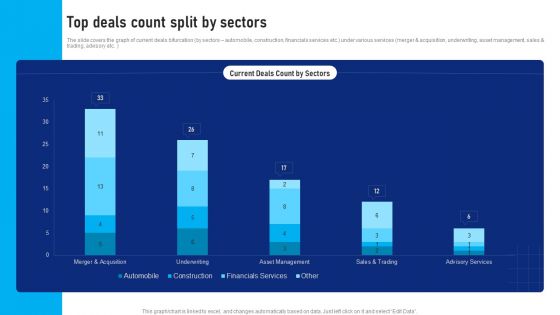
Buy Side Advisory Services In M And A Top Deals Count Split By Sectors Summary PDF
The slide covers the name and designation of the team executivesCEO, CFO, Department head etc. of the company. It also provides the Major Transaction Experience work experience of the executives. If your project calls for a presentation, then Slidegeeks is your go-to partner because we have professionally designed, easy-to-edit templates that are perfect for any presentation. After downloading, you can easily edit Buy Side Advisory Services In M And A Top Deals Count Split By Sectors Summary PDF and make the changes accordingly. You can rearrange slides or fill them with different images. Check out all the handy templates.
-
Project Tracking Management And Workload Tracker Dashboard Clipart PDF
The following slide highlights the workload status of various projects to administer cost and timeliness. It includes KPAs such activity, workload status, total cost, task duration etc. Showcasing this set of slides titled Project Tracking Management And Workload Tracker Dashboard Clipart PDF. The topics addressed in these templates are Project Tracking Management, Workload Tracker Dashboard. All the content presented in this PPT design is completely editable. Download it and make adjustments in color, background, font etc. as per your unique business setting.
-
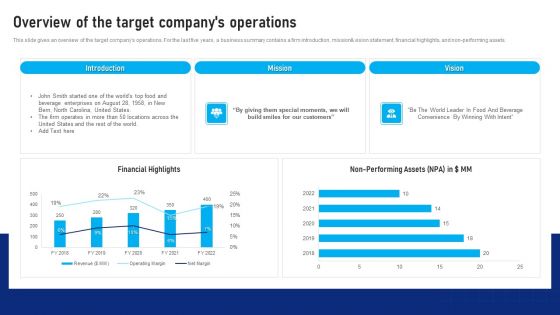
Buy Side Advisory Services In M And A Overview Of The Target Companys Operations Information PDF
The slide includes an overview of the industry as well as key facts market trends. Additionally, it provides market size for the year 2014-2023 and market share 2020 of the industry. Slidegeeks is here to make your presentations a breeze with Buy Side Advisory Services In M And A Overview Of The Target Companys Operations Information PDF With our easy-to-use and customizable templates, you can focus on delivering your ideas rather than worrying about formatting. With a variety of designs to choose from, you are sure to find one that suits your needs. And with animations and unique photos, illustrations, and fonts, you can make your presentation pop. So whether you are giving a sales pitch or presenting to the board, make sure to check out Slidegeeks first.
-
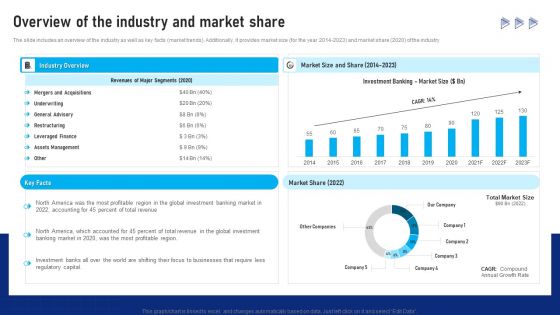
Buy Side Advisory Services In M And A Overview Of The Industry And Market Share Download PDF
The slide includes an overview of the industry as well as key facts market trends. Additionally, it provides market size for the year 2014 to 2023 and market share 2020 of the industry. Present like a pro with Buy Side Advisory Services In M And A Overview Of The Industry And Market Share Download PDF Create beautiful presentations together with your team, using our easy-to-use presentation slides. Share your ideas in real-time and make changes on the fly by downloading our templates. So whether you are in the office, on the go, or in a remote location, you can stay in sync with your team and present your ideas with confidence. With Slidegeeks presentation got a whole lot easier. Grab these presentations today.
-
Buy Side Advisory Services In M And A Other Sectors Top Clients And Total Revenue Brochure PDF
The slide identifies a list of companys clients in various other sectors manufacturing, construction, financials services, energy. Mining, automobile etc. along with the total revenue from each sector for the year 2021.Get a simple yet stunning designed Buy Side Advisory Services In M And A Other Sectors Top Clients And Total Revenue Brochure PDF. It is the best one to establish the tone in your meetings. It is an excellent way to make your presentations highly effective. So, download this PPT today from Slidegeeks and see the positive impacts. Our easy-to-edit Buy Side Advisory Services In M And A Other Sectors Top Clients And Total Revenue Brochure PDF can be your go-to option for all upcoming conferences and meetings. So, what are you waiting for Grab this template today.
-
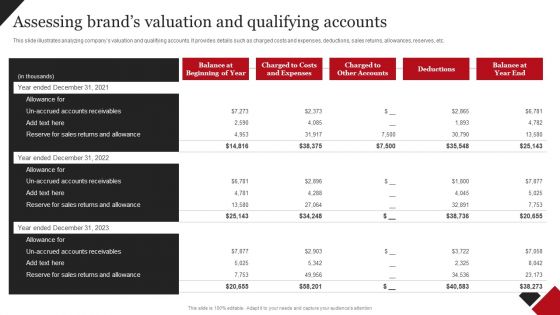
Coca Cola Emotional Marketing Strategy Assessing Brands Valuation And Qualifying Mockup PDF
The following slide includes statistics illustrating revenue highlights of brand by product line and geographies. It provides information about North America, Asia Pacific and Latin America ALPA, Greater China, EMEA Europe, Middle East and Africa, footwear, apparel, etc. Want to ace your presentation in front of a live audience Our Coca Cola Emotional Marketing Strategy Assessing Brands Valuation And Qualifying Mockup PDF can help you do that by engaging all the users towards you. Slidegeeks experts have put their efforts and expertise into creating these impeccable powerpoint presentations so that you can communicate your ideas clearly. Moreover, all the templates are customizable, and easy-to-edit and downloadable. Use these for both personal and commercial use.
-
Coca Cola Emotional Marketing Strategy Forecasting Market Share Amongst Major Brands Pictures PDF
This slide showcases projecting market share amongst major players. It provides details about compound annual growth rate CAGR, market cap, customer emotions, brand image, storytelling, product differentiation, sales volume, etc. Coming up with a presentation necessitates that the majority of the effort goes into the content and the message you intend to convey. The visuals of a PowerPoint presentation can only be effective if it supplements and supports the story that is being told. Keeping this in mind our experts created Coca Cola Emotional Marketing Strategy Forecasting Market Share Amongst Major Brands Pictures PDF to reduce the time that goes into designing the presentation. This way, you can concentrate on the message while our designers take care of providing you with the right template for the situation.
-
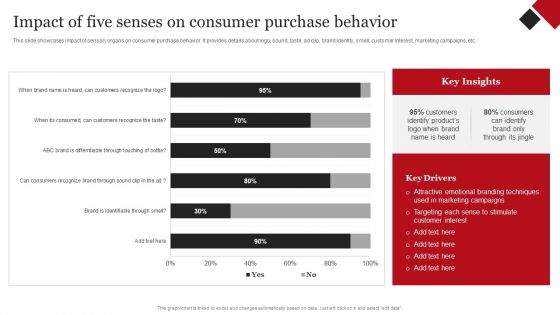
Coca Cola Emotional Marketing Strategy Impact Of Five Senses On Consumer Purchase Brochure PDF
This slide showcases impact of sensory organs on consumer purchase behavior. It provides details about logo, sound, taste, ad clip, brand identity, smell, customer interest, marketing campaigns, etc. The best PPT templates are a great way to save time, energy, and resources. Slidegeeks have 100 percent editable powerpoint slides making them incredibly versatile. With these quality presentation templates, you can create a captivating and memorable presentation by combining visually appealing slides and effectively communicating your message. Download Coca Cola Emotional Marketing Strategy Impact Of Five Senses On Consumer Purchase Brochure PDF from Slidegeeks and deliver a wonderful presentation.
-
Coca Cola Emotional Marketing Strategy Bar Chart Ppt Professional Picture PDF
This Coca Cola Emotional Marketing Strategy Bar Chart Ppt Professional Picture PDF is perfect for any presentation, be it in front of clients or colleagues. It is a versatile and stylish solution for organizing your meetings. The Coca Cola Emotional Marketing Strategy Bar Chart Ppt Professional Picture PDF features a modern design for your presentation meetings. The adjustable and customizable slides provide unlimited possibilities for acing up your presentation. Slidegeeks has done all the homework before launching the product for you. So, dont wait, grab the presentation templates today
-
Quarterly Business Information Dashboard With Product Segments Slides PDF
This slide displays dashboard for performance analysis of key business operations to compare companys growth in different quarters. It further includes information such as sales, revenue, gross profit, income and expenditure, etc. Showcasing this set of slides titled Quarterly Business Information Dashboard With Product Segments Slides PDF. The topics addressed in these templates are Quarterly Business Information, Dashboard With Product Segments. All the content presented in this PPT design is completely editable. Download it and make adjustments in color, background, font etc. as per your unique business setting.
-
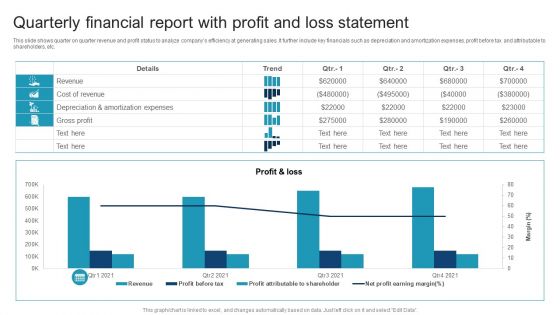
Quarterly Financial Report With Profit And Loss Statement Themes PDF
This slide shows quarter on quarter revenue and profit status to analyze companys efficiency at generating sales. It further include key financials such as depreciation and amortization expenses, profit before tax and attributable to shareholders, etc. Pitch your topic with ease and precision using this Quarterly Financial Report With Profit And Loss Statement Themes PDF. This layout presents information on Quarterly Financial Report, Profit And Loss Statement. It is also available for immediate download and adjustment. So, changes can be made in the color, design, graphics or any other component to create a unique layout.
-
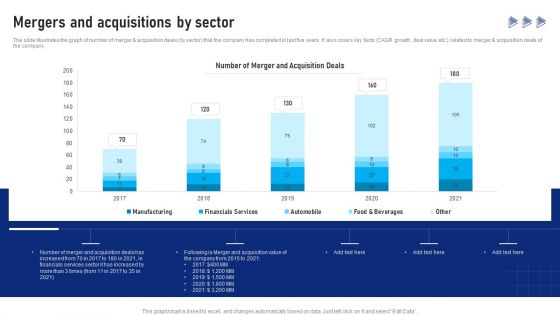
Buy Side Advisory Services In M And A Mergers And Acquisitions By Sector Introduction PDF
The slide illustrates the graph of number of merger and acquisition deals by sector that the company has completed in last five years. It also covers key facts CAGR growth, deal value etc. related to merger and acquisition deals of the company.There are so many reasons you need a Buy Side Advisory Services In M And A Mergers And Acquisitions By Sector Introduction PDF. The first reason is you can not spend time making everything from scratch, Thus, Slidegeeks has made presentation templates for you too. You can easily download these templates from our website easily.
-
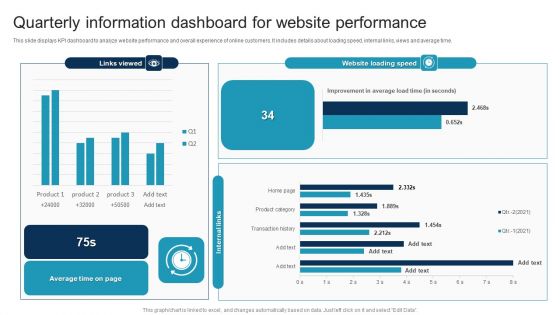
Quarterly Information Dashboard For Website Performance Portrait PDF
This slide displays KPI dashboard to analyze website performance and overall experience of online customers. It includes details about loading speed, internal links, views and average time. Pitch your topic with ease and precision using this Quarterly Information Dashboard For Website Performance Portrait PDF. This layout presents information on Quarterly Information, Dashboard For Website Performance. It is also available for immediate download and adjustment. So, changes can be made in the color, design, graphics or any other component to create a unique layout.
-
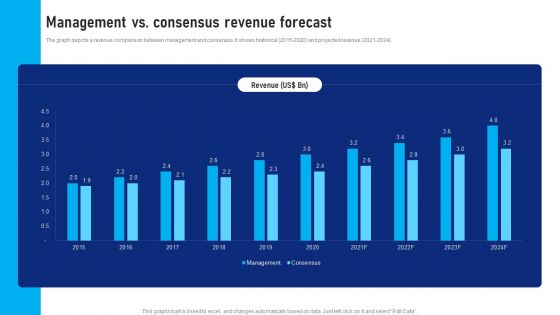
Buy Side Advisory Services In M And A Management Vs Consensus Revenue Forecast Ideas PDF
The graph depicts a revenue comparison between management and consensus. It shows historical 2015 to 2020 and projected revenue 2021 to 2024.Want to ace your presentation in front of a live audience Our Buy Side Advisory Services In M And A Management Vs Consensus Revenue Forecast Ideas PDF can help you do that by engaging all the users towards you. Slidegeeks experts have put their efforts and expertise into creating these impeccable powerpoint presentations so that you can communicate your ideas clearly. Moreover, all the templates are customizable, and easy-to-edit and downloadable. Use these for both personal and commercial use.
-
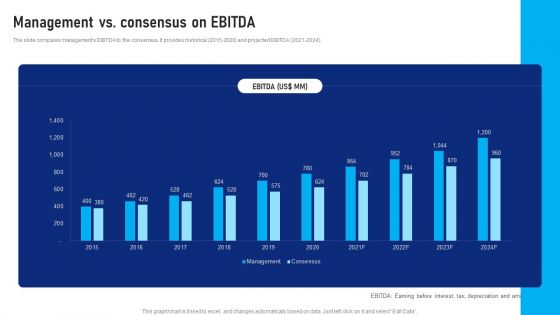
Buy Side Advisory Services In M And A Management Vs Consensus On Ebitda Information PDF
The slide compares managements EBITDA to the consensus. It provides historical 2015 to 2020 and projected EBITDA 2021 to 2024.Slidegeeks is one of the best resources for PowerPoint templates. You can download easily and regulate Buy Side Advisory Services In M And A Management Vs Consensus On Ebitda Information PDF for your personal presentations from our wonderful collection. A few clicks is all it takes to discover and get the most relevant and appropriate templates. Use our Templates to add a unique zing and appeal to your presentation and meetings. All the slides are easy to edit and you can use them even for advertisement purposes.
-
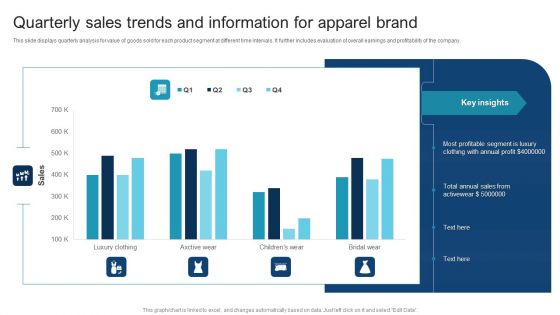
Quarterly Sales Trends And Information For Apparel Brand Pictures PDF
This slide displays quarterly analysis for value of goods sold for each product segment at different time intervals. It further includes evaluation of overall earnings and profitability of the company. Pitch your topic with ease and precision using this Quarterly Sales Trends And Information For Apparel Brand Pictures PDF. This layout presents information on Quarterly Sales, Trends And Information, Apparel Brand. It is also available for immediate download and adjustment. So, changes can be made in the color, design, graphics or any other component to create a unique layout.
-
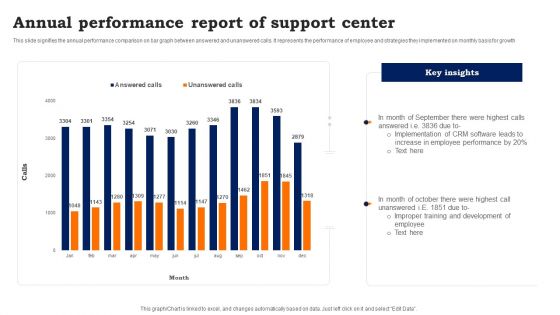
Annual Performance Report Of Support Center Inspiration PDF
This slide signifies the annual performance comparison on bar graph between answered and unanswered calls. It represents the performance of employee and strategies they implemented on monthly basis for growth. Showcasing this set of slides titled Annual Performance Report Of Support Center Inspiration PDF. The topics addressed in these templates are Annual Performance, Report Of Support Center. All the content presented in this PPT design is completely editable. Download it and make adjustments in color, background, font etc. as per your unique business setting.
-
Support Center Agent Activity Report Guidelines PDF
This slide signifies the KPI dashboard on performance evaluation of each agent working in a call center. It includes active agents, total and average talk time, answer ratio with bar graph on answerer calls.
-
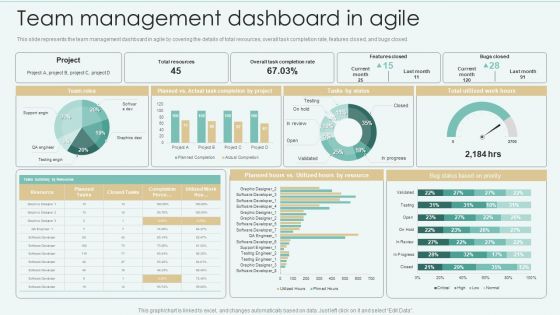
Strategies Of Agile Development To Enhance Processes Team Management Dashboard In Agile Graphics PDF
This slide represents the team management dashboard in agile by covering the details of total resources, overall task completion rate, features closed, and bugs closed. From laying roadmaps to briefing everything in detail, our templates are perfect for you. You can set the stage with your presentation slides. All you have to do is download these easy to edit and customizable templates. Strategies Of Agile Development To Enhance Processes Team Management Dashboard In Agile Graphics PDF will help you deliver an outstanding performance that everyone would remember and praise you for. Do download this presentation today.
-
Strategies Of Agile Development To Enhance Processes Impact Of Agile Methodology On Business Summary PDF
This slide depicts the impact of agile methodology on business, including a reduction in project failure, increase in predictability, money saving, boost time to market, and waste reduction. Slidegeeks is one of the best resources for PowerPoint templates. You can download easily and regulate Strategies Of Agile Development To Enhance Processes Impact Of Agile Methodology On Business Summary PDF for your personal presentations from our wonderful collection. A few clicks is all it takes to discover and get the most relevant and appropriate templates. Use our Templates to add a unique zing and appeal to your presentation and meetings. All the slides are easy to edit and you can use them even for advertisement purposes.
-
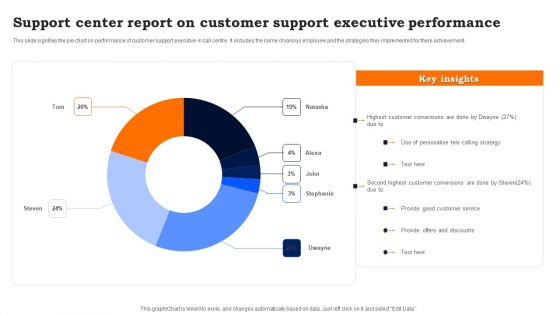
Support Center Report On Customer Support Executive Performance Sample PDF
This slide signifies the pie chart on performance of customer support executive in call centre. It includes the name of various employee and the strategies they implemented for there achievement. Showcasing this set of slides titled Support Center Report On Customer Support Executive Performance Sample PDF. The topics addressed in these templates are Use Of Personalise Telecalling, Provide Good Customer Service, Provide Offers And Discounts. All the content presented in this PPT design is completely editable. Download it and make adjustments in color, background, font etc. as per your unique business setting.
-
Support Center Report With Activity And Statistics Guidelines PDF
This slide signifies the report on call centre with activities and statistics. It includes agent activity sum, pie chart based on group calls, abandonment rate, service level and average queue time. Pitch your topic with ease and precision using this Support Center Report With Activity And Statistics Guidelines PDF. This layout presents information on Support Center Report, Activity And Statistics. It is also available for immediate download and adjustment. So, changes can be made in the color, design, graphics or any other component to create a unique layout.
-
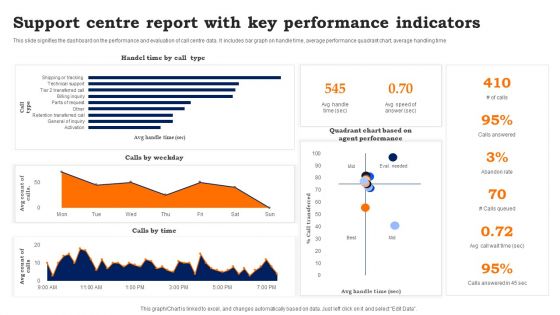
Support Centre Report With Key Performance Indicators Information PDF
This slide signifies the dashboard on the performance and evaluation of call centre data. It includes bar graph on handle time, average performance quadrant chart, average handling time. Showcasing this set of slides titled Support Centre Report With Key Performance Indicators Information PDF. The topics addressed in these templates are Support Centre Report, Key Performance Indicators. All the content presented in this PPT design is completely editable. Download it and make adjustments in color, background, font etc. as per your unique business setting.
-
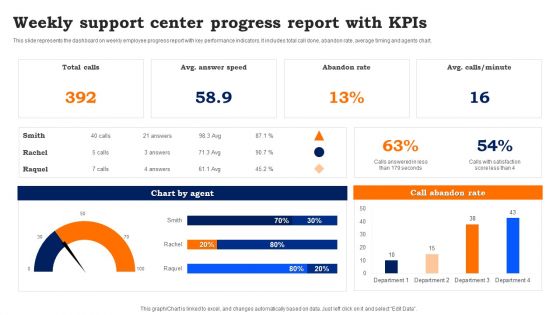
Weekly Support Center Progress Report With Kpis Template PDF
This slide represents the dashboard on weekly employee progress report with key performance indicators. It includes total call done, abandon rate, average timing and agents chart. Pitch your topic with ease and precision using this Weekly Support Center Progress Report With Kpis Template PDF. This layout presents information on Weekly Support, Center Progress Report. It is also available for immediate download and adjustment. So, changes can be made in the color, design, graphics or any other component to create a unique layout.
-
Prevention Of Information Determining The Actors Behind Most Significant Cyber Attack Diagrams PDF
The purpose of this slide is to outline different actors who are involved in the most critical cyber attack. Online criminals, foreign governments, hackers and malicious insiders are some of the key players who are responsible for cyber attack. Present like a pro with Prevention Of Information Determining The Actors Behind Most Significant Cyber Attack Diagrams PDF Create beautiful presentations together with your team, using our easy-to-use presentation slides. Share your ideas in real-time and make changes on the fly by downloading our templates. So whether youre in the office, on the go, or in a remote location, you can stay in sync with your team and present your ideas with confidence. With Slidegeeks presentation got a whole lot easier. Grab these presentations today.
-
Prevention Of Information Key Statistics Showing The Impact Of Security Awareness Infographics PDF
This graph or chart is linked to excel, and changes automatically based on data. Just left click on it and select Edit Data. This modern and well-arranged Prevention Of Information Key Statistics Showing The Impact Of Security Awareness Infographics PDF provides lots of creative possibilities. It is very simple to customize and edit with the Powerpoint Software. Just drag and drop your pictures into the shapes. All facets of this template can be edited with Powerpoint, no extra software is necessary. Add your own material, put your images in the places assigned for them, adjust the colors, and then you can show your slides to the world, with an animated slide included.
-
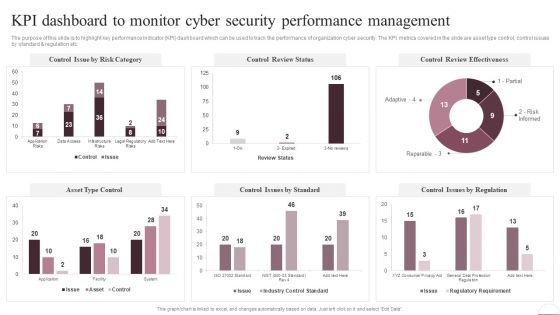
Prevention Of Information KPI Dashboard To Monitor Cyber Security Performance Information PDF
The purpose of this slide is to highlight key performance indicator KPI dashboard which can be used to track the performance of organization cyber security. The KPI metrics covered in the slide are asset type control, control issues by standard AND regulation etc. This Prevention Of Information KPI Dashboard To Monitor Cyber Security Performance Information PDF is perfect for any presentation, be it in front of clients or colleagues. It is a versatile and stylish solution for organizing your meetings. The Prevention Of Information KPI Dashboard To Monitor Cyber Security Performance Information PDF features a modern design for your presentation meetings. The adjustable and customizable slides provide unlimited possibilities for acing up your presentation. Slidegeeks has done all the homework before launching the product for you. So, dont wait, grab the presentation templates today
-
Strategies Of Agile Development To Enhance Processes Before Vs Post Implementing Agile Diagrams PDF
This slide represents the before and post agile implementation state of the business that shows the cost of agile projects is 4 times less than projects developed with waterfall model. Create an editable Strategies Of Agile Development To Enhance Processes Before Vs Post Implementing Agile Diagrams PDF that communicates your idea and engages your audience. Whether you are presenting a business or an educational presentation, pre designed presentation templates help save time. Strategies Of Agile Development To Enhance Processes Before Vs Post Implementing Agile Diagrams PDF is highly customizable and very easy to edit, covering many different styles from creative to business presentations. Slidegeeks has creative team members who have crafted amazing templates. So, go and get them without any delay.
-
Prevention Of Information KPI Metrics Dashboard To Effectively Track Cyber Guidelines PDF
The purpose of this slide is to highlight performance KPI dashboard used to monitor the cyber threat management. The metrics highlighted in the slide are risk score, compliance status, threat level, monitoring and operational status. Welcome to our selection of the Prevention Of Information KPI Metrics Dashboard To Effectively Track Cyber Guidelines PDF. These are designed to help you showcase your creativity and bring your sphere to life. Planning and Innovation are essential for any business that is just starting out. This collection contains the designs that you need for your everyday presentations. All of our PowerPoints are 100 percent editable, so you can customize them to suit your needs. This multi-purpose template can be used in various situations. Grab these presentation templates today
-
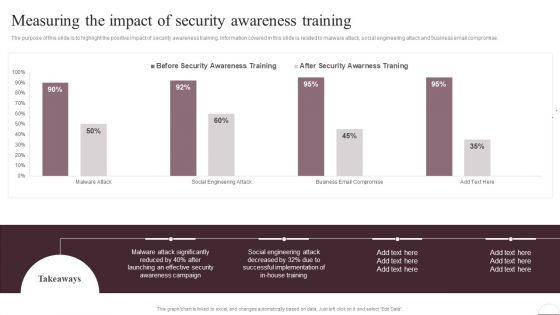
Prevention Of Information Measuring The Impact Of Security Awareness Training Ideas PDF
The purpose of this slide is to highlight the positive impact of security awareness training. Information covered in this slide is related to malware attack, social engineering attack and business email compromise. The Prevention Of Information Measuring The Impact Of Security Awareness Training Ideas PDF is a compilation of the most recent design trends as a series of slides. It is suitable for any subject or industry presentation, containing attractive visuals and photo spots for businesses to clearly express their messages. This template contains a variety of slides for the user to input data, such as structures to contrast two elements, bullet points, and slides for written information. Slidegeeks is prepared to create an impression.
-
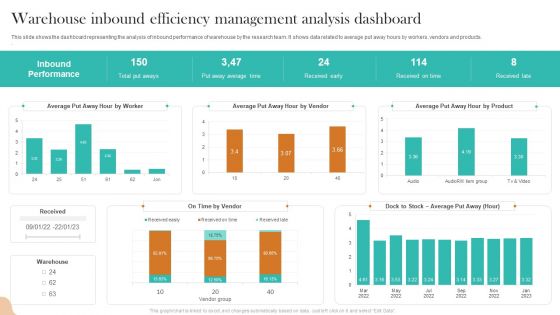
Warehouse Inbound Efficiency Management Analysis Dashboard Topics PDF
This slide shows the dashboard representing the analysis of inbound performance of warehouse by the research team. It shows data related to average put away hours by workers, vendors and products. Showcasing this set of slides titled Warehouse Inbound Efficiency Management Analysis Dashboard Topics PDF. The topics addressed in these templates are Inbound Performance, Total Put Aways, Received Early. All the content presented in this PPT design is completely editable. Download it and make adjustments in color, background, font etc. as per your unique business setting.
-
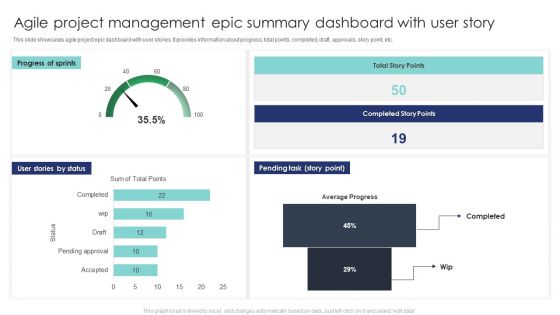
Agile Project Management Epic Summary Dashboard With User Story Formats PDF
This slide showcases agile project epic dashboard with user stories. It provides information about progress, total points, completed, draft, approvals, story point, etc. Pitch your topic with ease and precision using this Agile Project Management Epic Summary Dashboard With User Story Formats PDF. This layout presents information on Pending Tast, Progress Sprints, User Stories Status. It is also available for immediate download and adjustment. So, changes can be made in the color, design, graphics or any other component to create a unique layout.
-
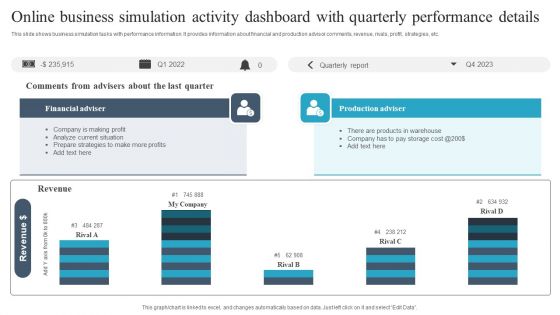
Online Business Simulation Activity Dashboard With Quarterly Performance Details Guidelines PDF
This slide shows business simulation tasks with performance information. It provides information about financial and production advisor comments, revenue, rivals, profit, strategies, etc. Pitch your topic with ease and precision using this Online Business Simulation Activity Dashboard With Quarterly Performance Details Guidelines PDF. This layout presents information on Financial Adviser, Production Adviser, Revenue. It is also available for immediate download and adjustment. So, changes can be made in the color, design, graphics or any other component to create a unique layout.
-
Multiplayer Startup Online Business Simulation Dashboard Demonstration PDF
This slide showcases multiplier startup business simulation dashboard. It provides information about individuals, statistics, team processes, adoption, effectiveness, meetings, alignment, communication, etc. Pitch your topic with ease and precision using this Multiplayer Startup Online Business Simulation Dashboard Demonstration PDF. This layout presents information on Individuals, Team Processes, Statistics. It is also available for immediate download and adjustment. So, changes can be made in the color, design, graphics or any other component to create a unique layout.
-
Impact On IT Department Business Operational Expenditure Post Introducing Cloud Computing Infographics PDF
This slide showcases impact on information technology IT department operating expenses OPEX post introduction of cloud computing which can benefit them in evaluating affects and making related changes to their budget for technology. It includes information about hardware, software, repair and maintenance, backup and disaster recovery, storage, etc. Showcasing this set of slides titled Impact On IT Department Business Operational Expenditure Post Introducing Cloud Computing Infographics PDF. The topics addressed in these templates are Software, Hardware, Storage. All the content presented in this PPT design is completely editable. Download it and make adjustments in color, background, font etc. as per your unique business setting.
-
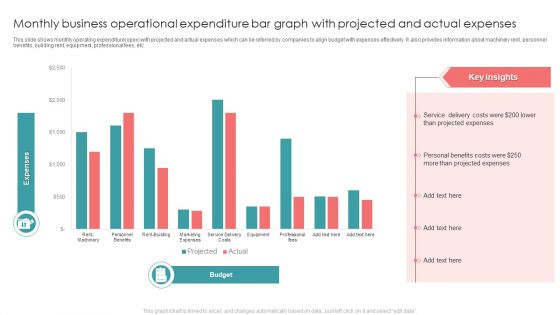
Monthly Business Operational Expenditure Bar Graph With Projected And Actual Expenses Introduction PDF
This slide shows monthly operating expenditure opex with projected and actual expenses which can be referred by companies to align budget with expenses effectively. It also provides information about machinery rent, personnel benefits, building rent, equipment, professional fees, etc. Pitch your topic with ease and precision using this Monthly Business Operational Expenditure Bar Graph With Projected And Actual Expenses Introduction PDF. This layout presents information on Projected Expenses, Costs, Service. It is also available for immediate download and adjustment. So, changes can be made in the color, design, graphics or any other component to create a unique layout.
-
Performance Analysis Using Operating Revenue Business Operational Expenditure And Income Metrics Diagrams PDF
This slide illustrates performance analysis using operating revenue, operating expenditure opex and income metrics which can be referred by organizations to evaluate their inflows and outflows to make relevant decisions for increasing profitability. It includes information about operating revenue, operating expense and income before taxes. Pitch your topic with ease and precision using this Performance Analysis Using Operating Revenue Business Operational Expenditure And Income Metrics Diagrams PDF. This layout presents information on Taxes, Highest Operating, Recorded. It is also available for immediate download and adjustment. So, changes can be made in the color, design, graphics or any other component to create a unique layout.
-
Profit And Loss Dashboard Indicating Business Operational Expenditure And EBIT Formats PDF
This slide shows profit and loss dashboard indicating opex operating expenses and ebit earning before interest and taxes which can be referred by companies in management of cash inflows and outflows of operations. It contains gross profit margin, net profit margin, ratio, income statement, etc. Showcasing this set of slides titled Profit And Loss Dashboard Indicating Business Operational Expenditure And EBIT Formats PDF. The topics addressed in these templates are Revenue, Gross Profit, Sales. All the content presented in this PPT design is completely editable. Download it and make adjustments in color, background, font etc. as per your unique business setting.
-
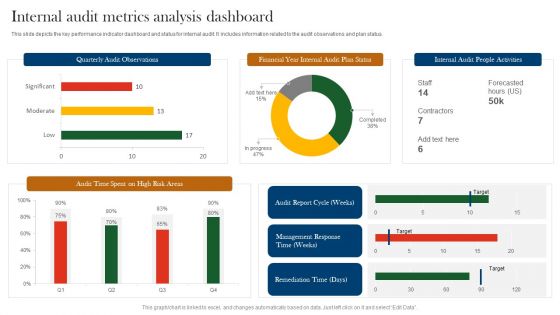
Internal Audit Metrics Analysis Dashboard Ppt Ideas Clipart Images PDF
This slide depicts the key performance indicator dashboard and status for internal audit. It includes information related to the audit observations and plan status. Pitch your topic with ease and precision using this Internal Audit Metrics Analysis Dashboard Ppt Ideas Clipart Images PDF. This layout presents information on Quarterly Audit Observations, Financial Year Internal, Audit Plan Status. It is also available for immediate download and adjustment. So, changes can be made in the color, design, graphics or any other component to create a unique layout.
-
Statistics Indicating Recurring Business Operational Expenditure In Telecom Operations Icons PDF
This slide shows statistics indicating recurring operating expenditure OPEX in telecom operations which can benefit their executives in evaluating the current expenses and make cost effective amendments for future operations. It includes information about maintenance, repair, network charging and billing, customer support, marketing and operational planning costs. Pitch your topic with ease and precision using this Statistics Indicating Recurring Business Operational Expenditure In Telecom Operations Icons PDF. This layout presents information on Company, Costs, Marketing Costs. It is also available for immediate download and adjustment. So, changes can be made in the color, design, graphics or any other component to create a unique layout.
-
Business Operational Expenditure Bar Graph With Annual Variances Brochure PDF
This slide showcases operating expenditure OPEX bar graph with annual variances assisting companies in controlling the difference of allocated budgets. It also includes information about planned expenses, actual expenses, marketing costs, office costs, employee costs, training, etc. Showcasing this set of slides titled Business Operational Expenditure Bar Graph With Annual Variances Brochure PDF. The topics addressed in these templates are Employee Costs, Planned Expenses, Training Costs. All the content presented in this PPT design is completely editable. Download it and make adjustments in color, background, font etc. as per your unique business setting.
-
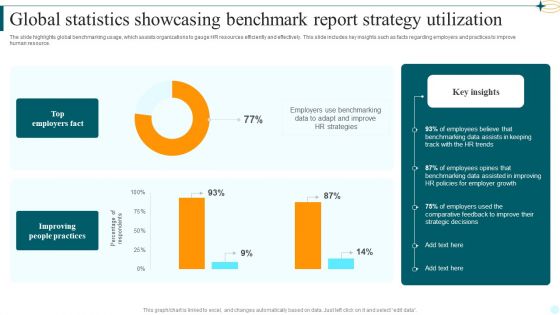
Global Statistics Showcasing Benchmark Report Strategy Utilization Mockup PDF
The slide highlights global benchmarking usage, which assists organizations to gauge HR resources efficiently and effectively. This slide includes key insights such as facts regarding employers and practices to improve human resource. Showcasing this set of slides titled Global Statistics Showcasing Benchmark Report Strategy Utilization Mockup PDF. The topics addressed in these templates are Top Employers Fact, Improving People Practices, Employers Use Benchmarking. All the content presented in this PPT design is completely editable. Download it and make adjustments in color, background, font etc. as per your unique business setting.
-
Finance Budget And Efficiency Benchmark Report At Global Level Template PDF
The slide provides finance budget and efficiency benchmarks that help finance leaders with precise insights about resource allocation, staffing and organizational structure. The slide includes benchmarking finance spending of company against its peers. Showcasing this set of slides titled Finance Budget And Efficiency Benchmark Report At Global Level Template PDF. The topics addressed in these templates are Benchmark, Key Insights, Benchmark Percentage. All the content presented in this PPT design is completely editable. Download it and make adjustments in color, background, font etc. as per your unique business setting.
-
Budget Benchmark Report For Oncology Clinical Studies At Global Level Icons PDF
The slide showcases budget benchmarking to gauge and improve financial results by selecting few operating ratios by which company wants to measure its results and manage assets. Showcasing this set of slides titled Budget Benchmark Report For Oncology Clinical Studies At Global Level Icons PDF. The topics addressed in these templates are Benchmark Source, Key Insights, Actual Budget. All the content presented in this PPT design is completely editable. Download it and make adjustments in color, background, font etc. as per your unique business setting.
-
Percentage Distribution Of Cloud Integration In Various Industries Ppt Designs Download PDF
This slide showcase the percentage wise usage of cloud models in different organization sectors. It includes deployment of cloud models in engineering, finance, software and technology and healthcare industry. Showcasing this set of slides titled Percentage Distribution Of Cloud Integration In Various Industries Ppt Designs Download PDF. The topics addressed in these templates are Key Insights, Hybrid Cloud Model, Finance Industries. All the content presented in this PPT design is completely editable. Download it and make adjustments in color, background, font etc. as per your unique business setting.
-
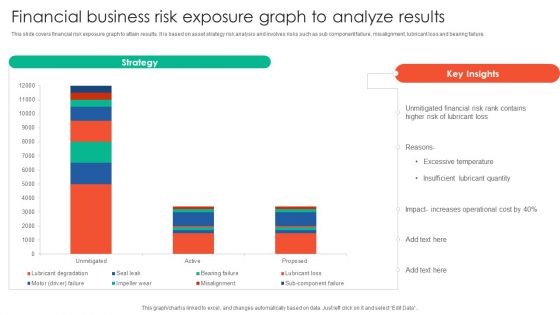
Financial Business Risk Exposure Graph To Analyze Results Elements PDF
This slide covers financial risk exposure graph to attain results. It is based on asset strategy risk analysis and involves risks such as sub component failure, misalignment, lubricant loss and bearing failure. Pitch your topic with ease and precision using this Financial Business Risk Exposure Graph To Analyze Results Elements PDF. This layout presents information on Strategy, Unmitigated Financial, Risk Rank Contains. It is also available for immediate download and adjustment. So, changes can be made in the color, design, graphics or any other component to create a unique layout.
-
Constructing It Project Management Progress Dashboard Brochure PDF
This slide defines the process of constructing information technology project management status dashboard. It includes information related to planning, designing, development and testing.Pitch your topic with ease and precision using this Constructing It Project Management Progress Dashboard Brochure PDF. This layout presents information on E Commerce Dashboard, Development Environment, Recruiting Data Scientist. It is also available for immediate download and adjustment. So, changes can be made in the color, design, graphics or any other component to create a unique layout.
-
Building Construction Project Progress Report Map Icon Professional PDF
This slide defines the dashboard for analyzing the status of a building constructing project. It includes information related to progress, cost breakdown, budget and work schedule. Pitch your topic with ease and precision using this Building Construction Project Progress Report Map Icon Professional PDF. This layout presents information on Design Build, Project Start, Project End. It is also available for immediate download and adjustment. So, changes can be made in the color, design, graphics or any other component to create a unique layout.

 Home
Home 


