Charts and Graphs
-
Optimizing Fiber Distributed Data Interface To Enhance Processes Cost Issue Of Copper Wires Professional PDF
This slide depicts the cost issue of copper wires which highlights that copper cables are more expensive than any other cables in the market, and it is continuously on the increase. Take your projects to the next level with our ultimate collection of Optimizing Fiber Distributed Data Interface To Enhance Processes Cost Issue Of Copper Wires Professional PDF. Slidegeeks has designed a range of layouts that are perfect for representing task or activity duration, keeping track of all your deadlines at a glance. Tailor these designs to your exact needs and give them a truly corporate look with your own brand colors they will make your projects stand out from the rest.
-
Common Limitations Related To Stakeholders Management Strengthen Manage Relationships Professional PDF
This slide covers the problems with stakeholders Management plan due to which project fails such as poor communication, lack of stakeholders interest or lack of stakeholders control over project. The Common Limitations Related To Stakeholders Management Strengthen Manage Relationships Professional PDF is a compilation of the most recent design trends as a series of slides. It is suitable for any subject or industry presentation, containing attractive visuals and photo spots for businesses to clearly express their messages. This template contains a variety of slides for the user to input data, such as structures to contrast two elements, bullet points, and slides for written information. Slidegeeks is prepared to create an impression.
-
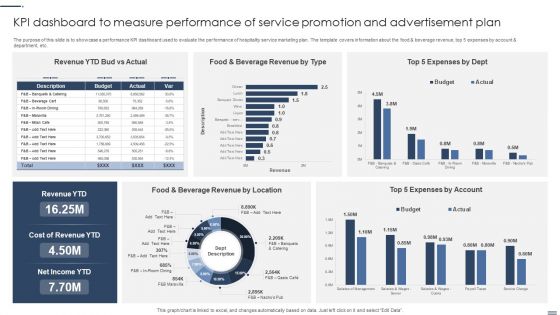
Kpi Dashboard To Measure Performance Of Service Promotion And Advertisement Plan Background PDF
The purpose of this slide is to showcase a performance KPI dashboard used to evaluate the performance of hospitality service marketing plan. The template covers information about the food and beverage revenue, top 5 expenses by account and department, etc. Showcasing this set of slides titled Kpi Dashboard To Measure Performance Of Service Promotion And Advertisement Plan Background PDF. The topics addressed in these templates areLocation, Account, Cost Revenue. All the content presented in this PPT design is completely editable. Download it and make adjustments in color, background, font etc. as per your unique business setting.
-
Work Stream Function Breakdown Status Report Demonstration PDF
The following slide highlights the key indicators of work stream to assists decision makers and identify flaws. It constitutes of work stream function breakdown into characteristics, obligations, threats, deficiencies etc. Pitch your topic with ease and precision using this Work Stream Function Breakdown Status Report Demonstration PDF. This layout presents information on Characteristics, Obligations, Threats, Deficiencies. It is also available for immediate download and adjustment. So, changes can be made in the color, design, graphics or any other component to create a unique layout.
-
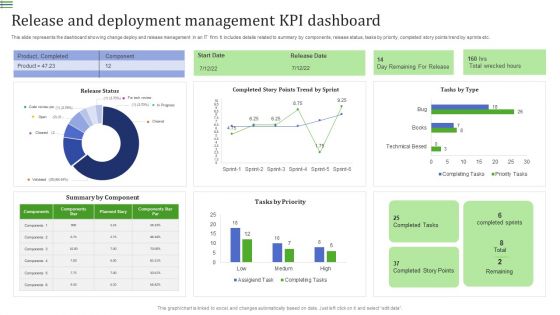
Release And Deployment Management KPI Dashboard Summary PDF
This slide represents the dashboard showing change deploy and release management in an IT firm. It includes details related to summary by components, release status, tasks by priority, completed story points trend by sprints etc.Showcasing this set of slides titled Release And Deployment Management KPI Dashboard Summary PDF. The topics addressed in these templates are Product Completed, Summary Component, Completed Story. All the content presented in this PPT design is completely editable. Download it and make adjustments in color, background, font etc. as per your unique business setting.
-
Workforce Productivity Tracking Report Dashboard Background PDF
The given below slide depicts the KPIs of work stream status to assess progress and stagnation. It includes elements such as budget, risk, action plan, work stream timeline, highlights etc. Showcasing this set of slides titled Workforce Productivity Tracking Report Dashboard Background PDF. The topics addressed in these templates are High Technology Turnover, Workforce Health Safety Risk, Plan Employee Training. All the content presented in this PPT design is completely editable. Download it and make adjustments in color, background, font etc. as per your unique business setting.
-
Workforce Productivity Tracking Report Kpi Dashboard Icons PDF
The following slide presents the KPAs of project work stream for transparency and better decision making. It includes KPIs such as work stream status, priority check, planned vs actual budget etc. Showcasing this set of slides titled Workforce Productivity Tracking Report Kpi Dashboard Icons PDF. The topics addressed in these templates are Initiation Meeting, Resource Assessment, Technological Analysis. All the content presented in this PPT design is completely editable. Download it and make adjustments in color, background, font etc. as per your unique business setting.
-
U S IT Operations Analysis Of Market Size Survey Report Guidelines PDF
This slide shows the graph representing the survey report prepared for analysing the market size of the U.S IT operations over the years. It shows analysis over years on the basis of predicative, visual, root cause and behavior analytics. Showcasing this set of slides titled U S IT Operations Analysis Of Market Size Survey Report Guidelines PDF. The topics addressed in these templates are Predict Analysis, Visual Analysis, Behavior Analysis. All the content presented in this PPT design is completely editable. Download it and make adjustments in color, background, font etc. as per your unique business setting.
-
IT Team Project Operations Analysis Dashboard Clipart PDF
This slide represents the dashboard showing the operational analysis of the team project of the IT department. It shows details related to investment, billed amount, completion of project, revenue by month, total days spent on project completion, customer satisfaction etc.Showcasing this set of slides titled IT Team Project Operations Analysis Dashboard Clipart PDF. The topics addressed in these templates are Revenue Investment, Complete Each Project, Customer Satisfaction. All the content presented in this PPT design is completely editable. Download it and make adjustments in color, background, font etc. as per your unique business setting.
-
Workforce Productivity Tracking Report Slide2 Professional PDF
The following slide highlights the KPIs of work streams to identify the threats and formulate strategies to mitigate its effect. It includes elements such as summary, health report etc. Pitch your topic with ease and precision using this Workforce Productivity Tracking Report Slide2 Professional PDF. This layout presents information on Sales, Issues, Budget, Workforce. It is also available for immediate download and adjustment. So, changes can be made in the color, design, graphics or any other component to create a unique layout.
-
IT Software Development Project Operations Analysis Dashboard Pictures PDF
This slide represents the dashboard showing the operational analysis of the software development project undertaken by the IT team. It shows details related to overall progress, planning, design, development, testing, risks, budget, overdue tasks etc. related to the project.Pitch your topic with ease and precision using this IT Software Development Project Operations Analysis Dashboard Pictures PDF. This layout presents information on Interactive Dashboard, Currently Over Target, Overdue Task. It is also available for immediate download and adjustment. So, changes can be made in the color, design, graphics or any other component to create a unique layout.
-
Analysis Of Diary Segment In Food Manufacturing Industry Industry Analysis Of Food Elements PDF
This slide showcase the market analysis of diary segment in food manufacturing industry providing information regarding yearly growth in milk production, top three milk producing states, species wise milk production, most exported products and top export locations.Make sure to capture your audiences attention in your business displays with our gratis customizable Analysis Of Diary Segment In Food Manufacturing Industry Industry Analysis Of Food Elements PDF. These are great for business strategies, office conferences, capital raising or task suggestions. If you desire to acquire more customers for your tech business and ensure they stay satisfied, create your own sales presentation with these plain slides.
-
IT Project Operations Analysis And Performance Dashboard Themes PDF
This slide represents the dashboard showing the operational analysis of an IT project. It includes details related to bugs-status, planned vs completed work items, work item type by priority, active bugs by severity, sprint velocity and analysis by assignee.Showcasing this set of slides titled IT Project Operations Analysis And Performance Dashboard Themes PDF. The topics addressed in these templates are Planned Completed, Sprint Analysis, Feature. All the content presented in this PPT design is completely editable. Download it and make adjustments in color, background, font etc. as per your unique business setting.
-
IT Project Change Management Operations Analysis Dashboard Infographics PDF
This slide shows the dashboard representing the operational analysis related to change management of an IT project. It shows details related to top requesting groups, outstanding change requests, outstanding age breakdown etc.Pitch your topic with ease and precision using this IT Project Change Management Operations Analysis Dashboard Infographics PDF. This layout presents information on Outstanding Requests, Outstanding Breakdown, Outstanding Changes. It is also available for immediate download and adjustment. So, changes can be made in the color, design, graphics or any other component to create a unique layout.
-
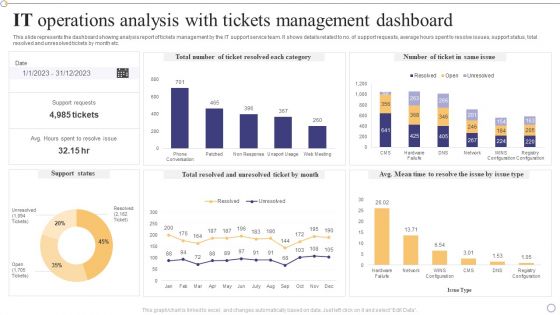
IT Operations Analysis With Tickets Management Dashboard Formats PDF
This slide represents the dashboard showing analysis report of tickets management by the IT support service team. It shows details related to no. of support requests, average hours spent to resolve issues, support status, total resolved and unresolved tickets by month etc.Showcasing this set of slides titled IT Operations Analysis With Tickets Management Dashboard Formats PDF. The topics addressed in these templates are Support Requests, Unresolved Ticket, Support Status. All the content presented in this PPT design is completely editable. Download it and make adjustments in color, background, font etc. as per your unique business setting.
-
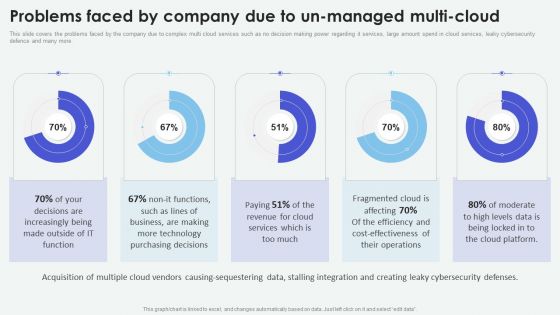
Cloud Based Computing Analysis Problems Faced By Company Due To Un Managed Guidelines PDF
This slide covers the problems faced by the company due to complex multi cloud services such as no decision making power regarding it services, large amount spend in cloud services, leaky cybersecurity defence and many more. The best PPT templates are a great way to save time, energy, and resources. Slidegeeks have 100 percent editable powerpoint slides making them incredibly versatile. With these quality presentation templates, you can create a captivating and memorable presentation by combining visually appealing slides and effectively communicating your message. Download Cloud Based Computing Analysis Problems Faced By Company Due To Un Managed Guidelines PDF from Slidegeeks and deliver a wonderful presentation.
-
Analysis Of Grains Fruits And Vegetables Segment In Food Manufacturing Industry Industry Analysis Of Food Demonstration PDF
This slide showcase the market analysis of grains fruits and vegetables in food manufacturing industry providing information regarding top states, total production both weight and value wise, key export destinations and innovations in processing equipment.Formulating a presentation can take up a lot of effort and time, so the content and message should always be the primary focus. The visuals of the PowerPoint can enhance the presenters message, so our Analysis Of Grains Fruits And Vegetables Segment In Food Manufacturing Industry Industry Analysis Of Food Demonstration PDF was created to help save time. Instead of worrying about the design, the presenter can concentrate on the message while our designers work on creating the ideal templates for whatever situation is needed. Slidegeeks has experts for everything from amazing designs to valuable content, we have put everything into Analysis Of Grains Fruits And Vegetables Segment In Food Manufacturing Industry Industry Analysis Of Food Demonstration PDF.
-
Cloud Based Computing Analysis Model For Workload Placement For On And Professional PDF
This slide covers the workload placement such as workloads shown on the left are marked as off-premises which are more suitable for a public cloud where as those on the right are for on-premises appropriate for a private cloud and those in the middle are for a hybrid cloud. Make sure to capture your audiences attention in your business displays with our gratis customizable Cloud Based Computing Analysis Model For Workload Placement For On And Professional PDF. These are great for business strategies, office conferences, capital raising or task suggestions. If you desire to acquire more customers for your tech business and ensure they stay satisfied, create your own sales presentation with these plain slides.
-
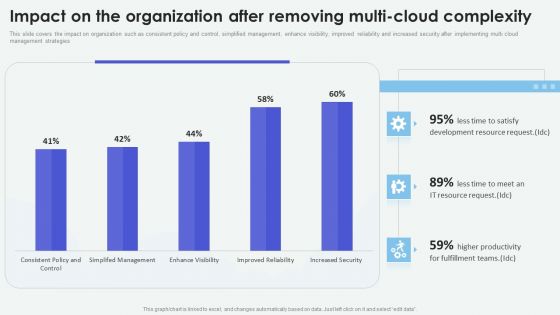
Cloud Based Computing Analysis Impact On The Organization After Removing Multi Graphics PDF
This slide covers the impact on organization such as consistent policy and control, simplified management, enhance visibility, improved reliability and increased security after implementing multi cloud management strategies. If you are looking for a format to display your unique thoughts, then the professionally designed Cloud Based Computing Analysis Impact On The Organization After Removing Multi Graphics PDF is the one for you. You can use it as a Google Slides template or a PowerPoint template. Incorporate impressive visuals, symbols, images, and other charts. Modify or reorganize the text boxes as you desire. Experiment with shade schemes and font pairings. Alter, share or cooperate with other people on your work. Download Cloud Based Computing Analysis Impact On The Organization After Removing Multi Graphics PDF and find out how to give a successful presentation. Present a perfect display to your team and make your presentation unforgettable.
-
Analysis Of Meat Segment In Food Manufacturing Industry Industry Analysis Of Food Formats PDF
This slide provides information regarding the market analysis of meat segment in food manufacturing industry in terms of leading states in meat production, species wise meat production, top exported products, opportunities in meat processing technology.Coming up with a presentation necessitates that the majority of the effort goes into the content and the message you intend to convey. The visuals of a PowerPoint presentation can only be effective if it supplements and supports the story that is being told. Keeping this in mind our experts created Analysis Of Meat Segment In Food Manufacturing Industry Industry Analysis Of Food Formats PDF to reduce the time that goes into designing the presentation. This way, you can concentrate on the message while our designers take care of providing you with the right template for the situation.
-
Cloud Based Computing Analysis Cloud Performance Tracking Dashboard Structure PDF
This slide covers the key performance indicators for tracking performance of the cloud such as violations break down, sources, rules and severity. Get a simple yet stunning designed Cloud Based Computing Analysis Cloud Performance Tracking Dashboard Structure PDF. It is the best one to establish the tone in your meetings. It is an excellent way to make your presentations highly effective. So, download this PPT today from Slidegeeks and see the positive impacts. Our easy-to-edit Cloud Based Computing Analysis Cloud Performance Tracking Dashboard Structure PDF can be your go-to option for all upcoming conferences and meetings. So, what are you waiting for Grab this template today.
-
Service Teams Performance Analysis Robotic Process Automation Metrics Dashboard Brochure PDF
This template covers KPI dashboard for measuring the impact of RPA on support team performance. It also include metrics such as average NPS, average desktop focus, application utilization, etc. Showcasing this set of slides titled Service Teams Performance Analysis Robotic Process Automation Metrics Dashboard Brochure PDF. The topics addressed in these templates are Opportunity, Production Goal Strategically, Application Utilization. All the content presented in this PPT design is completely editable. Download it and make adjustments in color, background, font etc. as per your unique business setting.
-
Employment Generated By Multiple Segments Of Food Industry Industry Analysis Of Food Sample PDF
This slide provides information regarding the employment generated by multiple segments of food manufacturing industry such as meats, bakery, beverages, grains and oil seeds in given quarter. It also visually reflects which segment is employee highest number of workers.This Employment Generated By Multiple Segments Of Food Industry Industry Analysis Of Food Sample PDF is perfect for any presentation, be it in front of clients or colleagues. It is a versatile and stylish solution for organizing your meetings. The product features a modern design for your presentation meetings. The adjustable and customizable slides provide unlimited possibilities for acing up your presentation. Slidegeeks has done all the homework before launching the product for you. So, do not wait, grab the presentation templates today.
-
Robotic Process Automation Metrics Tracker With Work Item Statistics Information PDF
This slide covers the RPA dashboard for analysing process data status. It also includes process details such as run success rate, inputs, processing, fail, output, robotic run minutes, total value generated, work items processed. Pitch your topic with ease and precision using this Robotic Process Automation Metrics Tracker With Work Item Statistics Information PDF. This layout presents information on Robotic Process Automation, Metrics Tracker, Work Item Statistics. It is also available for immediate download and adjustment. So, changes can be made in the color, design, graphics or any other component to create a unique layout.
-
Robotic Process Automation Metrics Performance Overview KPI Dashboard Download PDF
This slide showcase Robotic process automation KPI dashboard for tracking the impact of robots failure. It also include metrics such as total bots, successful bots, failed bots, average execution time, bots success rate, etc. Showcasing this set of slides titled Robotic Process Automation Metrics Performance Overview KPI Dashboard Download PDF. The topics addressed in these templates are Robotic Process Automation, Metrics Performance Overview, Kpi Dashboard. All the content presented in this PPT design is completely editable. Download it and make adjustments in color, background, font etc. as per your unique business setting.
-
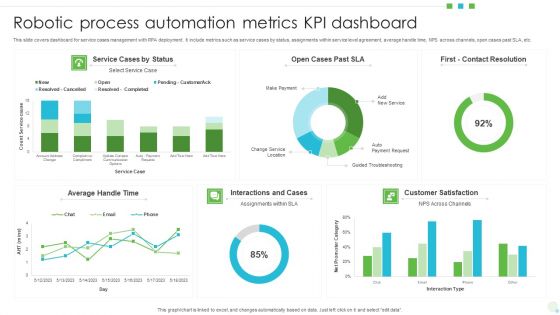
Robotic Process Automation Metrics KPI Dashboard Themes PDF
This slide covers dashboard for service cases management with RPA deployment. It include metrics such as service cases by status, assignments within service level agreement, average handle time, NPS across channels, open cases past SLA, etc. Showcasing this set of slides titled Robotic Process Automation Metrics KPI Dashboard Themes PDF. The topics addressed in these templates are Average, Service Cases, Customer Satisfaction. All the content presented in this PPT design is completely editable. Download it and make adjustments in color, background, font etc. as per your unique business setting.
-
Robotic Process Automation Metrics Dashboards For Virtual Workforce Management Background PDF
This slide displays Robotic process automation metrics for managing assigned tasks and robot performance. It also include metrics such as task running time, success runs, time automated, success rate, etc. Showcasing this set of slides titled Robotic Process Automation Metrics Dashboards For Virtual Workforce Management Background PDF. The topics addressed in these templates are Finance, Sales, Human Resource. All the content presented in this PPT design is completely editable. Download it and make adjustments in color, background, font etc. as per your unique business setting.
-
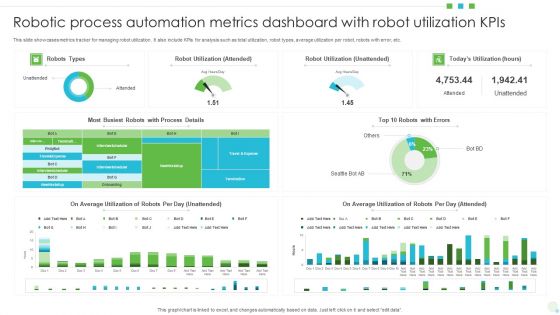
Robotic Process Automation Metrics Dashboard With Robot Utilization Kpis Background PDF
This slide showcases metrics tracker for managing robot utilization. It also include KPIs for analysis such as total utilization, robot types, average utilization per robot, robots with error, etc. Pitch your topic with ease and precision using this Robotic Process Automation Metrics Dashboard With Robot Utilization Kpis Background PDF. This layout presents information on Average Utilization, Robot Utilization, Automation Metrics Dashboard. It is also available for immediate download and adjustment. So, changes can be made in the color, design, graphics or any other component to create a unique layout.
-
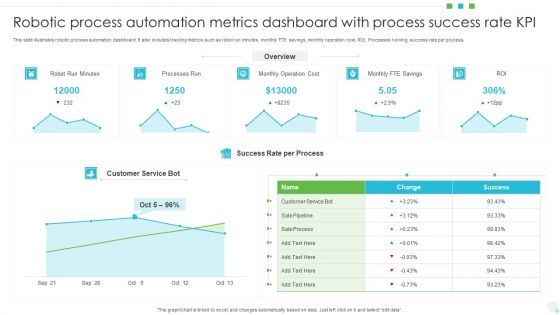
Robotic Process Automation Metrics Dashboard With Process Success Rate KPI Professional PDF
This slide illustrates robotic process automation dashboard. It also includes tracking metrics such as robot run minutes, monthly FTE savings, monthly operation cost, ROI, Processes running, success rate per process. Showcasing this set of slides titled Robotic Process Automation Metrics Dashboard With Process Success Rate KPI Professional PDF The topics addressed in these templates are Processes Run, Monthly Operation Cost, Customer Service Bot. All the content presented in this PPT design is completely editable. Download it and make adjustments in color, background, font etc. as per your unique business setting.
-
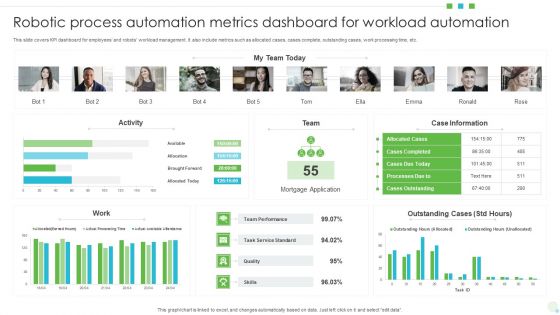
Robotic Process Automation Metrics Dashboard For Workload Automation Mockup PDF
This slide covers KPI dashboard for employees and robots workload management. It also include metrics such as allocated cases, cases complete, outstanding cases, work processing time, etc. Pitch your topic with ease and precision using this Robotic Process Automation Metrics Dashboard For Workload Automation Mockup PDF. This layout presents information on Mortgage Application, Team Performance, Case Information. It is also available for immediate download and adjustment. So, changes can be made in the color, design, graphics or any other component to create a unique layout.
-
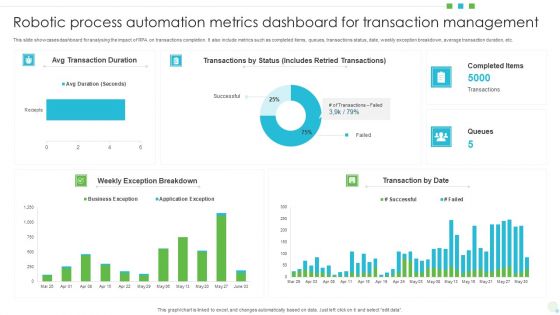
Robotic Process Automation Metrics Dashboard For Transaction Management Ideas PDF
This slide showcases dashboard for analysing the impact of RPA on transactions completion. It also include metrics such as completed items, queues, transactions status, date, weekly exception breakdown, average transaction duration, etc. Showcasing this set of slides titled Robotic Process Automation Metrics Dashboard For Transaction Management Ideas PDF. The topics addressed in these templates are Dashboard For Transaction Management, Robotic Process Automation Metrics. All the content presented in this PPT design is completely editable. Download it and make adjustments in color, background, font etc. as per your unique business setting.
-
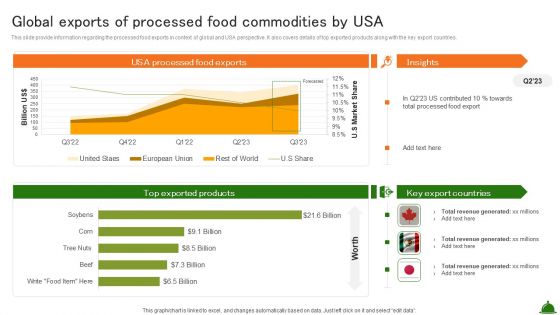
Global Exports Of Processed Food Commodities By Usa Industry Analysis Of Food Summary PDF
This slide provide information regarding the processed food exports in context of global and USA perspective. It also covers details of top exported products along with the key export countries. The Global Exports Of Processed Food Commodities By Usa Industry Analysis Of Food Summary PDF is a compilation of the most recent design trends as a series of slides. It is suitable for any subject or industry presentation, containing attractive visuals and photo spots for businesses to clearly express their messages. This template contains a variety of slides for the user to input data, such as structures to contrast two elements, bullet points, and slides for written information. Slidegeeks is prepared to create an impression.
-
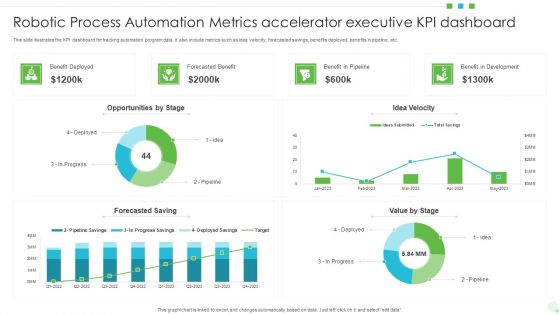
Robotic Process Automation Metrics Accelerator Executive KPI Dashboard Formats PDF
This slide illustrates the KPI dashboard for tracking automation program data. It also include metrics such as idea velocity, forecasted savings, benefits deployed, benefits in pipeline, etc. Showcasing this set of slides titled Robotic Process Automation Metrics Accelerator Executive KPI Dashboard Formats PDF. The topics addressed in these templates are Opportunities, Benefit In Development, Value. All the content presented in this PPT design is completely editable. Download it and make adjustments in color, background, font etc. as per your unique business setting.
-
Robotic Process Automation Dashboard With Monthly Test Execution KPI Icons PDF
This slide covers RPA metrics for analyzing test execution on automated platforms. It also includes test execution metrics such as total test executed, test status, tests executed daily for different operation systems, etc. Pitch your topic with ease and precision using this Robotic Process Automation Dashboard With Monthly Test Execution KPI Icons PDF. This layout presents information on Robotic Process Automation Dashboard, Monthly Test Execution Kpi. It is also available for immediate download and adjustment. So, changes can be made in the color, design, graphics or any other component to create a unique layout.
-
KPI Dashboard For Tracking Supply Chain Costs Industry Analysis Of Food Formats PDF
This slide represents the KPI dashboard to track the multiple cost associated with supply chain in food manufacturing industry. It includes information regarding cash to cash cycle in days, carry cost of inventory along with details of net sales.Find a pre-designed and impeccable KPI Dashboard For Tracking Supply Chain Costs Industry Analysis Of Food Formats PDF. The templates can ace your presentation without additional effort. You can download these easy-to-edit presentation templates to make your presentation stand out from others. So, what are you waiting for Download the template from Slidegeeks today and give a unique touch to your presentation.
-
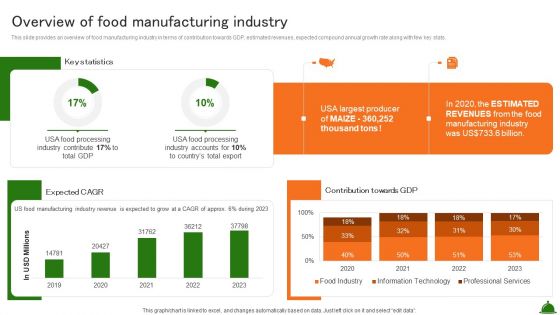
Overview Of Food Manufacturing Industry Industry Analysis Of Food Sample PDF
This slide provides an overview of food manufacturing industry in terms of contribution towards GDP, estimated revenues, expected compound annual growth rate along with few key stats.Want to ace your presentation in front of a live audience Our Overview Of Food Manufacturing Industry Industry Analysis Of Food Sample PDF can help you do that by engaging all the users towards you.. Slidegeeks experts have put their efforts and expertise into creating these impeccable powerpoint presentations so that you can communicate your ideas clearly. Moreover, all the templates are customizable, and easy-to-edit and downloadable. Use these for both personal and commercial use.
-
Human Resource Robotic Process Automation Metrics Operations Kpis With Success Rate Themes PDF
This slide covers KPI dashboard for measuring the impact of RPA deployment on the HR department. It also include metrics such as automated processes, success rate, robot utilization, robot productivity, average processes duration in hours, etc. Showcasing this set of slides titled Human Resource Robotic Process Automation Metrics Operations Kpis With Success Rate Themes PDF. The topics addressed in these templates are Processes Automated, Robot Productivity, Robot Utilization. All the content presented in this PPT design is completely editable. Download it and make adjustments in color, background, font etc. as per your unique business setting.
-
Performance Monitoring Dashboard For Consumer Goods Industry Analysis Of Food Infographics PDF
This slide showcase the performance monitoring dashboard for consumer goods providing information regarding the overview of food and beverages sales, top selling products and on shelf availability.There are so many reasons you need a Performance Monitoring Dashboard For Consumer Goods Industry Analysis Of Food Infographics PDF. The first reason is you can not spend time making everything from scratch, Thus, Slidegeeks has made presentation templates for you too. You can easily download these templates from our website easily.
-
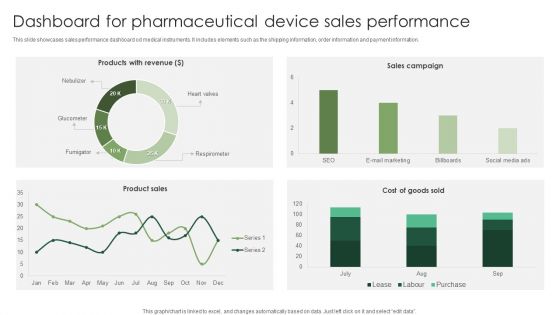
Dashboard For Pharmaceutical Device Sales Performance Graphics PDF
This slide showcases sales performance dashboard od medical instruments. It includes elements such as the shipping information, order information and payment information. Showcasing this set of slides titled Dashboard For Pharmaceutical Device Sales Performance Graphics PDF. The topics addressed in these templates are Pharmaceutical Device, Sales Performance. All the content presented in this PPT design is completely editable. Download it and make adjustments in color, background, font etc. as per your unique business setting.
-
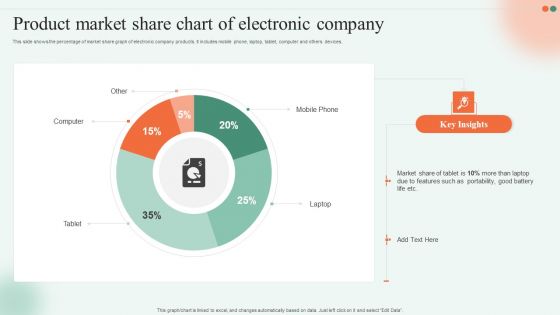
Product Market Share Chart Of Electronic Company Ppt Gallery Graphic Tips PDF
This slide shows the percentage of market share graph of electronic company products. It includes mobile phone, laptop, tablet, computer and others devices. Pitch your topic with ease and precision using this Product Market Share Chart Of Electronic Company Ppt Gallery Graphic Tips PDF. This layout presents information on Mobile Phone, Computer, Laptop, Tablet. It is also available for immediate download and adjustment. So, changes can be made in the color, design, graphics or any other component to create a unique layout.
-
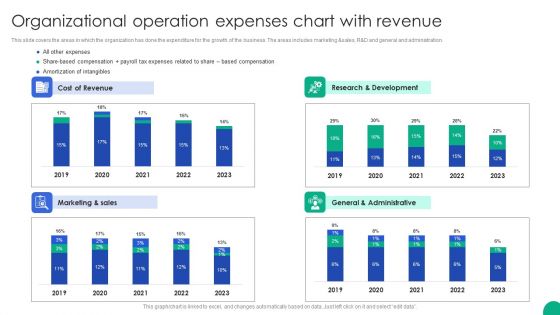
Organizational Operation Expenses Chart With Revenue Microsoft PDF
This slide covers the areas in which the organization has done the expenditure for the growth of the business. The areas includes marketing sales, R D and general and administration.Pitch your topic with ease and precision using this Organizational Operation Expenses Chart With Revenue Microsoft PDF. This layout presents information on Cost Revenue, Research Development, General Administrative. It is also available for immediate download and adjustment. So, changes can be made in the color, design, graphics or any other component to create a unique layout.
-
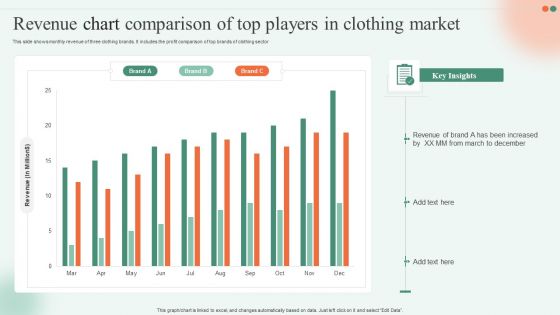
Revenue Chart Comparison Of Top Players In Clothing Market Ppt Infographics Skills PDF
This slide shows monthly revenue of three clothing brands. It includes the profit comparison of top brands of clothing sector Showcasing this set of slides titled Revenue Chart Comparison Of Top Players In Clothing Market Ppt Infographics Skills PDF. The topics addressed in these templates are Revenue, Brand, Key Insights. All the content presented in this PPT design is completely editable. Download it and make adjustments in color, background, font etc. as per your unique business setting.
-
Revenue Chart Of Abc Bank Across Global Market Ppt Icon Images PDF
This slide illustrates information about revenue generated by ABC bank in last eight years across global market. Continuous digitalization is the main contributing factor for the same. Pitch your topic with ease and precision using this Revenue Chart Of Abc Bank Across Global Market Ppt Icon Images PDF. This layout presents information on Continuous Digitalization, 2016 To 2023, Revenue. It is also available for immediate download and adjustment. So, changes can be made in the color, design, graphics or any other component to create a unique layout.
-
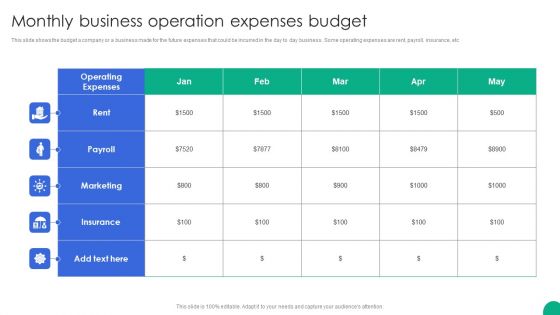
Monthly Business Operation Expenses Budget Themes PDF
This slide shows the budget a company or a business made for the future expenses that could be incurred in the day to day business . Some operating expenses are rent, payroll, insurance, etc.Showcasing this set of slides titled Monthly Business Operation Expenses Budget Themes PDF. The topics addressed in these templates are Operating Expenses, Marketing, Insurance. All the content presented in this PPT design is completely editable. Download it and make adjustments in color, background, font etc. as per your unique business setting.
-
Stock Market Chart For Analyzing Investment Behavior Ppt Icon Summary PDF
This slides shows the amount invested in stock market in last six years. It includes the comparison of investment in equity and debentures. Showcasing this set of slides titled Stock Market Chart For Analyzing Investment Behavior Ppt Icon Summary PDF. The topics addressed in these templates are Investment Stocks, 2018 To 2023, Higher Returns. All the content presented in this PPT design is completely editable. Download it and make adjustments in color, background, font etc. as per your unique business setting.
-
Health Insurance Company Expenses Of Operation Expenses Diagrams PDF
This slide shows the 3 years distribution of operating expenditure in health insurance to control drug related issues and extra expenses. This includes hospital and medical benefits , professional fees, etc.Showcasing this set of slides titled Health Insurance Company Expenses Of Operation Expenses Diagrams PDF. The topics addressed in these templates are Percentage Total Expenses, Propessional Fees, Emergency Room. All the content presented in this PPT design is completely editable. Download it and make adjustments in color, background, font etc. as per your unique business setting.
-
Graph Showing Total Operation Expenses By Quarter Themes PDF
This slide contains a graph showing the quarter wise operating expenses of an organization that will help the managers or directors of the company to make decisions for the betterment of an organization.Pitch your topic with ease and precision using this Graph Showing Total Operation Expenses By Quarter Themes PDF. This layout presents information on Operating Expenses, Equipment Purchase, Office Expansion. It is also available for immediate download and adjustment. So, changes can be made in the color, design, graphics or any other component to create a unique layout.
-
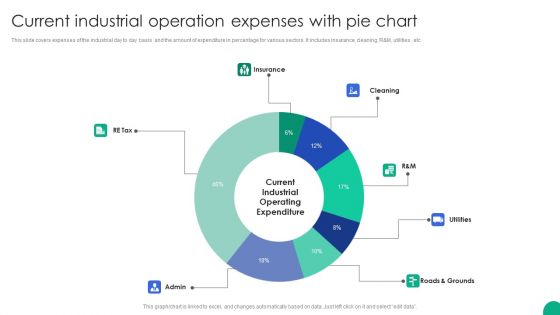
Current Industrial Operation Expenses With Pie Chart Download PDF
This slide covers expenses of the industrial day to day basis and the amount of expenditure in percentage for various sectors. It includes insurance, cleaning, R and M, utilities , etc.Showcasing this set of slides titled Current Industrial Operation Expenses With Pie Chart Download PDF. The topics addressed in these templates are Roads Grounds, Insurance, Utilities. All the content presented in this PPT design is completely editable. Download it and make adjustments in color, background, font etc. as per your unique business setting.
-
Category Wise Operation Expenses Of The Company Topics PDF
This slide displays the division of operating expenses that a company is incurring in the three financial years 2020,2021 and 2022 to compare the different expense on multiple steps.Pitch your topic with ease and precision using this Category Wise Operation Expenses Of The Company Topics PDF. This layout presents information on Travelling Expenses, Increased Restrictions, Relaxation. It is also available for immediate download and adjustment. So, changes can be made in the color, design, graphics or any other component to create a unique layout.
-
Communication Dissemination And Project Management Dashboard Inspiration PDF
This slide illustrates facts and figures related to project management and communication. It includes weekly clients meetings, project status, overdue tasks etc.Pitch your topic with ease and precision using this Communication Dissemination And Project Management Dashboard Inspiration PDF. This layout presents information on Progress Plan, Overdue Tasks, Project Status. It is also available for immediate download and adjustment. So, changes can be made in the color, design, graphics or any other component to create a unique layout.
-
Monitoring Business Information Protection Weekly Performance Summary PDF
This slide covers monitoring business security weekly performance dashboard which includes organizational financial saving and incident engagement. Pitch your topic with ease and precision using this Monitoring Business Information Protection Weekly Performance Summary PDF. This layout presents information on Active Phishing, Active Incidents, Recent Observations. It is also available for immediate download and adjustment. So, changes can be made in the color, design, graphics or any other component to create a unique layout.
-
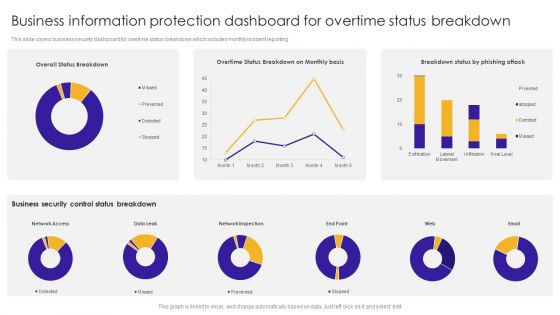
Business Information Protection Dashboard For Overtime Status Breakdown Introduction PDF
This slide covers business security dashboard for overtime status breakdown which includes monthly incident reporting.Pitch your topic with ease and precision using this Business Information Protection Dashboard For Overtime Status Breakdown Introduction PDF. This layout presents information on Business Security, Control Status Breakdown, Network Inspection. It is also available for immediate download and adjustment. So, changes can be made in the color, design, graphics or any other component to create a unique layout.
-
Monthly Sales Analysis Chart For Pharmaceutical Device Structure PDF
This slide showcases the medical equipment monthly sales summary analysis chart. It includes elements such as product name, unit price, sales volume, monthly sales of the product and product trend chart. Showcasing this set of slides titled Monthly Sales Analysis Chart For Pharmaceutical Device Structure PDF. The topics addressed in these templates are Monthly Sales Analysis, Pharmaceutical Device. All the content presented in this PPT design is completely editable. Download it and make adjustments in color, background, font etc. as per your unique business setting.
-
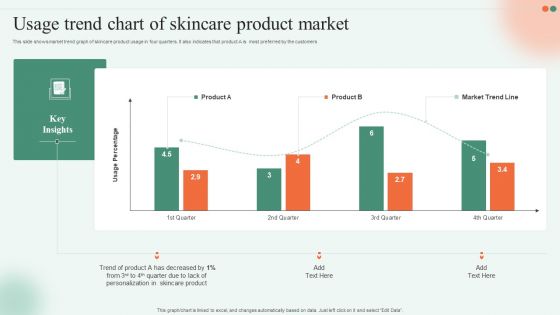
Usage Trend Chart Of Skincare Product Market Ppt Slides Graphics Download PDF
This slide shows market trend graph of skincare product usage in four quarters. It also indicates that product A is most preferred by the customers. Pitch your topic with ease and precision using this Usage Trend Chart Of Skincare Product Market Ppt Slides Graphics Download PDF. This layout presents information on Trend Product, Skincare Product, Quarter Due. It is also available for immediate download and adjustment. So, changes can be made in the color, design, graphics or any other component to create a unique layout.
-
Icons Slides For Equity Debt And Convertible Bond Investment Banking Pitch Book Guidelines PDF
Help your business to create an attention-grabbing presentation using our Icons Slides For Equity Debt And Convertible Bond Investment Banking Pitch Book Guidelines PDF set of slides. The slide contains innovative icons that can be flexibly edited. Choose this Icons Slides For Equity Debt And Convertible Bond Investment Banking Pitch Book Guidelines PDF template to create a satisfactory experience for your customers. Go ahead and click the download button.
-
Implementing CRM To Optimize Dashboard Depicting Customer Retention Analytics Icons PDF
This slide shows the dashboard that depicts customer retention analytics which includes net promoter score, customer loyalty rate, customer lifetime value, customer and revenue churn, monthly recurring revenue growth, etc. Slidegeeks is one of the best resources for PowerPoint templates. You can download easily and regulate Implementing CRM To Optimize Dashboard Depicting Customer Retention Analytics Icons PDF for your personal presentations from our wonderful collection. A few clicks is all it takes to discover and get the most relevant and appropriate templates. Use our Templates to add a unique zing and appeal to your presentation and meetings. All the slides are easy to edit and you can use them even for advertisement purposes.
-
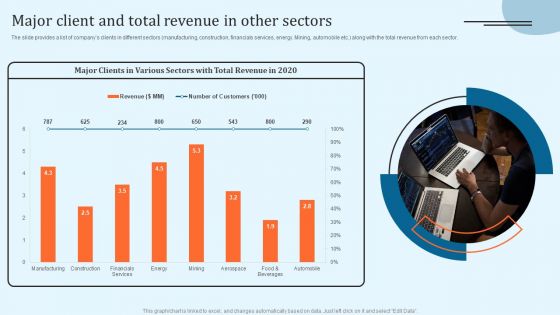
Equity Debt And Convertible Bond Investment Banking Pitch Book Major Client And Total Revenue In Other Sectors Microsoft PDF
The slide provides a list of companys clients in different sectors manufacturing, construction, financials services, energy. Mining, automobile etc. along with the total revenue from each sector. Do you know about Slidesgeeks Equity Debt And Convertible Bond Investment Banking Pitch Book Major Client And Total Revenue In Other Sectors Microsoft PDF These are perfect for delivering any kind od presentation. Using it, create PowerPoint presentations that communicate your ideas and engage audiences. Save time and effort by using our pre designed presentation templates that are perfect for a wide range of topic. Our vast selection of designs covers a range of styles, from creative to business, and are all highly customizable and easy to edit. Download as a PowerPoint template or use them as Google Slides themes.
-
Equity Debt And Convertible Bond Investment Banking Pitch Book Rationale For Follow On Equity Offering Sample PDF
The slide provides the rationale for follow on equity offering which includes price volume over the past year in relation to share price, etc. Find a pre designed and impeccable Equity Debt And Convertible Bond Investment Banking Pitch Book Rationale For Follow On Equity Offering Sample PDF. The templates can ace your presentation without additional effort. You can download these easy to edit presentation templates to make your presentation stand out from others. So, what are you waiting for Download the template from Slidegeeks today and give a unique touch to your presentation.
-
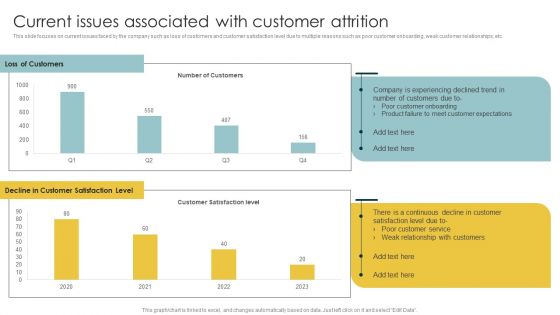
Implementing CRM To Optimize Current Issues Associated With Customer Attrition Clipart PDF
This slide focuses on current issues faced by the company such as loss of customers and customer satisfaction level due to multiple reasons such as poor customer onboarding, weak customer relationships, etc. Do you know about Slidesgeeks Implementing CRM To Optimize Current Issues Associated With Customer Attrition Clipart PDF These are perfect for delivering any kind od presentation. Using it, create PowerPoint presentations that communicate your ideas and engage audiences. Save time and effort by using our pre-designed presentation templates that are perfect for a wide range of topic. Our vast selection of designs covers a range of styles, from creative to business, and are all highly customizable and easy to edit. Download as a PowerPoint template or use them as Google Slides themes.
-
Dashboard To Measure Business Financial Performance Summary PDF
This slide shows the dashboard to measure business financial performance which focuses on revenues, debt to equity, net profit margin, gross profit margin and return on equity. Are you searching for a Dashboard To Measure Business Financial Performance Summary PDF that is uncluttered, straightforward, and original Its easy to edit, and you can change the colors to suit your personal or business branding. For a presentation that expresses how much effort youve put in, this template is ideal With all of its features, including tables, diagrams, statistics, and lists, its perfect for a business plan presentation. Make your ideas more appealing with these professional slides. Download Dashboard To Measure Business Financial Performance Summary PDF from Slidegeeks today.

 Home
Home 


