Charts and Graphs
-
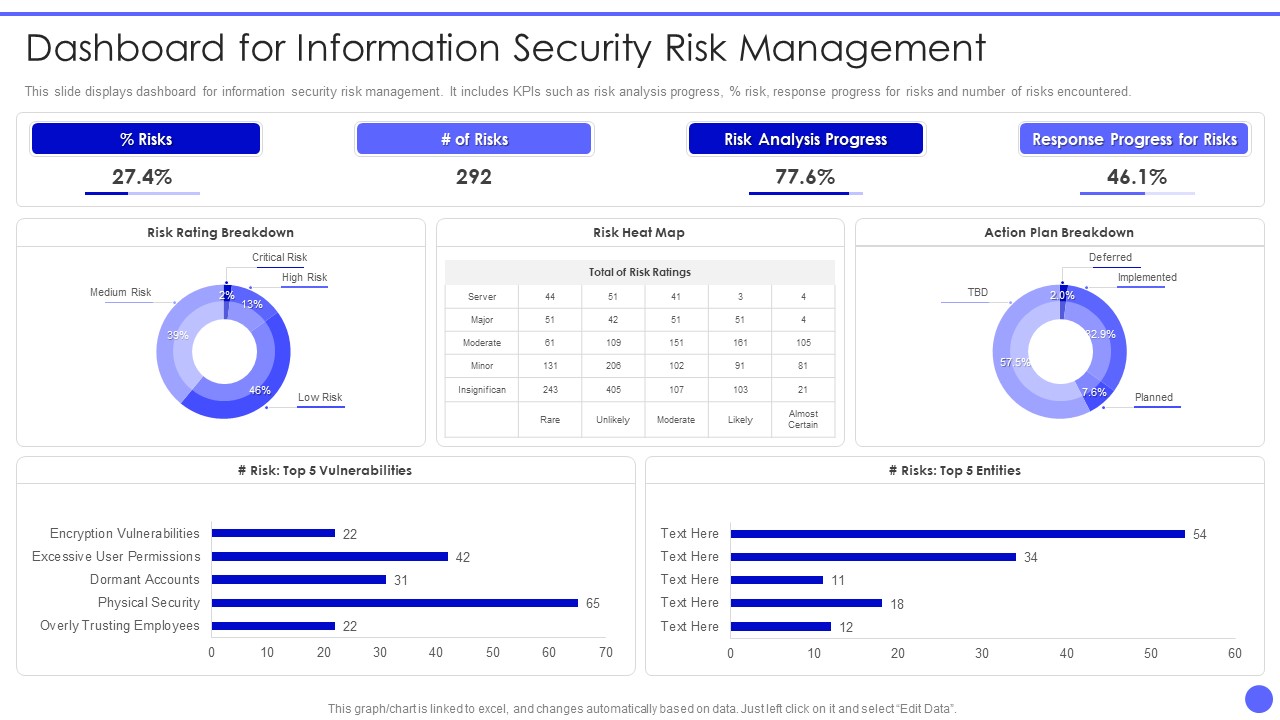
Info Safety And ISO 27001 Dashboard For Information Security Risk Management Information PDF
This slide displays dashboard for information security risk management. It includes KPIs such as risk analysis progress, percent risk, response progress for risks and number of risks encountered. Deliver and pitch your topic in the best possible manner with this Info Safety And ISO 27001 Dashboard For Information Security Risk Management Information PDF. Use them to share invaluable insights on Risks, Risk Analysis Progress, Response Progress for Risks, Risk Rating Breakdown and impress your audience. This template can be altered and modified as per your expectations. So, grab it now.
-
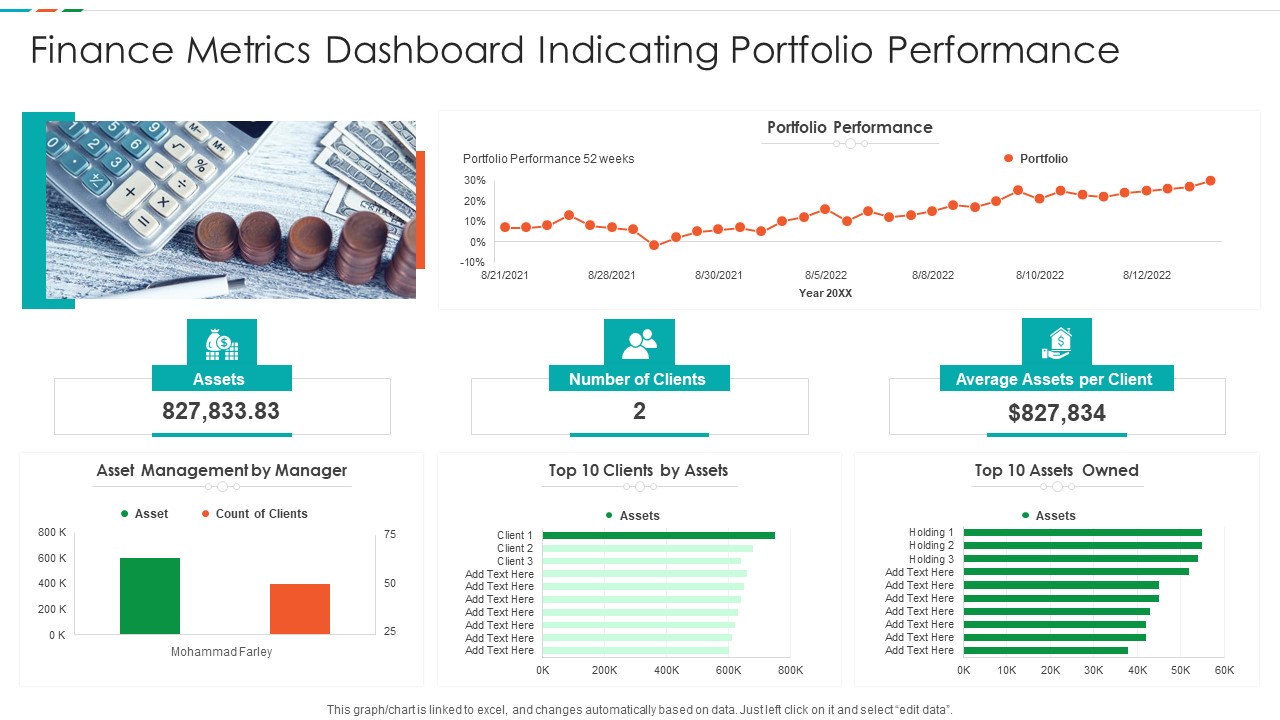
Finance Metrics Dashboard Indicating Portfolio Performance Microsoft PDF
This graph or chart is linked to excel, and changes automatically based on data. Just left click on it and select edit data. Pitch your topic with ease and precision using this Finance Metrics Dashboard Indicating Portfolio Performance Microsoft PDF. This layout presents information on Portfolio Performance Portfolio, Asset Management Manager, Top 10 Assets. It is also available for immediate download and adjustment. So, changes can be made in the color, design, graphics or any other component to create a unique layout.
-
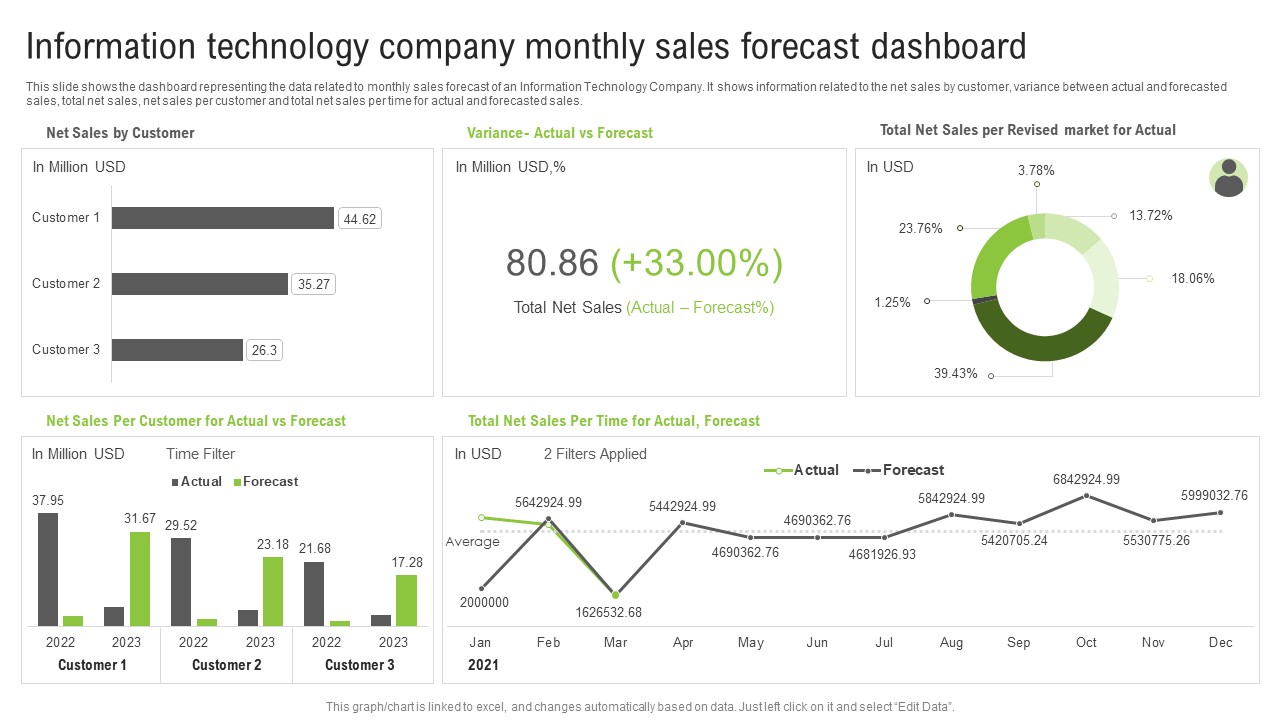
Information Technology Company Monthly Sales Forecast Dashboard Ppt Portfolio Images PDF
This slide shows the dashboard representing the data related to monthly sales forecast of an Information Technology Company. It shows information related to the net sales by customer, variance between actual and forecasted sales, total net sales, net sales per customer and total net sales per time for actual and forecasted sales. Pitch your topic with ease and precision using this Information Technology Company Monthly Sales Forecast Dashboard Ppt Portfolio Images PDF. This layout presents information on Total Net Sales, Actual vs Forecast, Net Sales Customer. It is also available for immediate download and adjustment. So, changes can be made in the color, design, graphics or any other component to create a unique layout.
-
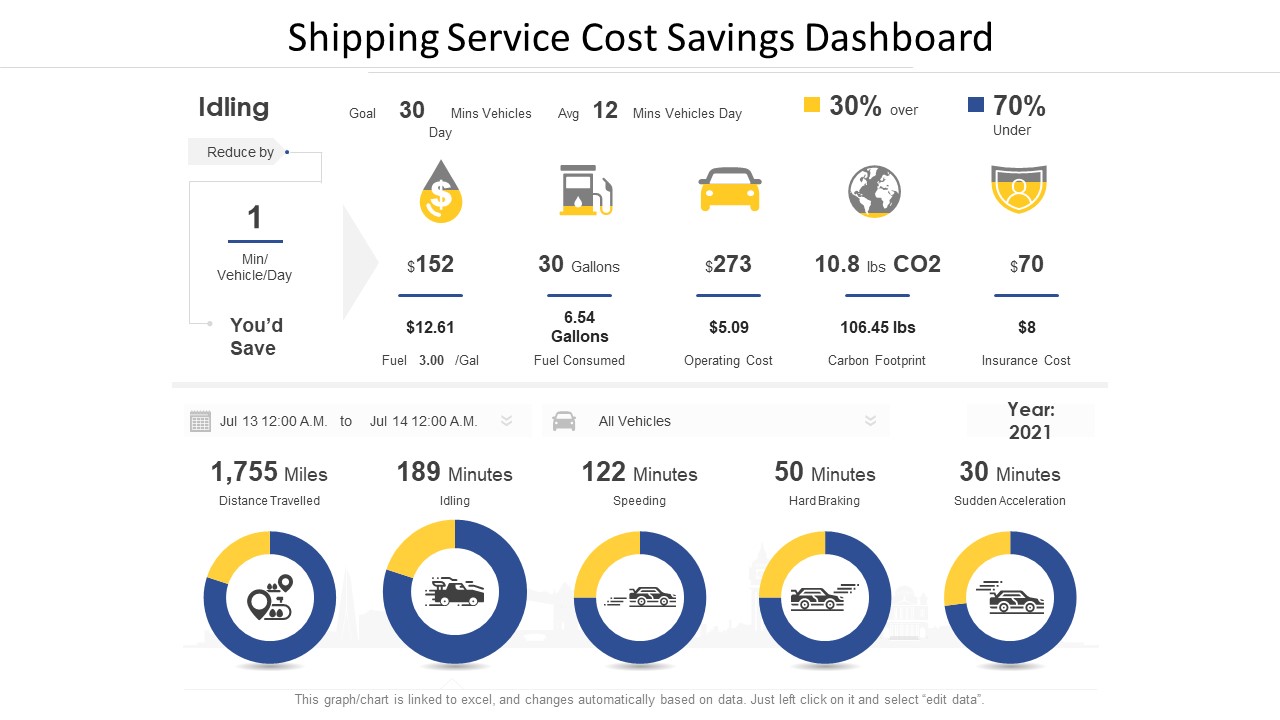
Shipping Service Cost Savings Dashboard Ppt Portfolio Files PDF
Showcasing this set of slides titled shipping service cost savings dashboard ppt portfolio files pdf. The topics addressed in these templates are shipping service cost savings dashboard . All the content presented in this PPT design is completely editable. Download it and make adjustments in color, background, font etc. as per your unique business setting.
-
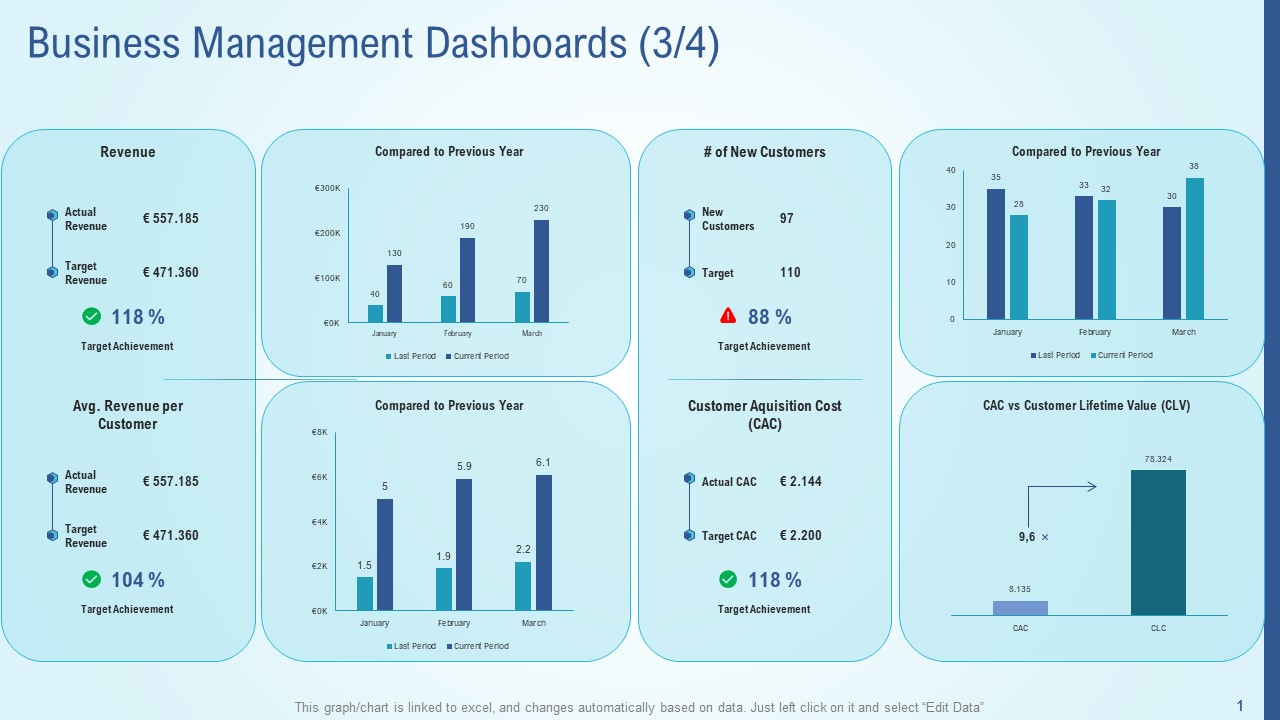
Business Management Dashboards Revenue Business Analysis Method Ppt Inspiration Icon PDF
Deliver and pitch your topic in the best possible manner with this business management dashboards revenue business analysis method ppt inspiration icon pdf. Use them to share invaluable insights on cost, revenue, acquisition, revenue, target and impress your audience. This template can be altered and modified as per your expectations. So, grab it now.
-
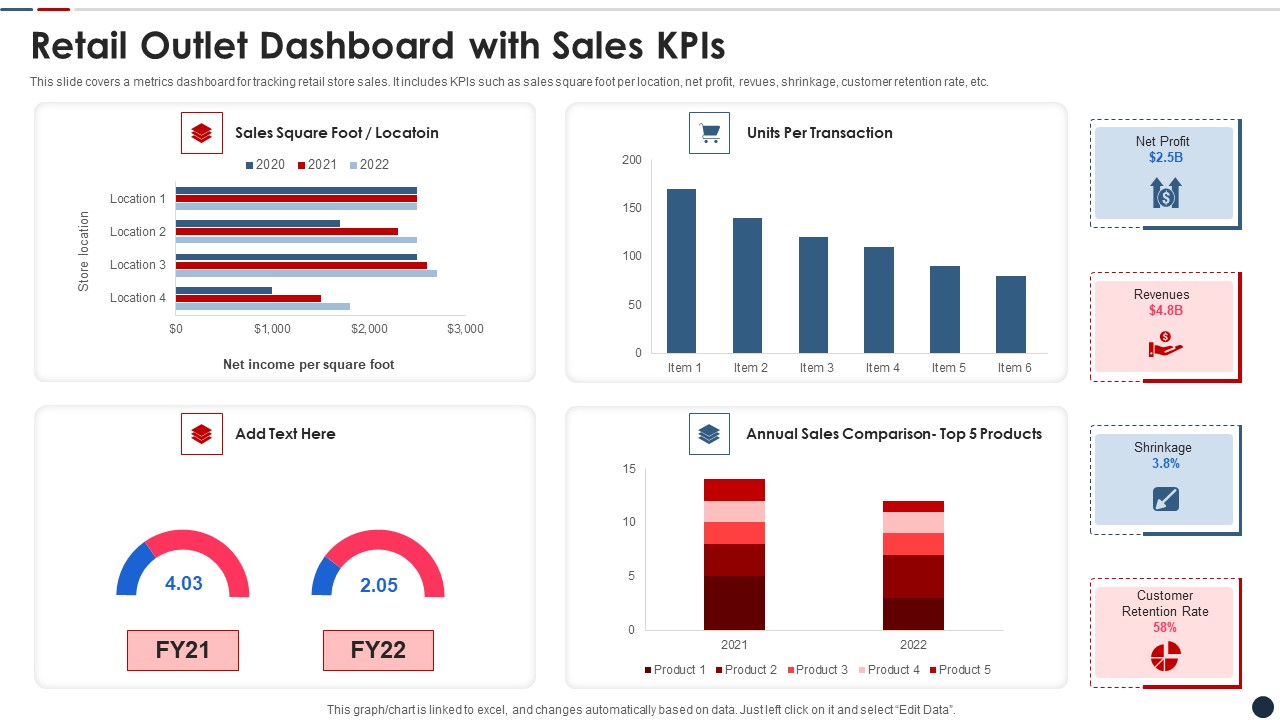
Retail Outlet Dashboard With Sales Kpis Clipart PDF
This slide covers a metrics dashboard for tracking retail store sales. It includes KPIs such as sales square foot per location, net profit, revues, shrinkage, customer retention rate, etc. Pitch your topic with ease and precision using this retail outlet dashboard with sales kpis clipart pdf This layout presents information on Retail outlet dashboard with sales kpis It is also available for immediate download and adjustment. So, changes can be made in the color, design, graphics or any other component to create a unique layout.
-
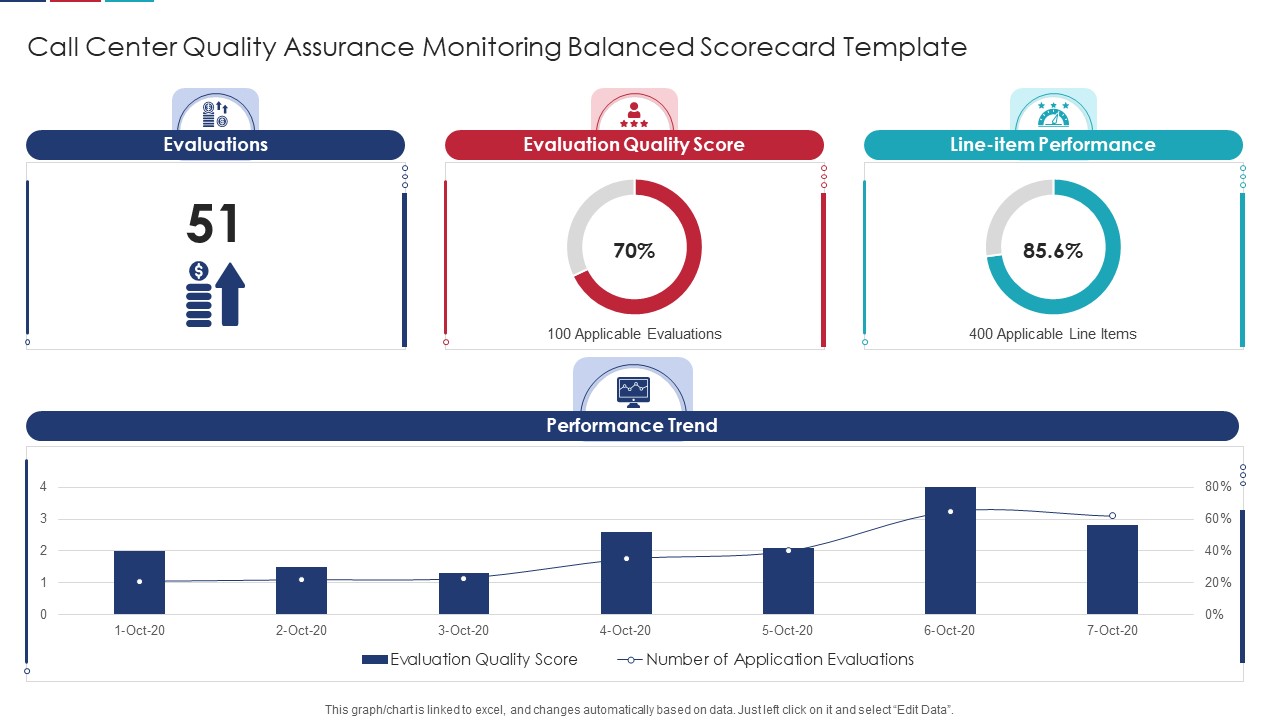
Call Center Quality Assurance Monitoring Balanced Scorecard Template Formats PDF
Deliver and pitch your topic in the best possible manner with this Call Center Quality Assurance Monitoring Balanced Scorecard Template Formats PDF Use them to share invaluable insights on Evaluation Quality, Line Performance, Evaluations and impress your audience. This template can be altered and modified as per your expectations. So, grab it now.
-
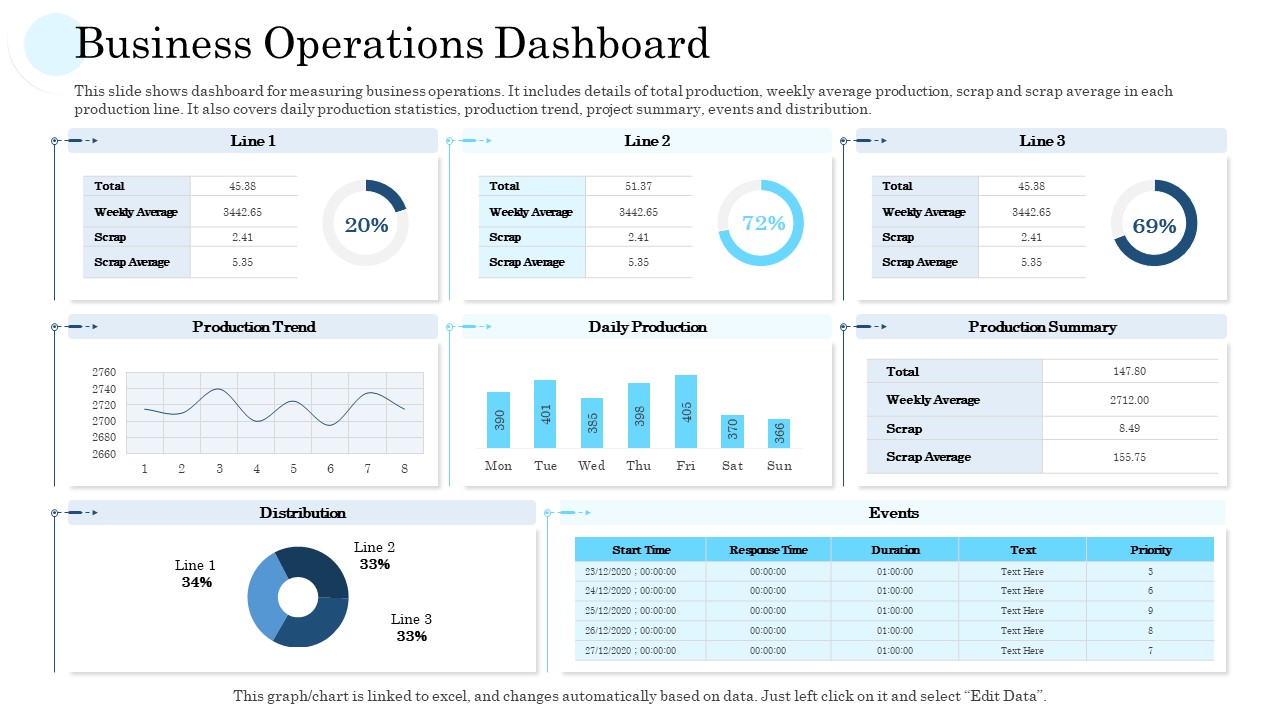
Business Operations Dashboard Ppt PowerPoint Presentation Styles Pictures PDF
This slide shows dashboard for measuring business operations. It includes details of total production, weekly average production, scrap and scrap average in each production line. It also covers daily production statistics, production trend, project summary, events and distribution.Deliver an awe-inspiring pitch with this creative business operations dashboard ppt powerpoint presentation styles pictures pdf. bundle. Topics like production trend, daily production, production summary, distribution can be discussed with this completely editable template. It is available for immediate download depending on the needs and requirements of the user.
-
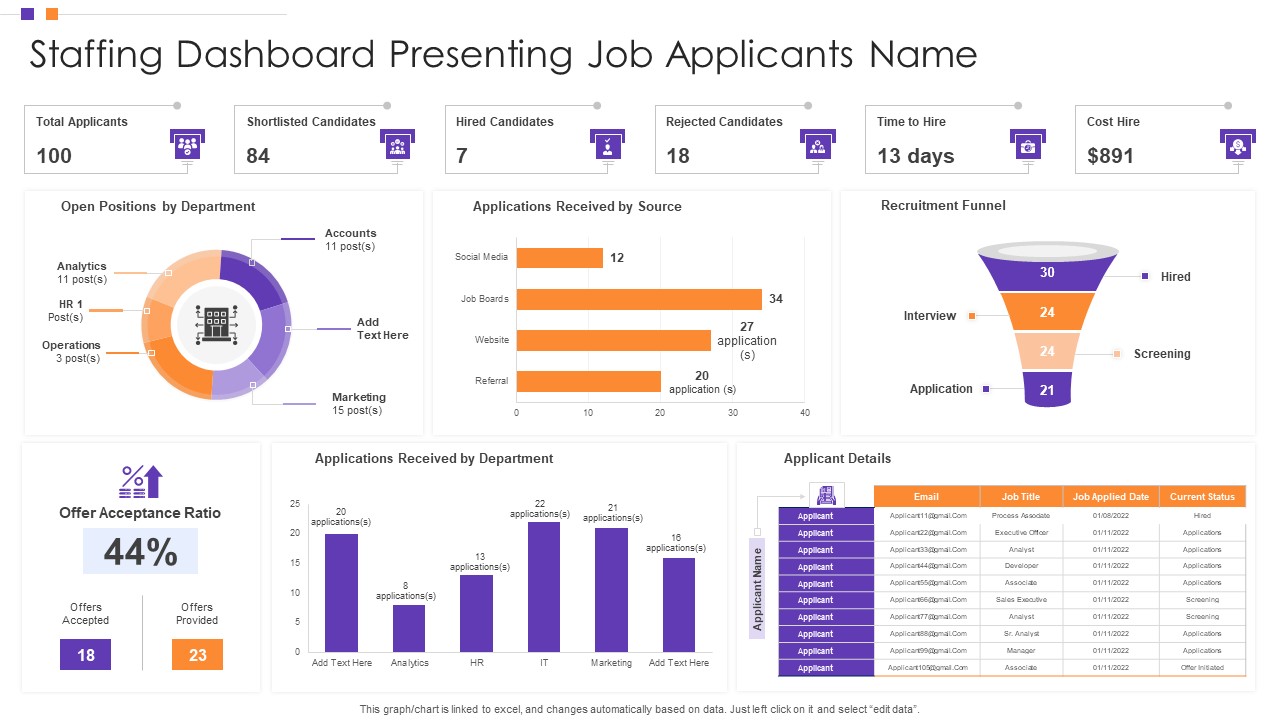
Staffing Dashboard Presenting Job Applicants Name Background PDF
Showcasing this set of slides titled Staffing Dashboard Presenting Job Applicants Name Background PDF The topics addressed in these templates are Shortlisted Candidates, Received By Department, Recruitment Funnel All the content presented in this PPT design is completely editable. Download it and make adjustments in color, background, font etc. as per your unique business setting.
-
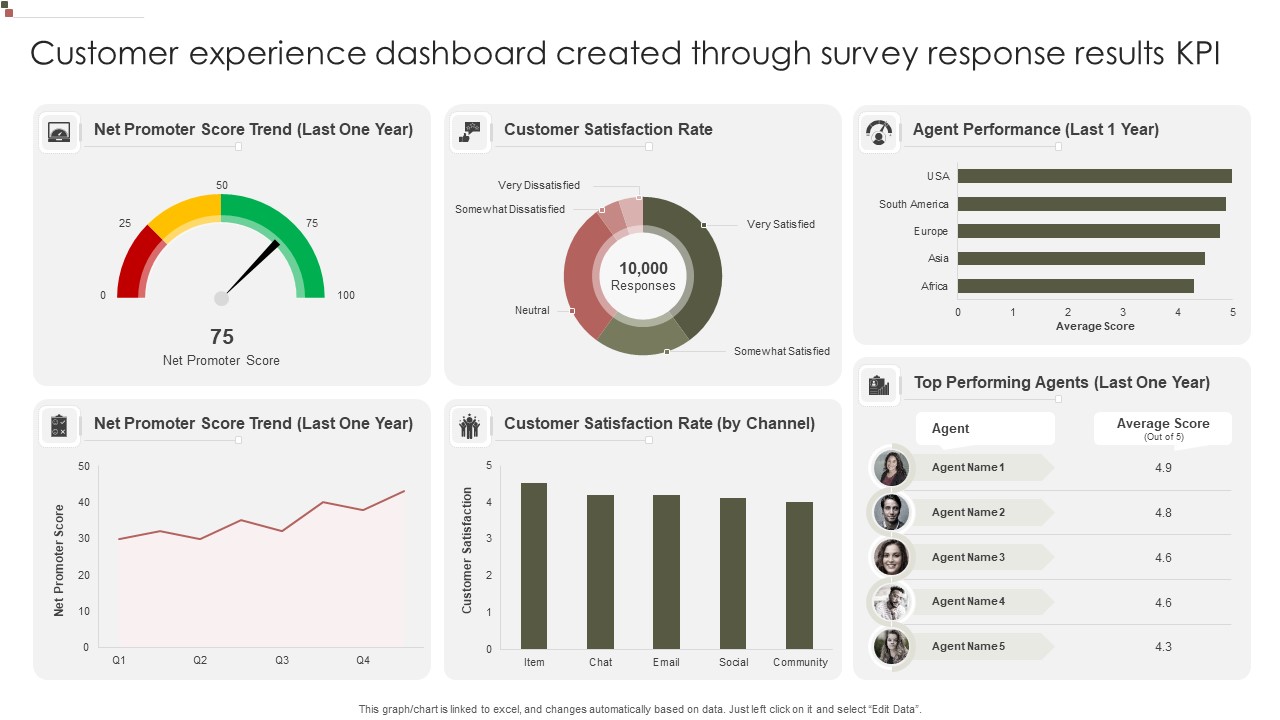
Customer Experience Dashboard Created Through Survey Response Results KPI Mockup PDF
Showcasing this set of slides titled Customer Experience Dashboard Created Through Survey Response Results KPI Mockup PDF. The topics addressed in these templates are Promoter Score, Customer Satisfaction, Agent Performance. All the content presented in this PPT design is completely editable. Download it and make adjustments in color, background, font etc. as per your unique business setting.
-
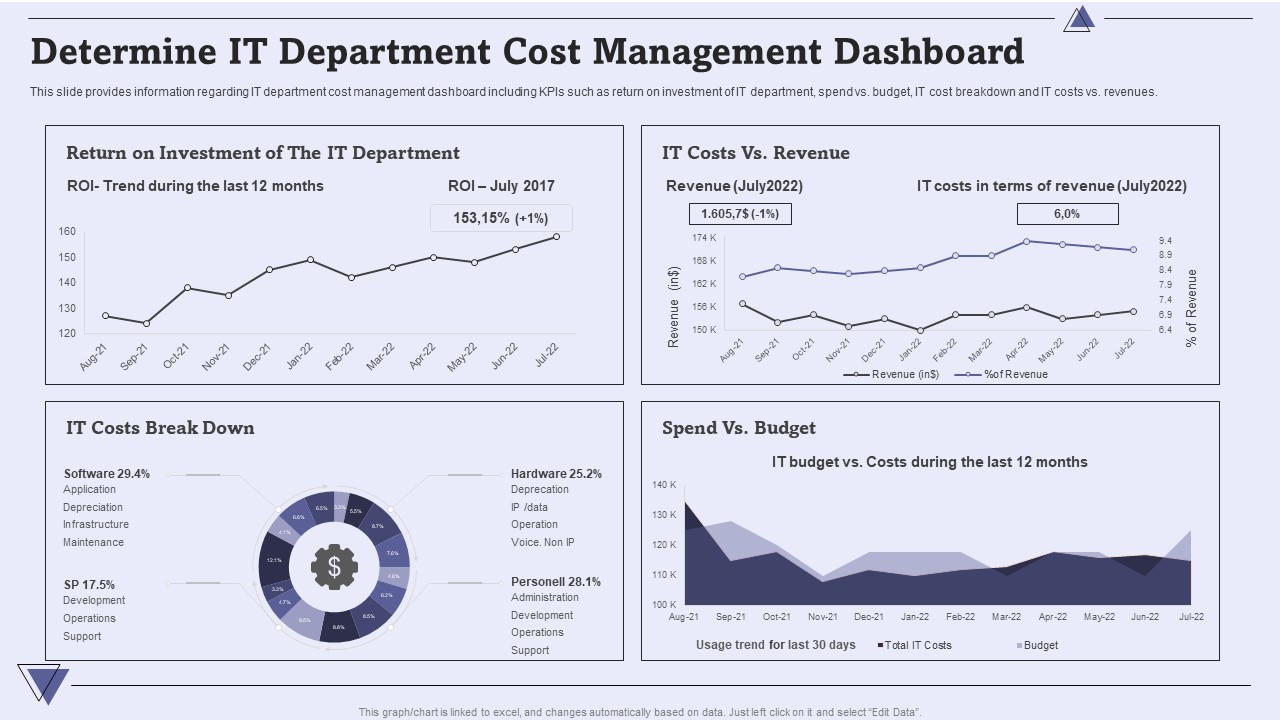
CIO For IT Cost Optimization Techniques Determine IT Department Cost Management Dashboard Introduction PDF
This slide provides information regarding IT department cost management dashboard including KPIs such as return on investment of IT department, spend vs. budget, IT cost breakdown and IT costs vs. revenues. Deliver and pitch your topic in the best possible manner with this CIO For IT Cost Optimization Techniques Determine IT Department Cost Management Dashboard Introduction PDF. Use them to share invaluable insights on Costs, Budget, Revenue and impress your audience. This template can be altered and modified as per your expectations. So, grab it now.
-
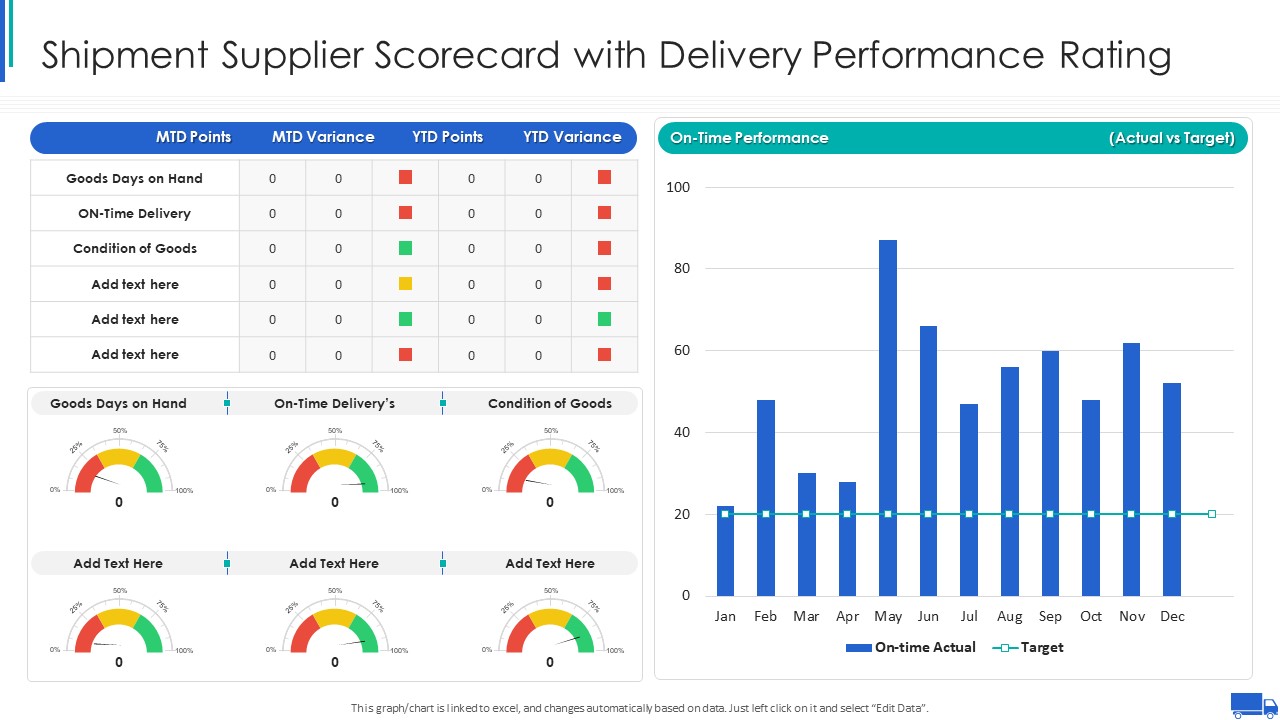
Shipment Supplier Scorecard With Delivery Performance Rating Ppt Ideas Graphic Tips PDF
This graph or chart is linked to excel, and changes automatically based on data. Just left click on it and select Edit Data. Deliver an awe inspiring pitch with this creative Shipment Supplier Scorecard With Delivery Performance Rating Ppt Ideas Graphic Tips PDF bundle. Topics like On Time Performance, Actual Vs Target, Goods Days Hand can be discussed with this completely editable template. It is available for immediate download depending on the needs and requirements of the user.
-
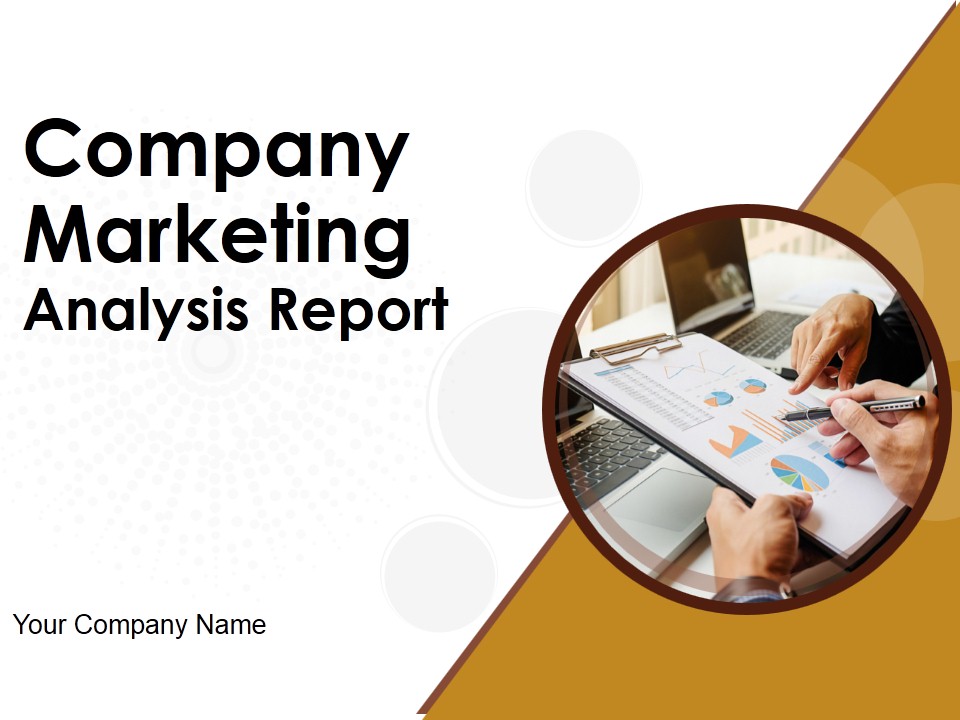
Company Marketing Analysis Report Ppt PowerPoint Presentation Complete Deck With Slides
This is a company marketing analysis report ppt powerpoint presentation complete deck with slides. This is a one stage process. The stages in this process are marketing, business, hand, report, financial.
-
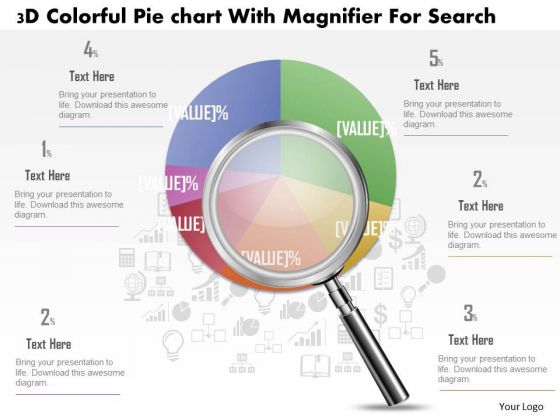
Business Diagram 3d Colorful Pie Graph With Magnifier Data Search PowerPoint Slide
This business slide displays 3d colorful pie graph with magnifier. This diagram is a data visualization tool that gives you a simple way to present statistical information. This slide helps your audience examine and interpret the data you present.
-
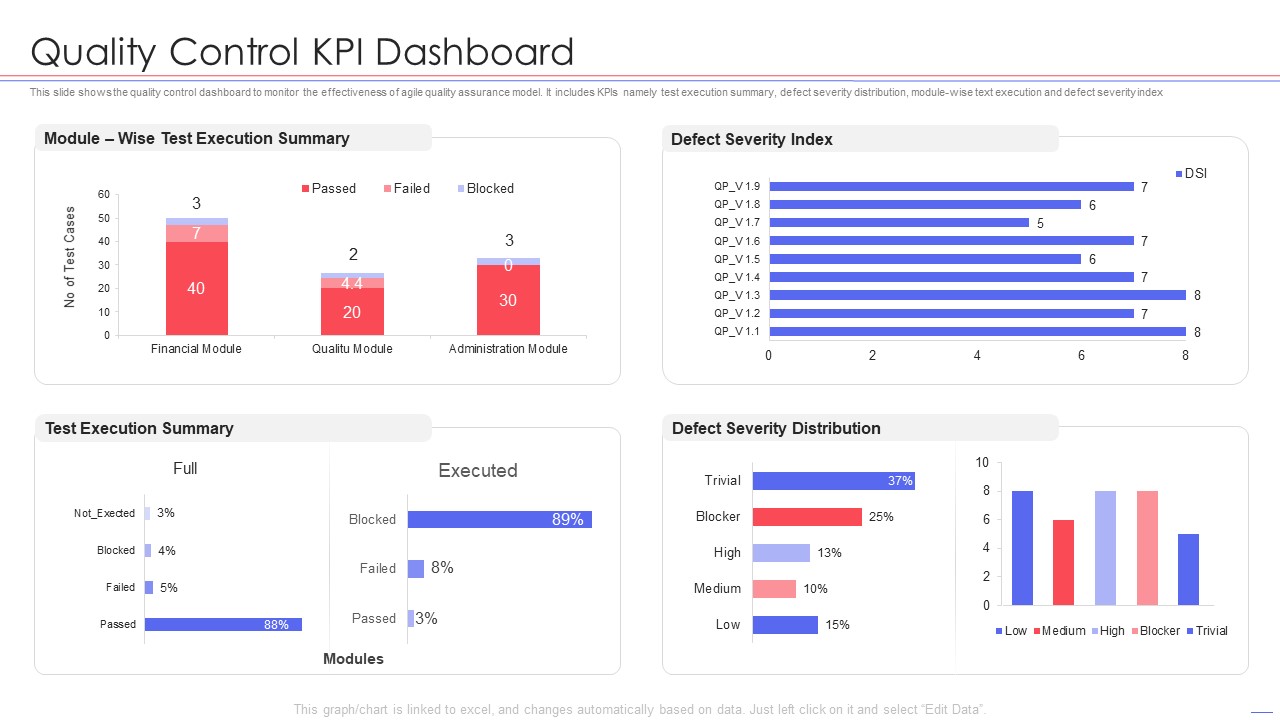
Agile QA Procedure Quality Control Kpi Dashboard Topics PDF
This slide shows the quality control dashboard to monitor the effectiveness of agile quality assurance model. It includes KPIs namely test execution summary, defect severity distribution, module wise text execution and defect severity index. Deliver an awe inspiring pitch with this creative agile qa procedure quality control kpi dashboard topics pdf bundle. Topics like quality control kpi dashboard can be discussed with this completely editable template. It is available for immediate download depending on the needs and requirements of the user.
-
HR Recruitment Dashboard Kpis With Recruitment Cost Ppt Inspiration Icons PDF
This slide showcases the recruitment dashboard of company of Hr department. It include time to hire days, cost, source, department, funnel no. of applications, male female ratio. Showcasing this set of slides titled HR Recruitment Dashboard Kpis With Recruitment Cost Ppt Inspiration Icons PDF. The topics addressed in these templates are Recruitment Funnel, Operational Dashboard, Application Date. All the content presented in this PPT design is completely editable. Download it and make adjustments in color, background, font etc. as per your unique business setting.
-
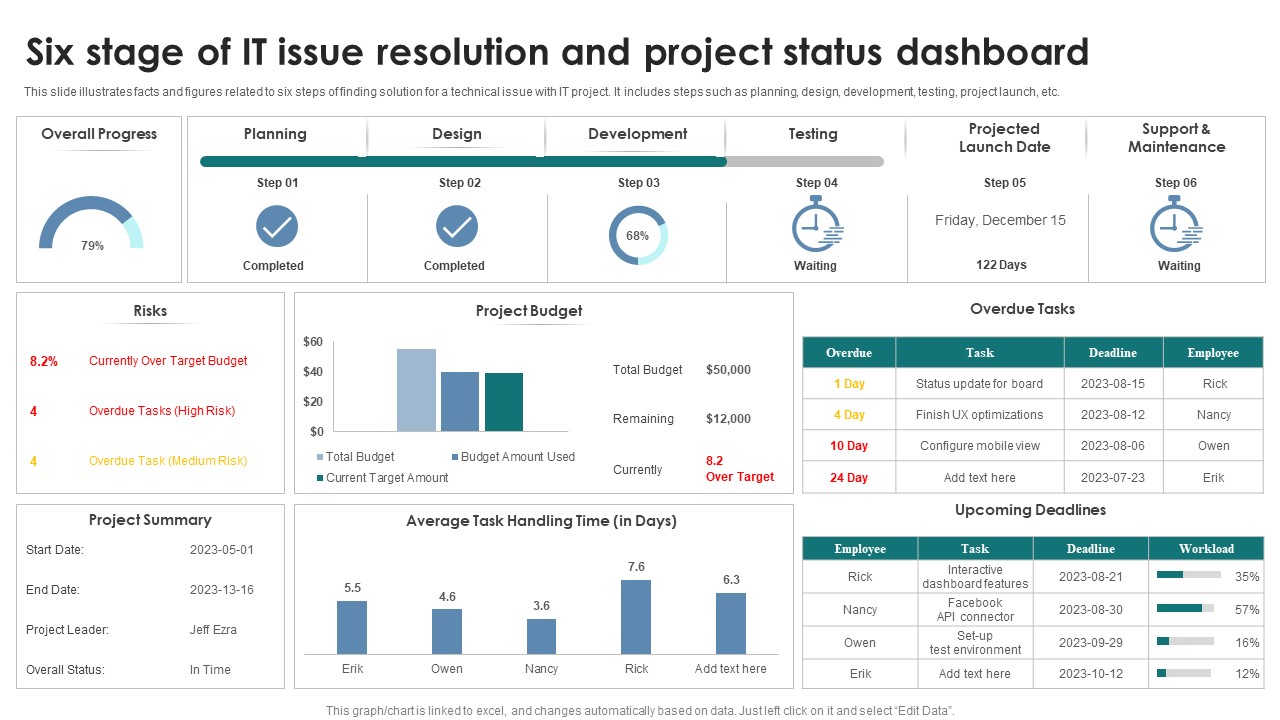
Six Stage Of IT Issue Resolution And Project Status Dashboard Topics PDF
This slide illustrates facts and figures related to six steps of finding solution for a technical issue with IT project. It includes steps such as planning, design, development, testing, project launch, etc. Showcasing this set of slides titled Six Stage Of IT Issue Resolution And Project Status Dashboard Topics PDF. The topics addressed in these templates are Planning, Design, Development. All the content presented in this PPT design is completely editable. Download it and make adjustments in color, background, font etc. as per your unique business setting.
-
Devops Activities Management Dashboard Average Icons PDF
This slide provides information regarding essential DevOps activities management dashboard in terms of revenue by hour, storefront users, errors by host, response time by app, etc. Deliver and pitch your topic in the best possible manner with this devops activities management dashboard average icons pdf. Use them to share invaluable insights on devops activities management dashboard and impress your audience. This template can be altered and modified as per your expectations. So, grab it now.
-
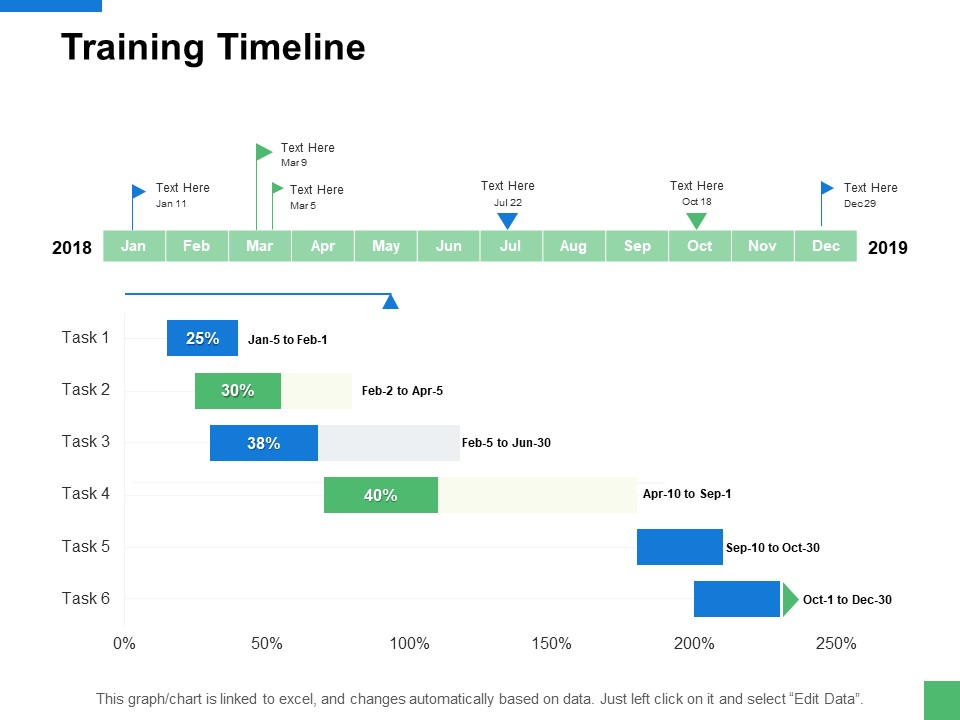
Training Timeline Process Ppt PowerPoint Presentation Portfolio Clipart Images
Presenting this set of slides with name training timeline process ppt powerpoint presentation portfolio clipart images. The topics discussed in these slides are finance, marketing, management, investment, analysis. This is a completely editable PowerPoint presentation and is available for immediate download. Download now and impress your audience.
-
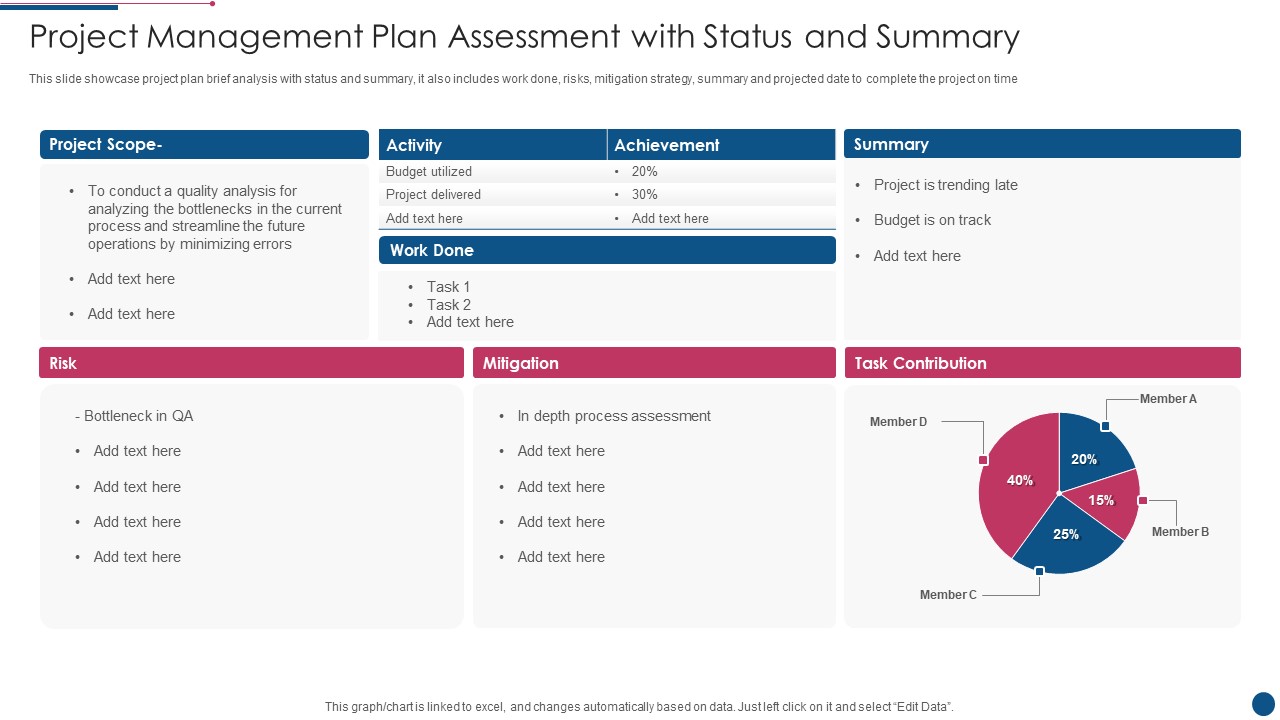
Project Management Plan Assessment With Status And Summary Download PDF
This slide showcase project plan brief analysis with status and summary, it also includes work done, risks, mitigation strategy, summary and projected date to complete the project on time. Showcasing this set of slides titled Project Management Plan Assessment With Status And Summary Download PDF. The topics addressed in these templates are Analysis, Budget Utilized, Achievement. All the content presented in this PPT design is completely editable. Download it and make adjustments in color, background, font etc. as per your unique business setting.
-
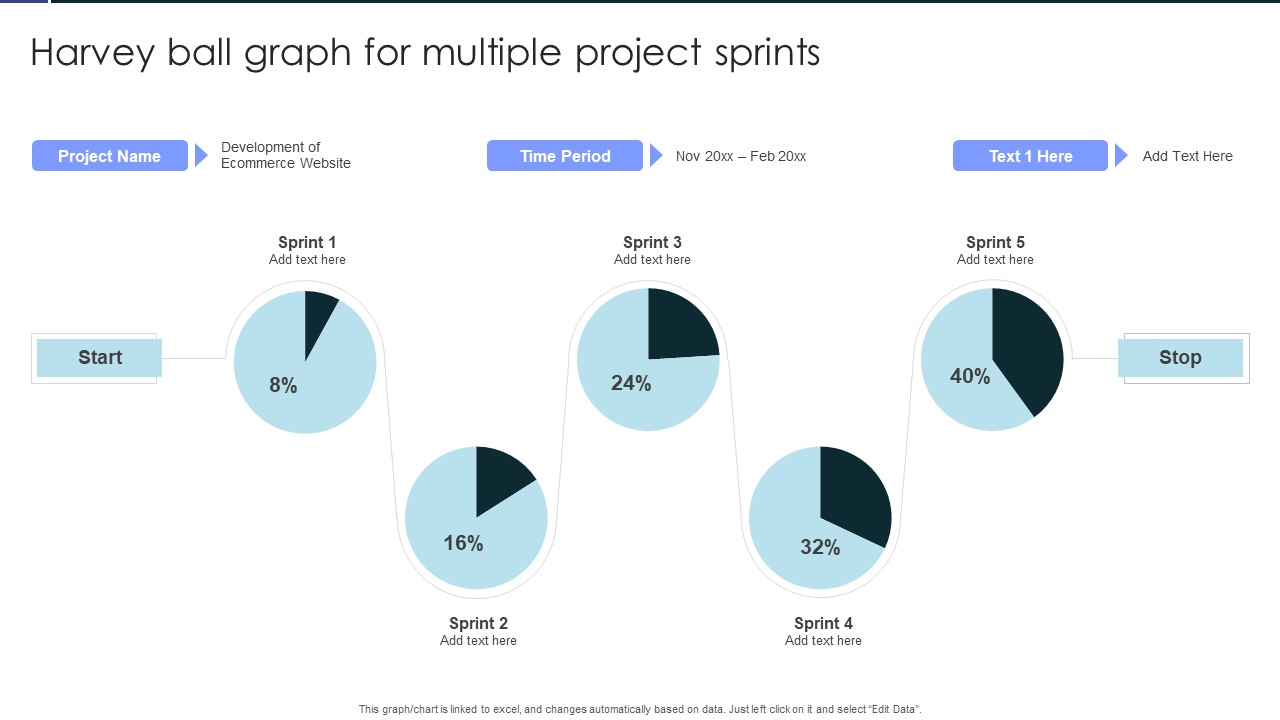
Harvey Ball Graph For Multiple Project Sprints Background PDF
Pitch your topic with ease and precision using this Harvey Ball Graph For Multiple Project Sprints Background PDF. This layout presents information on Harvey Ball Graph, For Multiple, Project Sprints. It is also available for immediate download and adjustment. So, changes can be made in the color, design, graphics or any other component to create a unique layout.
-
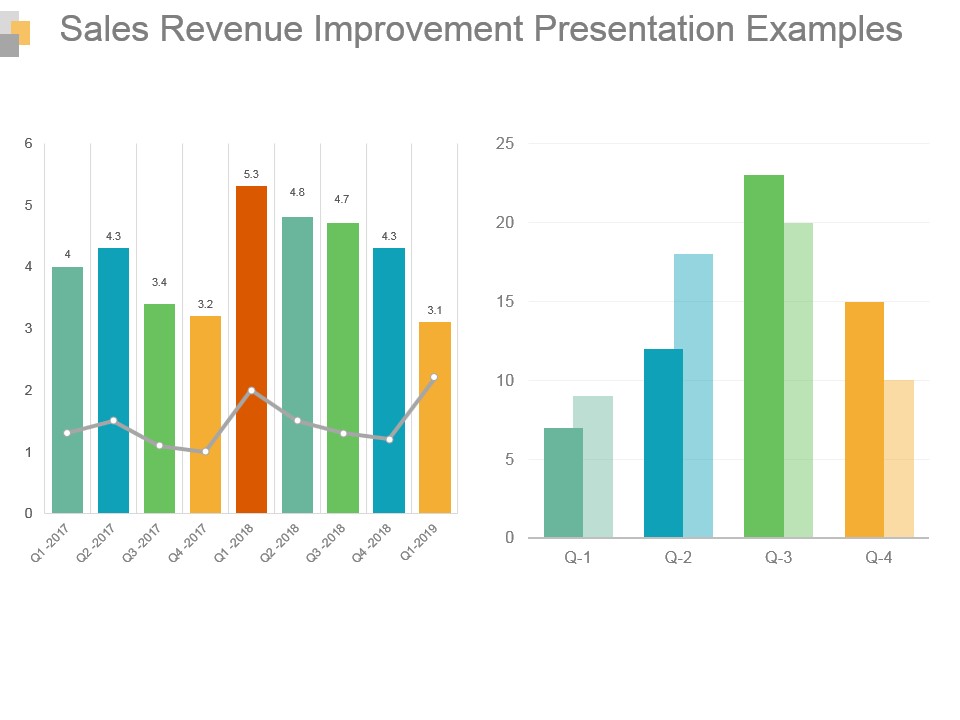
Sales Revenue Improvement Presentation Examples
This is a sales revenue improvement presentation examples. This is a two stage process. The stages in this process are bar graph, growth, sales, data, analysis.
-
6 Segments Pie Chart For Data Representation Ppt PowerPoint Presentation Icon Graphics
This is a 6 segments pie chart for data representation ppt powerpoint presentation icon graphics. This is a six stage process. The stages in this process are 6 piece pie chart, 6 segment pie chart, 6 parts pie chart.
-
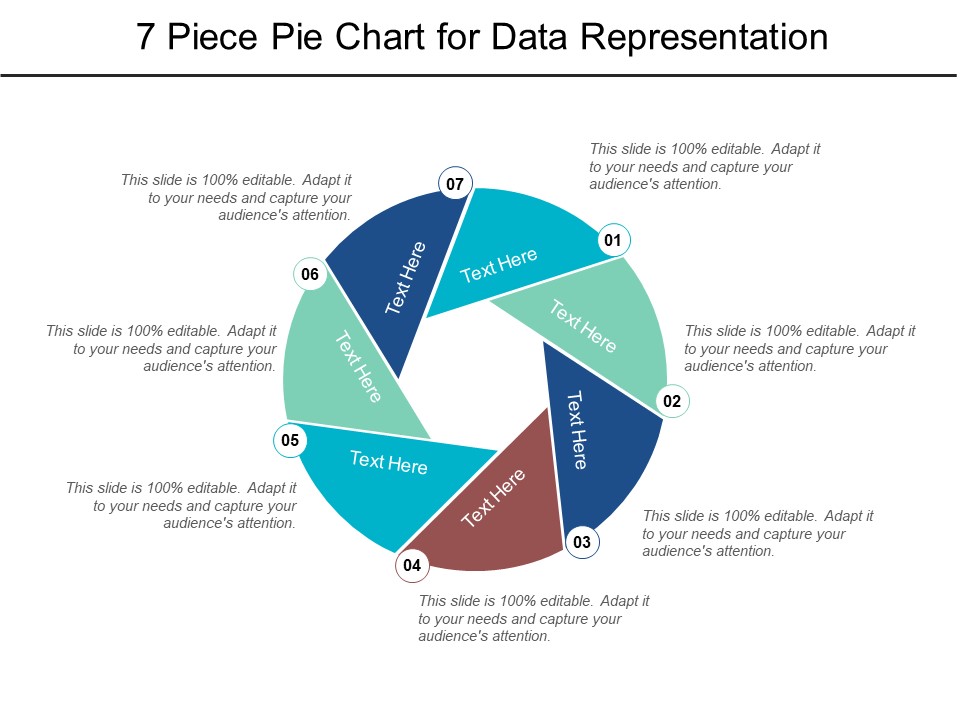
7 Piece Pie Chart For Data Representation Ppt PowerPoint Presentation Portfolio Graphics
This is a 7 piece pie chart for data representation ppt powerpoint presentation portfolio graphics. This is a seven stage process. The stages in this process are 6 piece pie chart, 6 segment pie chart, 6 parts pie chart.
-
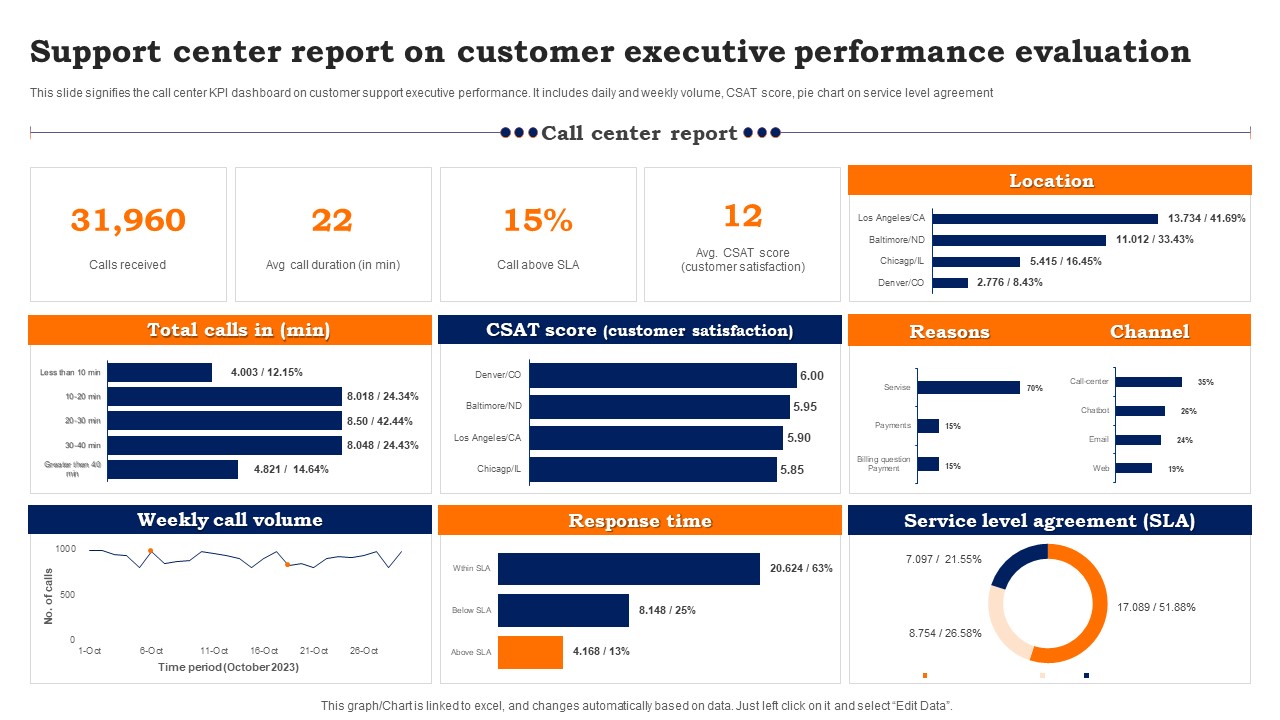
Support Center Report On Customer Executive Performance Evaluation Background PDF
This slide signifies the call center KPI dashboard on customer support executive performance. It includes daily and weekly volume, CSAT score, pie chart on service level agreement. Pitch your topic with ease and precision using this Support Center Report On Customer Executive Performance Evaluation Background PDF. This layout presents information on Weekly Call Volume, Response Time, Service Level Agreement. It is also available for immediate download and adjustment. So, changes can be made in the color, design, graphics or any other component to create a unique layout.
-
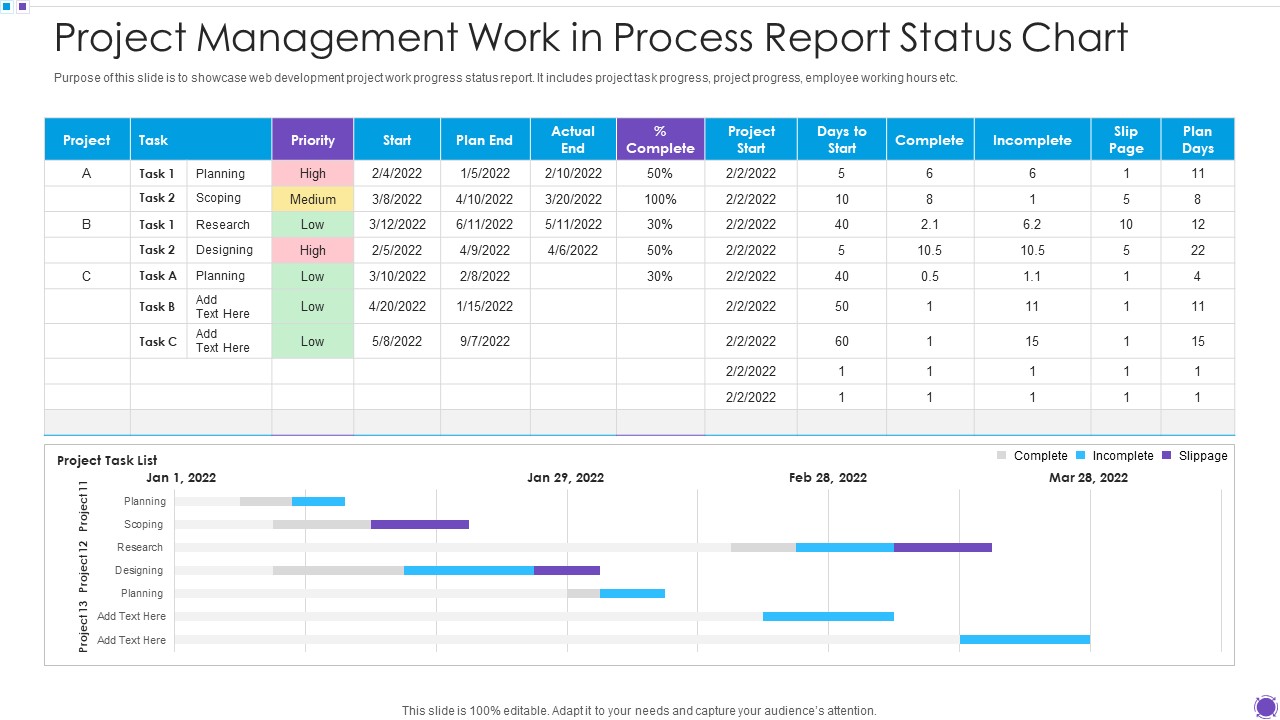
Project Management Work In Process Report Status Chart Microsoft PDF
Pitch your topic with ease and precision using this project management work in process report status chart microsoft pdf. This layout presents information on project management work in process report status chart. It is also available for immediate download and adjustment. So, changes can be made in the color, design, graphics or any other component to create a unique layout.
-
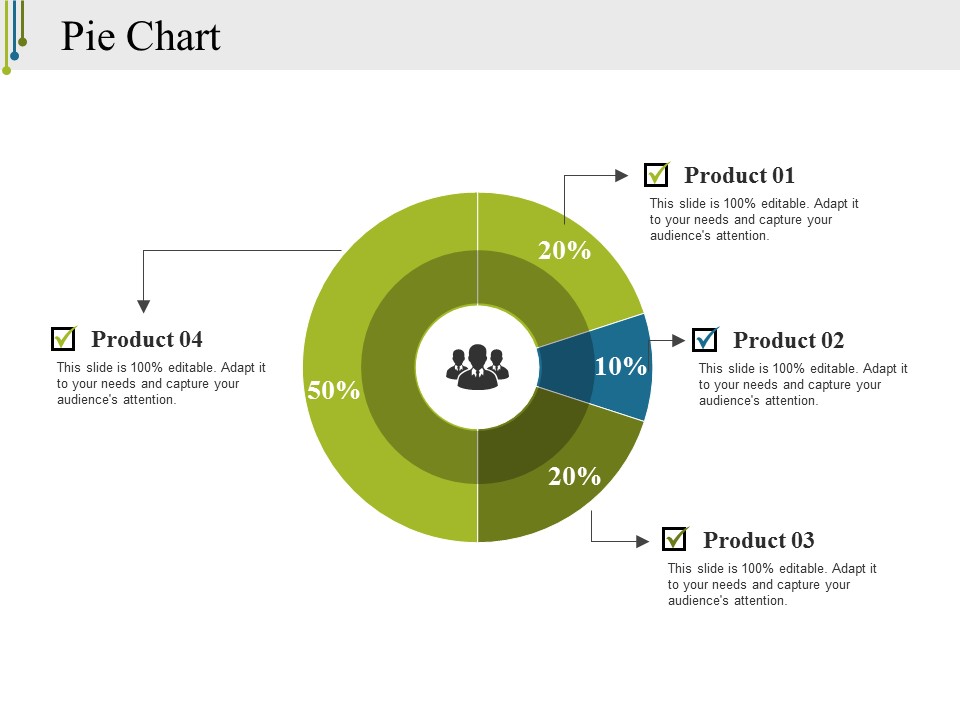
Pie Chart Ppt PowerPoint Presentation Infographics Clipart
This is a pie chart ppt powerpoint presentation infographics clipart. This is a four stage process. The stages in this process are pie chart, finance, marketing, strategy, business.
-
Project Tracking Issue Tracker Dashboard Rules PDF
The following slide highlights the project tracking issues in project management to determine and resolve them quickly. It includes metrics such as issue summary, priorities, responsible head, reporting and closing date etc. Showcasing this set of slides titled Project Tracking Issue Tracker Dashboard Rules PDF. The topics addressed in these templates are Inappropriate Supplies, Project, Tracker Dashboard. All the content presented in this PPT design is completely editable. Download it and make adjustments in color, background, font etc. as per your unique business setting.
-
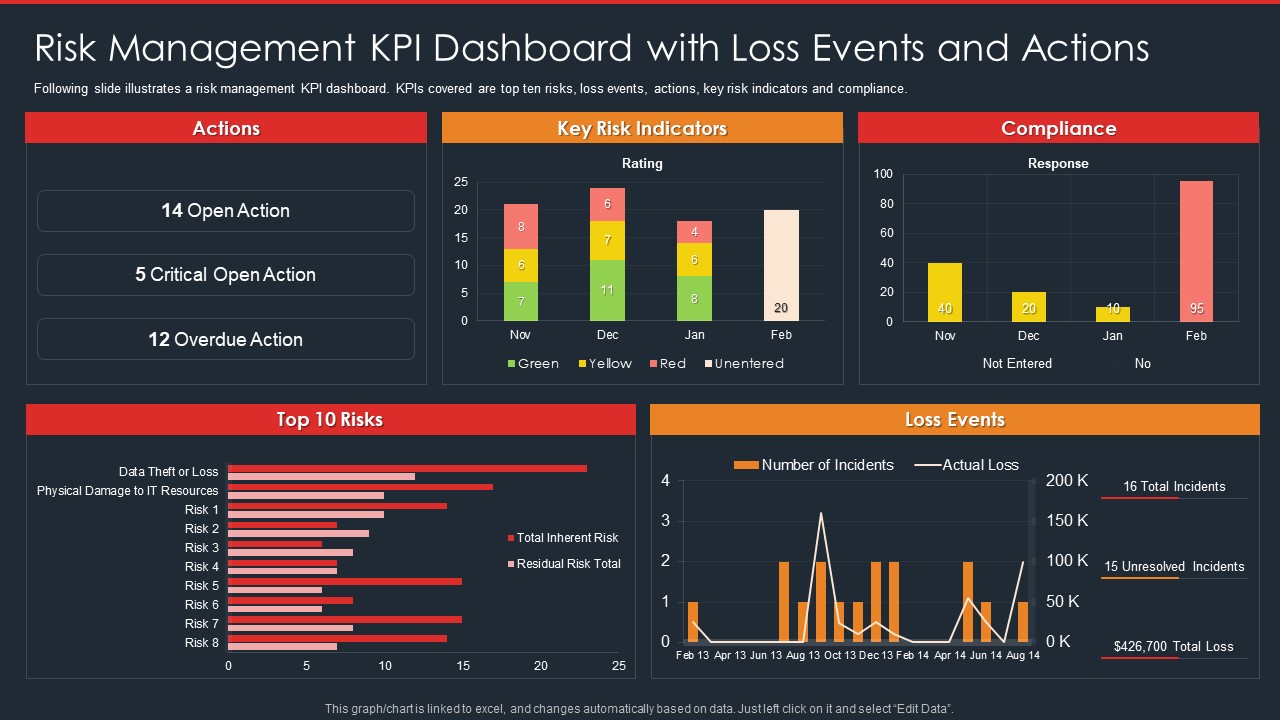
Data Safety Initiatives Risk Management KPI Dashboard With Loss Events And Actions Rules PDF
Following slide illustrates a risk management KPI dashboard. KPIs covered are top ten risks, loss events, actions, key risk indicators and compliance. Deliver an awe inspiring pitch with this creativedata safety initiatives overview of new it policy framework pictures pdf bundle. Topics like actions, key risk indicators, compliance, top 10 risks, loss events can be discussed with this completely editable template. It is available for immediate download depending on the needs and requirements of the user.
-
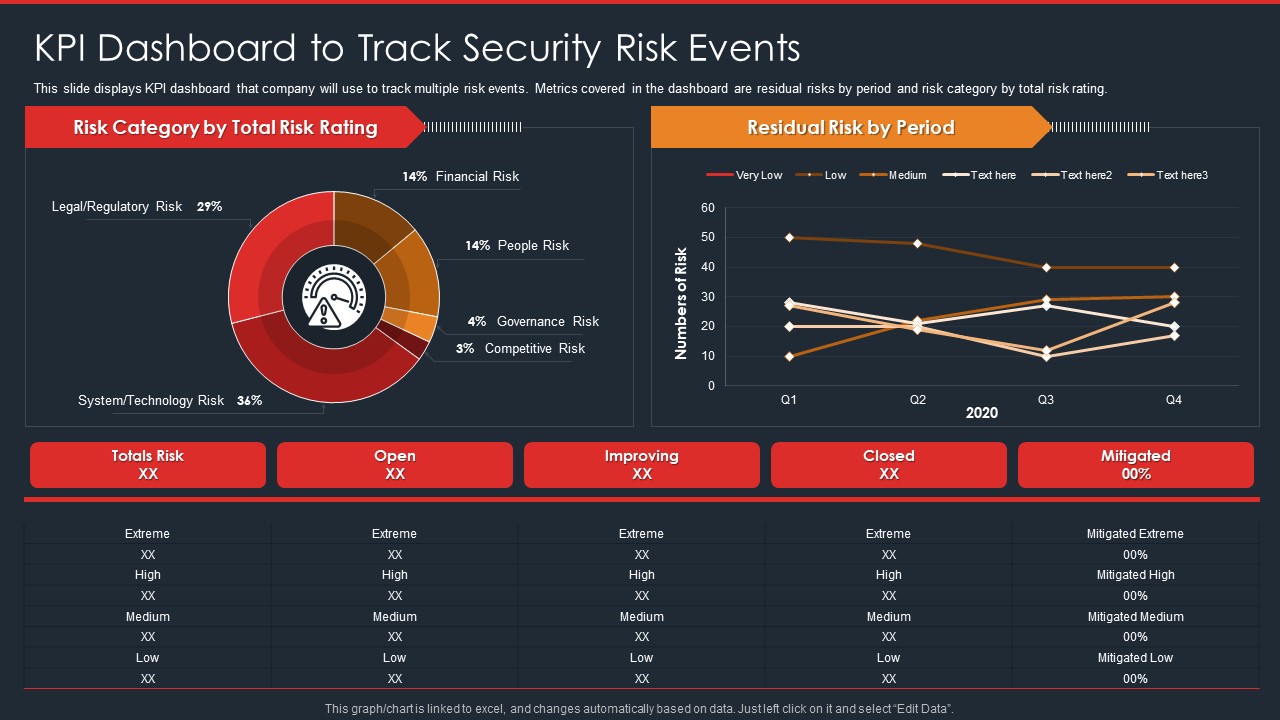
Data Safety Initiatives KPI Dashboard To Track Security Risk Events Portrait PDF
This slide displays KPI dashboard that company will use to track multiple risk events. Metrics covered in the dashboard are residual risks by period and risk category by total risk rating. Deliver and pitch your topic in the best possible manner with this data safety initiatives kpi dashboard to track security risk events portrait pdf. Use them to share invaluable insights on risk category, total risk rating, residual risk by period, technology risk and impress your audience. This template can be altered and modified as per your expectations. So, grab it now.
-
Business Strategy Development Process Business Management Dashboards Cost Pictures PDF
Deliver an awe inspiring pitch with this creative business strategy development process business management dashboards cost pictures pdf bundle. Topics like compared to previous year, customer aquisition cost cac, new customers can be discussed with this completely editable template. It is available for immediate download depending on the needs and requirements of the user.
-
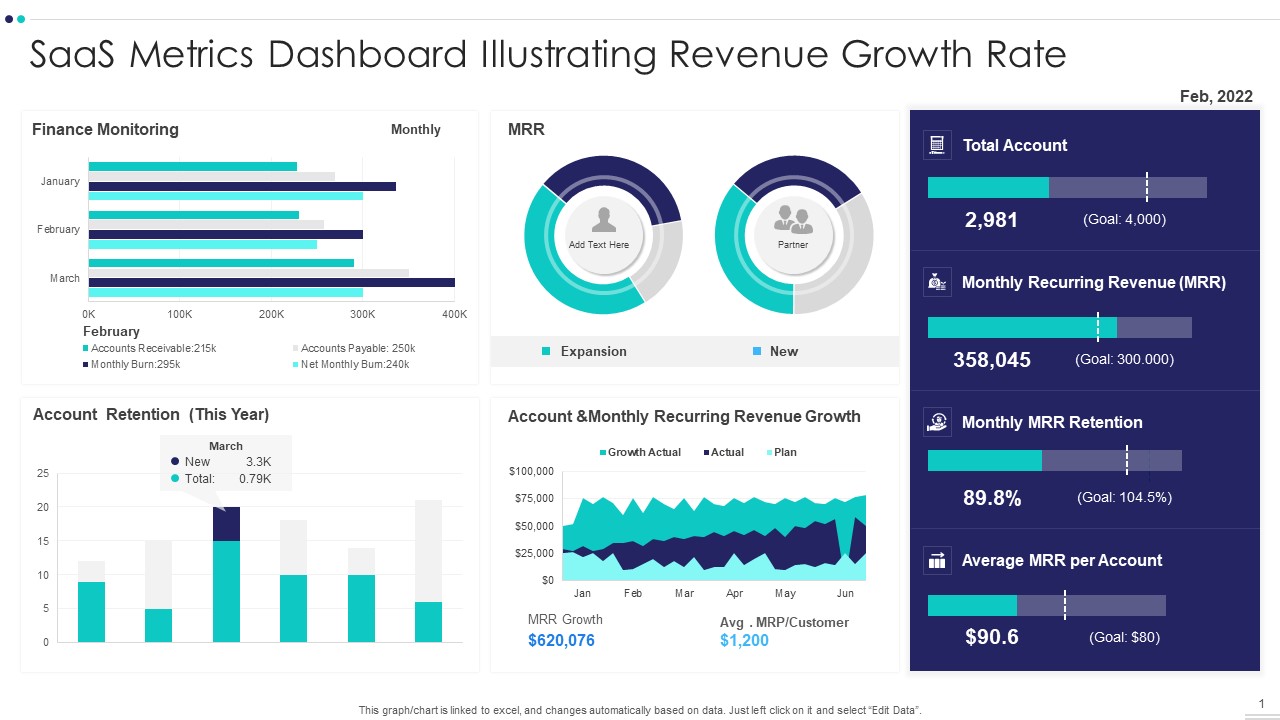
Saas Metrics Dashboard Illustrating Revenue Growth Rate Demonstration PDF
Showcasing this set of slides titled Saas Metrics Dashboard Illustrating Revenue Growth Rate Demonstration PDF The topics addressed in these templates are Saas Metrics Dashboard Illustrating Revenue Growth Rate All the content presented in this PPT design is completely editable. Download it and make adjustments in color, background, font etc. as per your unique business setting.
-
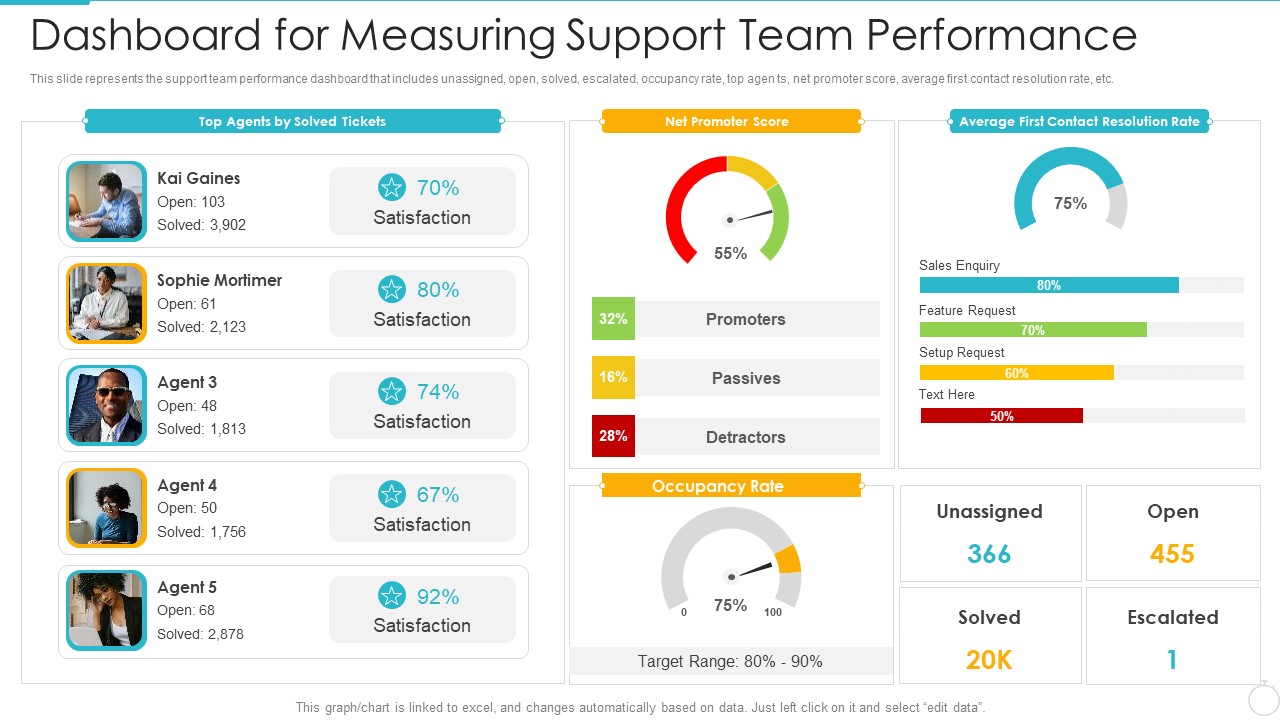
Improving Employee Performance Management System In Organization Dashboard For Measuring Support Graphics PDF
his slide represents the support team performance dashboard that includes unassigned, open, solved, escalated, occupancy rate, top agen ts, net promoter score, average first contact resolution rate, etc.This is a improving employee performance management system in organization dashboard for measuring support graphics pdf template with various stages. Focus and dispense information on one stage using this creative set, that comes with editable features. It contains large content boxes to add your information on topics like dashboard for measuring support team performance You can also showcase facts, figures, and other relevant content using this PPT layout. Grab it now.
-
Business Strategy Development Process Business Management Dashboards Profit Themes PDF
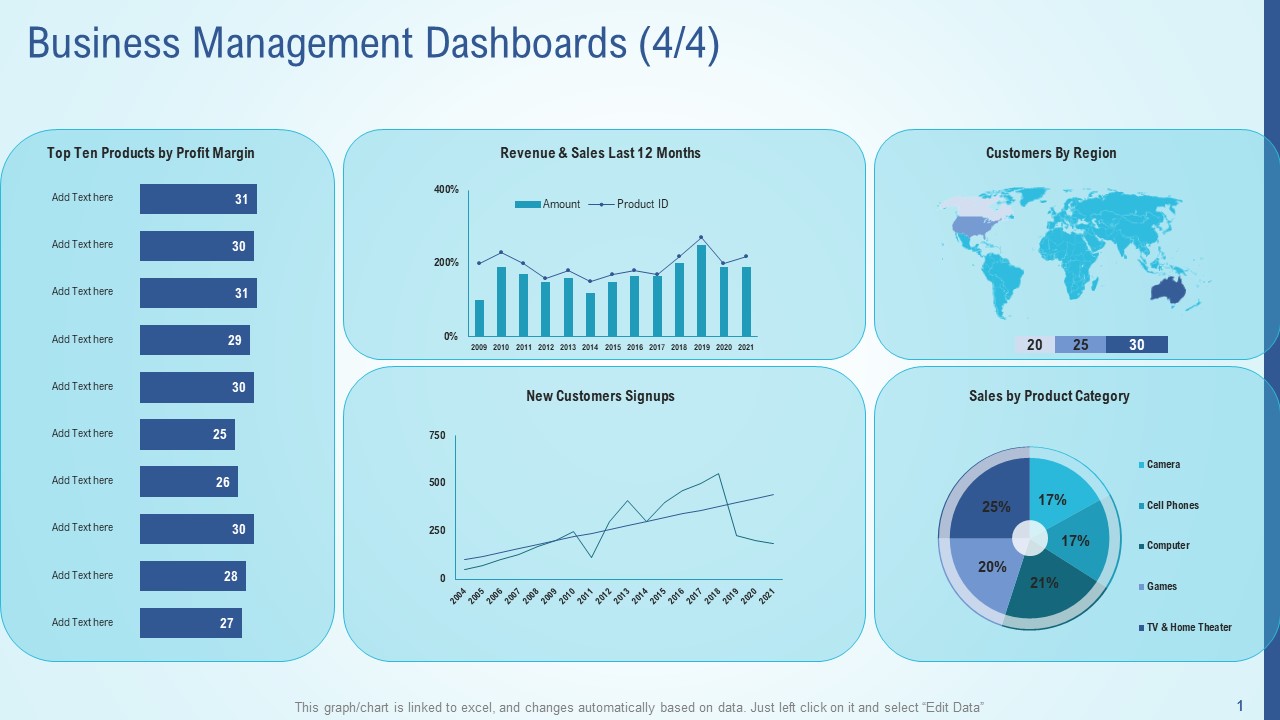
Deliver an awe inspiring pitch with this creative business strategy development process business management dashboards profit themes pdf bundle. Topics like customers by region, sales by product category, new customers signups can be discussed with this completely editable template. It is available for immediate download depending on the needs and requirements of the user.
-
Business Diagram Data Driven Bar Graph And Pie Chart For Analysis PowerPoint Slide
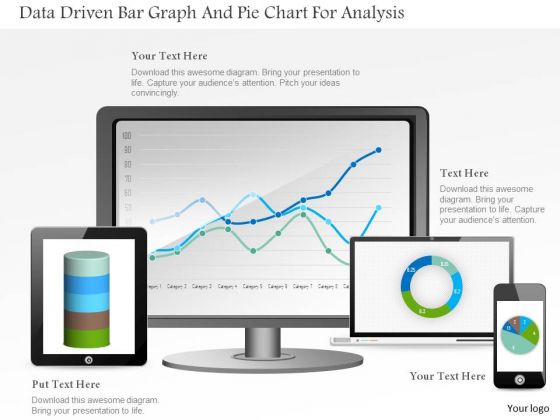
This PowerPoint template displays technology gadgets with various business charts. Use this diagram slide, in your presentations to make business reports for statistical analysis. You may use this diagram to impart professional appearance to your presentations.
-
New Staff Orientation Session HR Induction Dashboard Highlighting Employee Headcount Background PDF
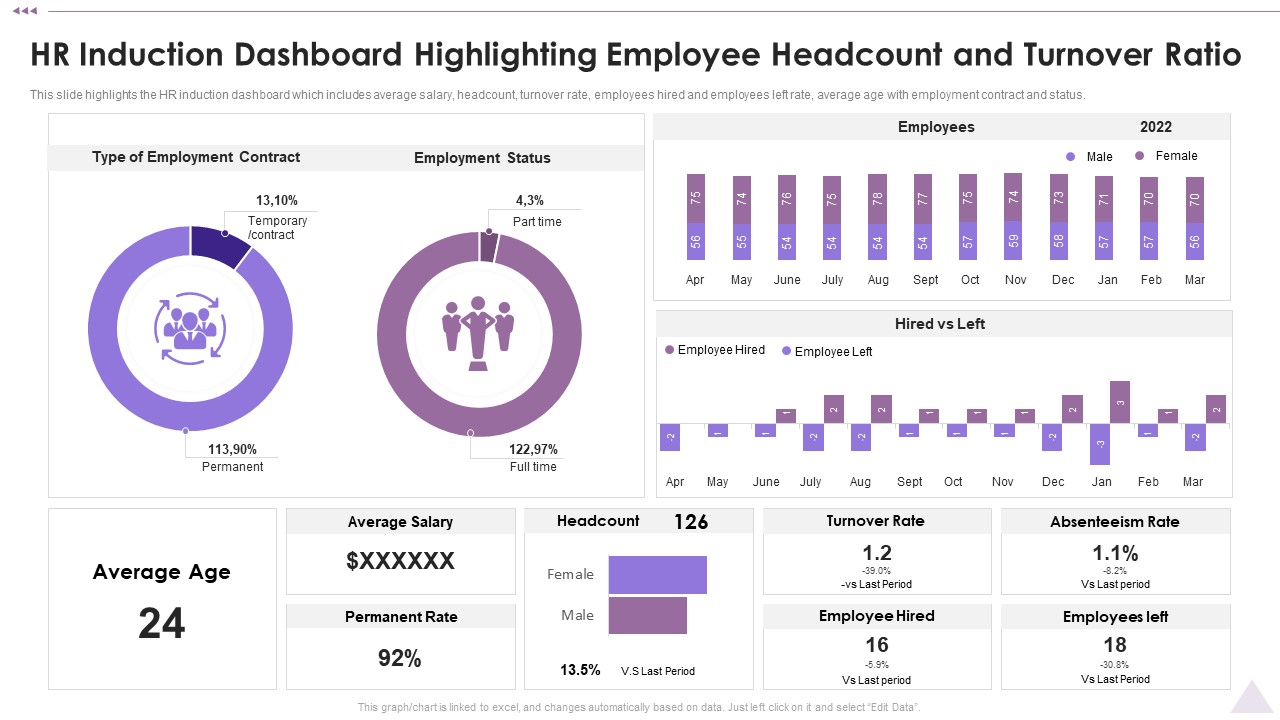
This slide highlights the HR induction dashboard which includes average salary, headcount, turnover rate, employees hired and employees left rate, average age with employment contract and status. Deliver an awe inspiring pitch with this creative New Staff Orientation Session HR Induction Dashboard Highlighting Employee Headcount Background PDF bundle. Topics like Employment Status, Employees, Average Salary can be discussed with this completely editable template. It is available for immediate download depending on the needs and requirements of the user.
-
Dashboard Indicating Funding Request Capital Raising Stages Ppt Show Infographics PDF
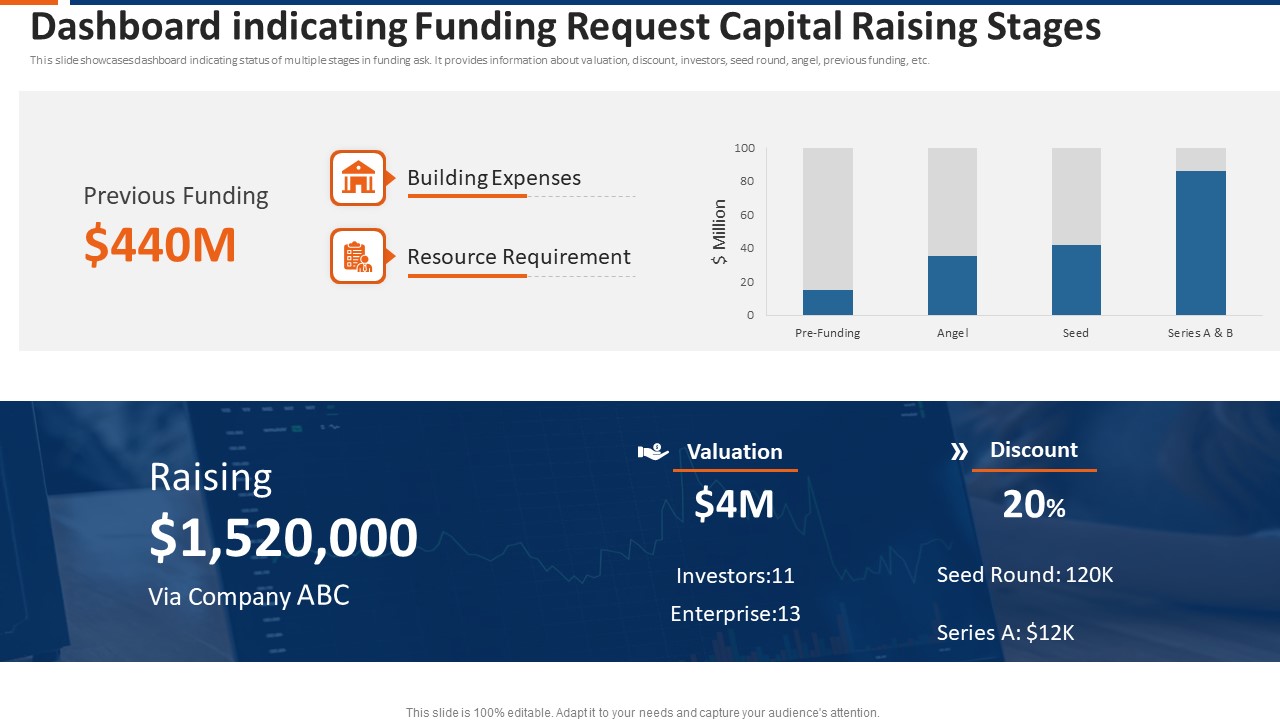
This slide showcases dashboard indicating status of multiple stages in funding ask. It provides information about valuation, discount, investors, seed round, angel, previous funding, etc. Showcasing this set of slides titled dashboard indicating funding request capital raising stages ppt show infographics pdf. The topics addressed in these templates are previous funding, building expenses, resource requirement. All the content presented in this PPT design is completely editable. Download it and make adjustments in color, background, font etc. as per your unique business setting.
-
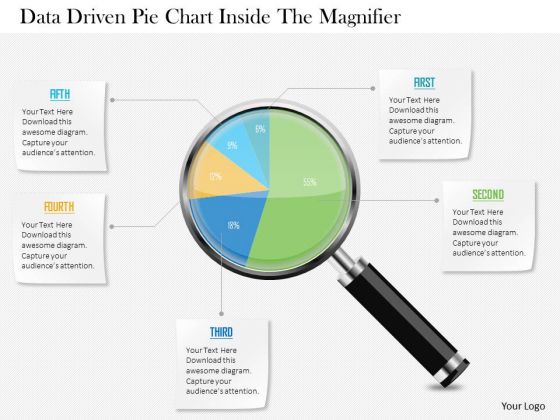
Business Diagram Data Driven Pie Chart Inside The Magnifier PowerPoint Slide
This business slide displays 3d colorful pie graph with magnifier. This diagram is a data visualization tool that gives you a simple way to present statistical information. This slide helps your audience examine and interpret the data you present.
-
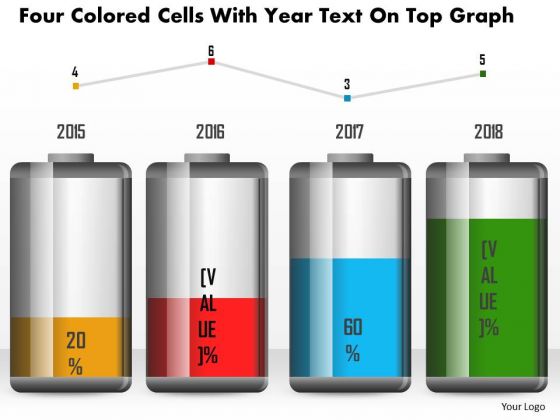
Business Diagram Four Colored Cells With Year Text On Top Graph PowerPoint Slide
This business diagram has been designed with battery cell graphic for business timeline. This slide can be used for business planning and management. Use this diagram for your business and success milestones related presentations.
-
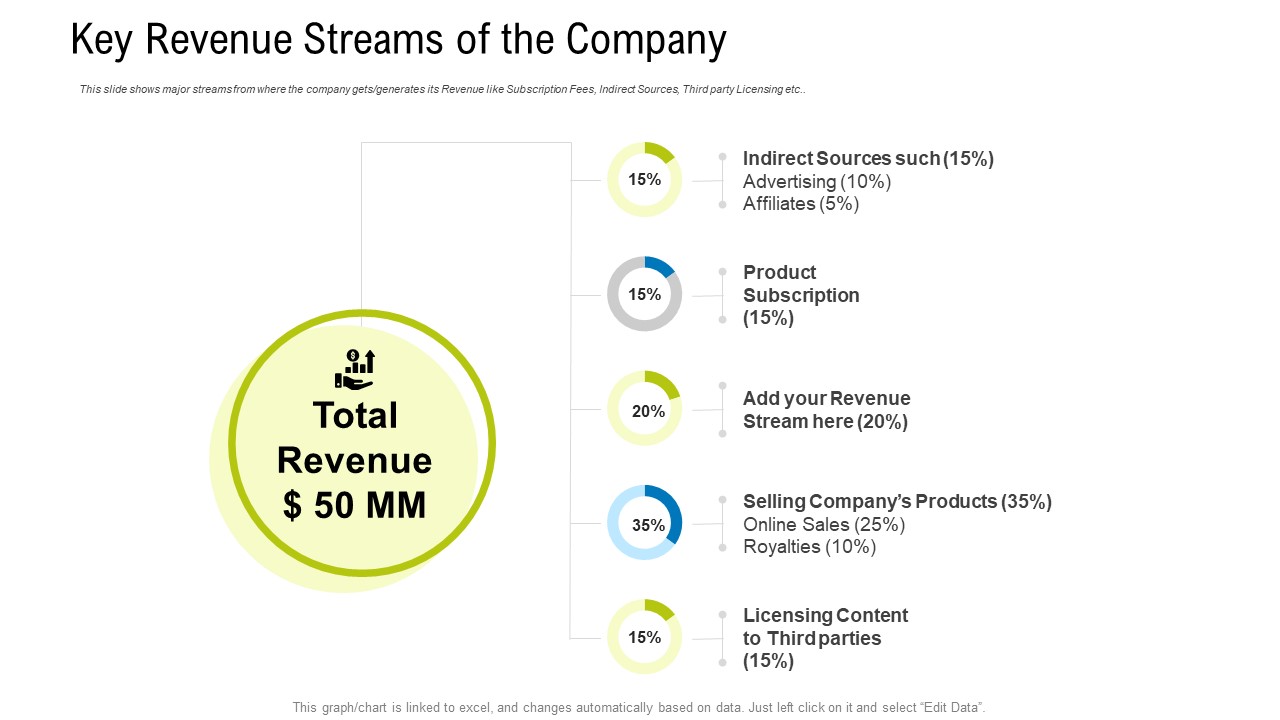
Key Revenue Streams Of The Company Ppt Portfolio Aids PDF
This slide shows major streams from where the company gets generates its Revenue like Subscription Fees, Indirect Sources, Third party Licensing etc.Deliver an awe-inspiring pitch with this creative key revenue streams of the company ppt portfolio aids pdf. bundle. Topics like product subscription, revenue stream here, indirect sources such can be discussed with this completely editable template. It is available for immediate download depending on the needs and requirements of the user.
-
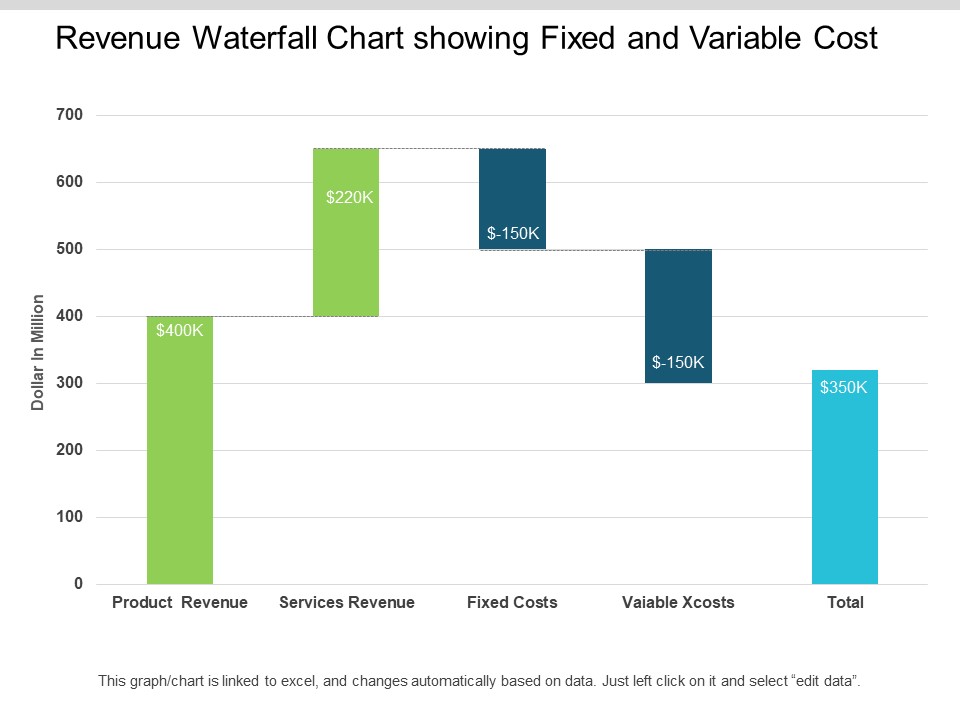
Revenue Waterfall Chart Showing Fixed And Variable Cost Ppt PowerPoint Presentation Infographic Template Images
This is a revenue waterfall chart showing fixed and variable cost ppt powerpoint presentation infographic template images. This is a five stage process. The stages in this process are sales waterfall, waterfall chart, business.
-
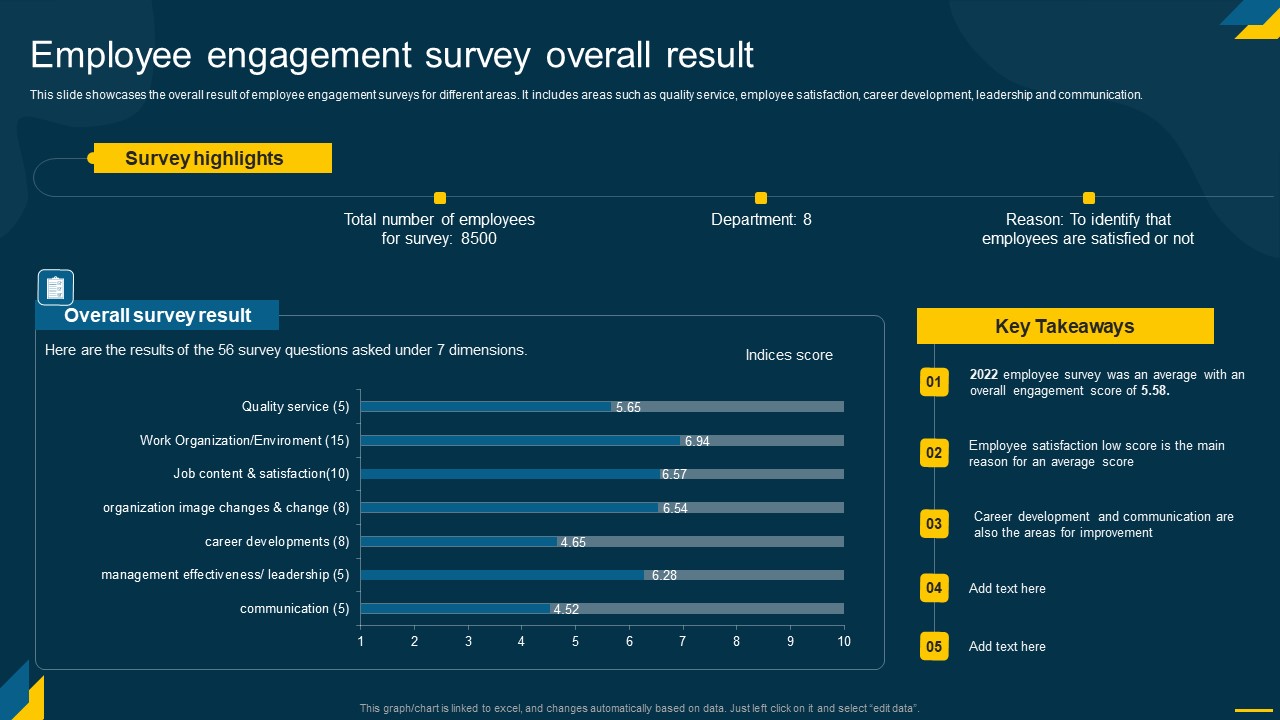
Engaging Employees Strategic Employee Engagement Survey Overall Result Pictures PDF
This slide showcases the overall result of employee engagement surveys for different areas. It includes areas such as quality service, employee satisfaction, career development, leadership and communication. Do you have an important presentation coming up Are you looking for something that will make your presentation stand out from the rest Look no further than Engaging Employees Strategic Employee Engagement Survey Overall Result Pictures PDF. With our professional designs, you can trust that your presentation will pop and make delivering it a smooth process. And with Slidegeeks, you can trust that your presentation will be unique and memorable. So why wait Grab Engaging Employees Strategic Employee Engagement Survey Overall Result Pictures PDF today and make your presentation stand out from the rest.
-
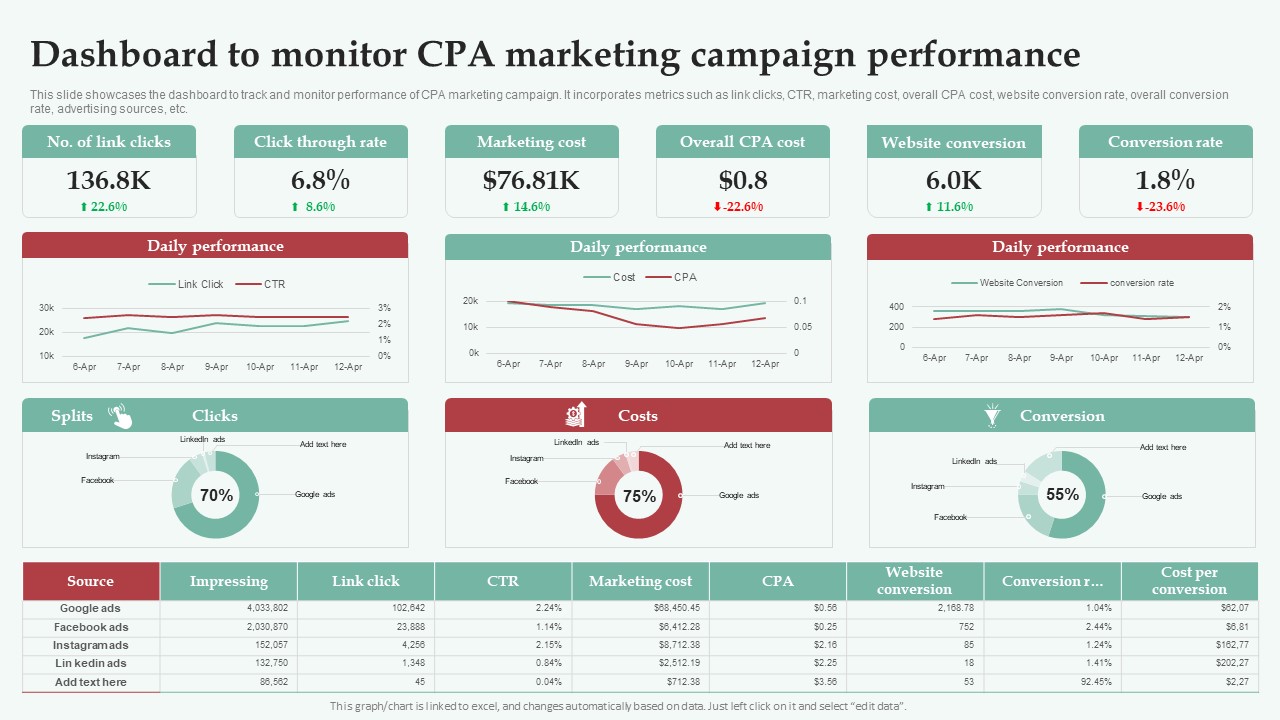
Integrating CPA Marketing Dashboard To Monitor CPA Marketing Campaign Guidelines PDF
This slide showcases the dashboard to track and monitor performance of CPA marketing campaign. It incorporates metrics such as link clicks, CTR, marketing cost, overall CPA cost, website conversion rate, overall conversion rate, advertising sources, etc. This Integrating CPA Marketing Dashboard To Monitor CPA Marketing Campaign Guidelines PDF from Slidegeeks makes it easy to present information on your topic with precision. It provides customization options, so you can make changes to the colors, design, graphics, or any other component to create a unique layout. It is also available for immediate download, so you can begin using it right away. Slidegeeks has done good research to ensure that you have everything you need to make your presentation stand out. Make a name out there for a brilliant performance.
-
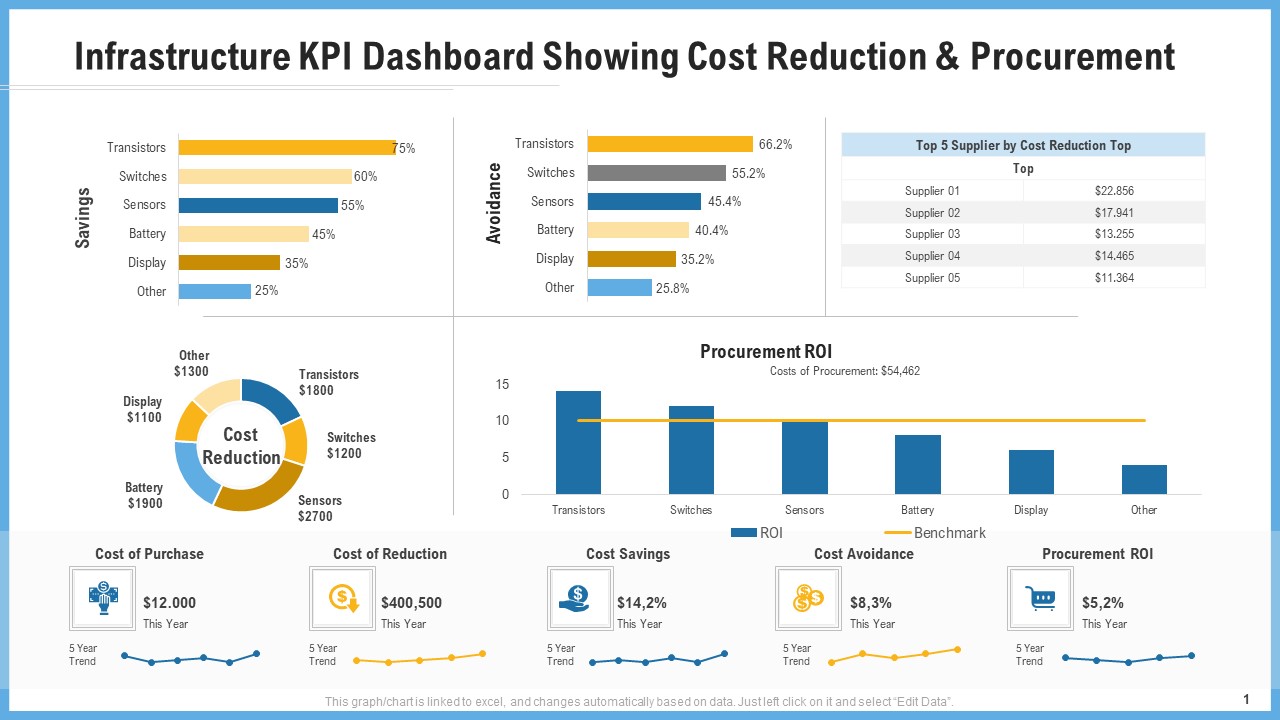
Infrastructure Kpi Dashboard Showing Cost Reduction And Procurement Graphics PDF
Deliver an awe inspiring pitch with this creative infrastructure kpi dashboard showing cost reduction and procurement graphics pdf bundle. Topics like cost of purchase, cost of reduction, cost saving, procurement roi can be discussed with this completely editable template. It is available for immediate download depending on the needs and requirements of the user.
-
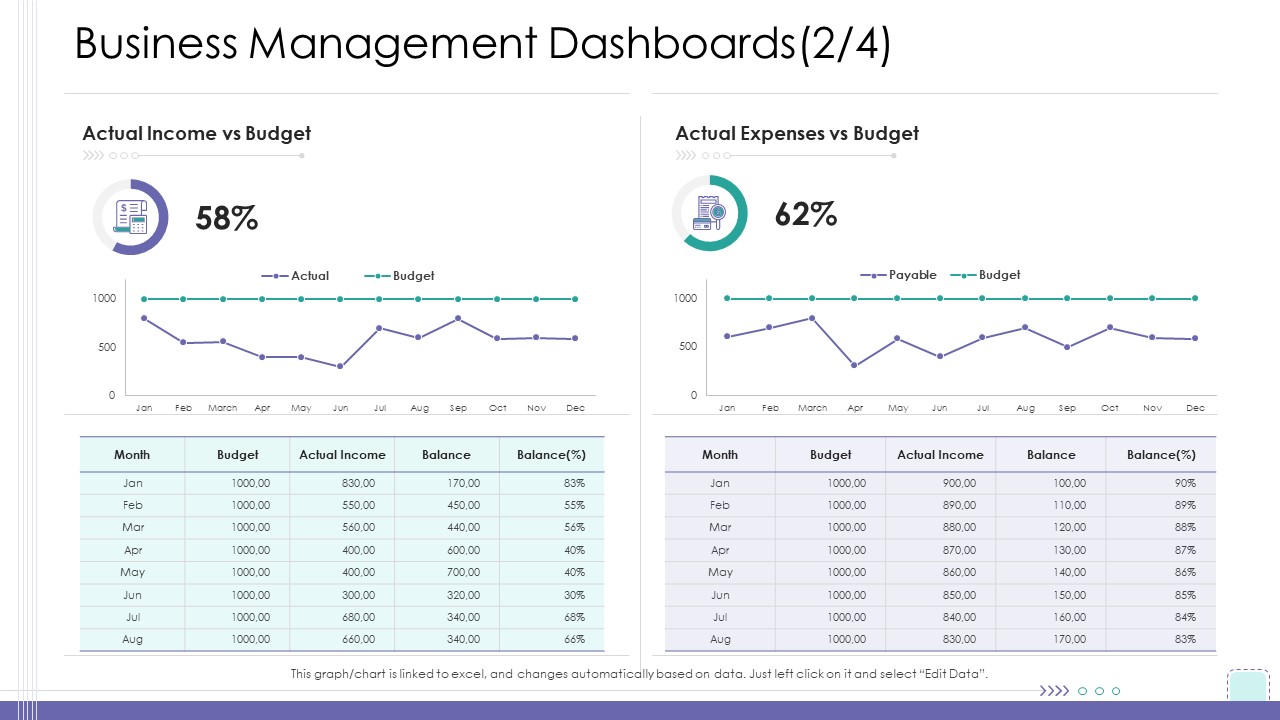
Corporate Governance Business Management Dashboards Gride Formats PDF
Deliver an awe inspiring pitch with this creative corporate governance business management dashboards gride formats pdf bundle. Topics like actual income vs budget, actual expenses vs budget can be discussed with this completely editable template. It is available for immediate download depending on the needs and requirements of the user.
-
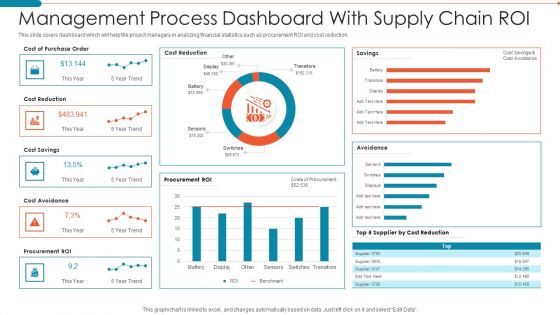
Management Process Dashboard With Supply Chain Roi Professional PDF
This slide covers dashboard which will help the project managers in analyzing financial statistics such as procurement ROI and cost reduction.Pitch your topic with ease and precision using this Management Process Dashboard With Supply Chain Roi Professional PDF. This layout presents information on Management Process Dashboard With Supply Chain Roi. It is also available for immediate download and adjustment. So, changes can be made in the color, design, graphics or any other component to create a unique layout.
-
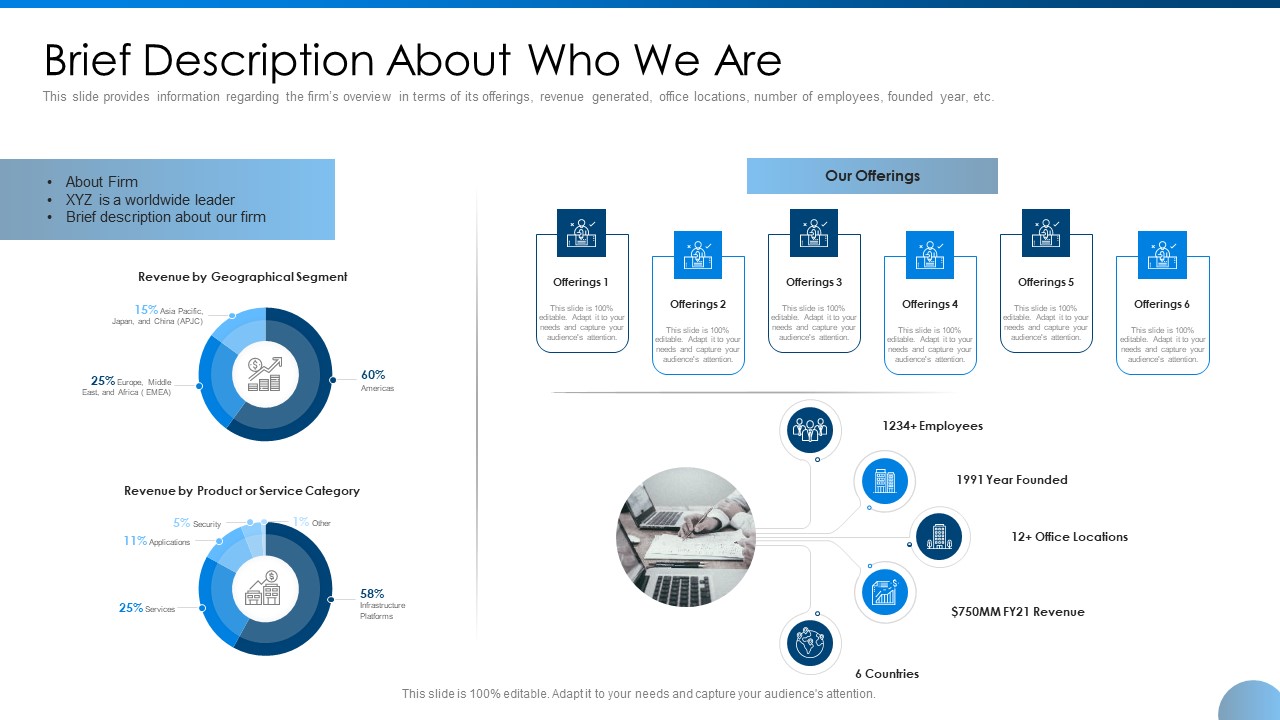
Brief Description About Who We Are Ppt Gallery Influencers PDF
This slide provides information regarding the firms overview in terms of its offerings, revenue generated, office locations, number of employees, founded year, etc. Deliver an awe inspiring pitch with this creative brief description about who we are ppt gallery influencers pdf bundle. Topics like revenue by geographical segment, revenue by product or service category, our offerings can be discussed with this completely editable template. It is available for immediate download depending on the needs and requirements of the user.
-
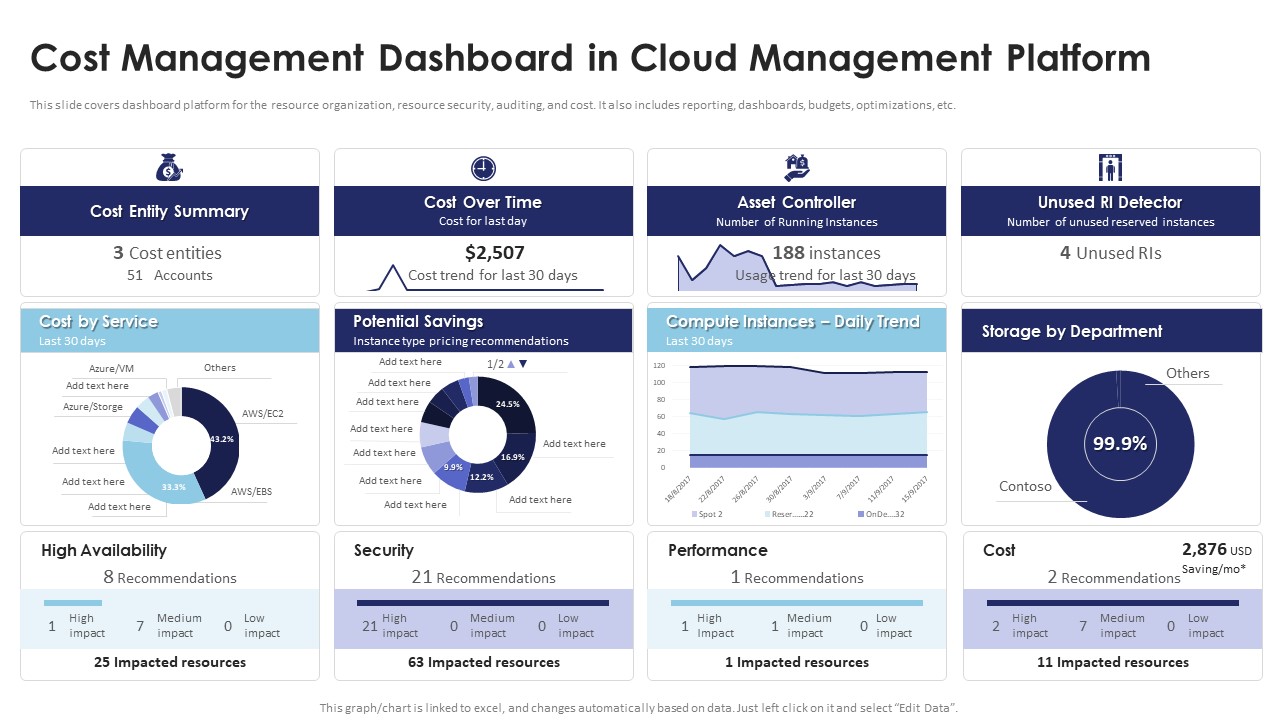
Multi Cloud Infrastructure Management Cost Management Dashboard In Cloud Management Structure PDF
Boost your pitch with our creative Multi Cloud Infrastructure Management Cost Management Dashboard In Cloud Management Structure PDF. Deliver an awe-inspiring pitch that will mesmerize everyone. Using these presentation templates you will surely catch everyones attention. You can browse the ppts collection on our website. We have researchers who are experts at creating the right content for the templates. So you dont have to invest time in any additional work. Just grab the template now and use them.
-
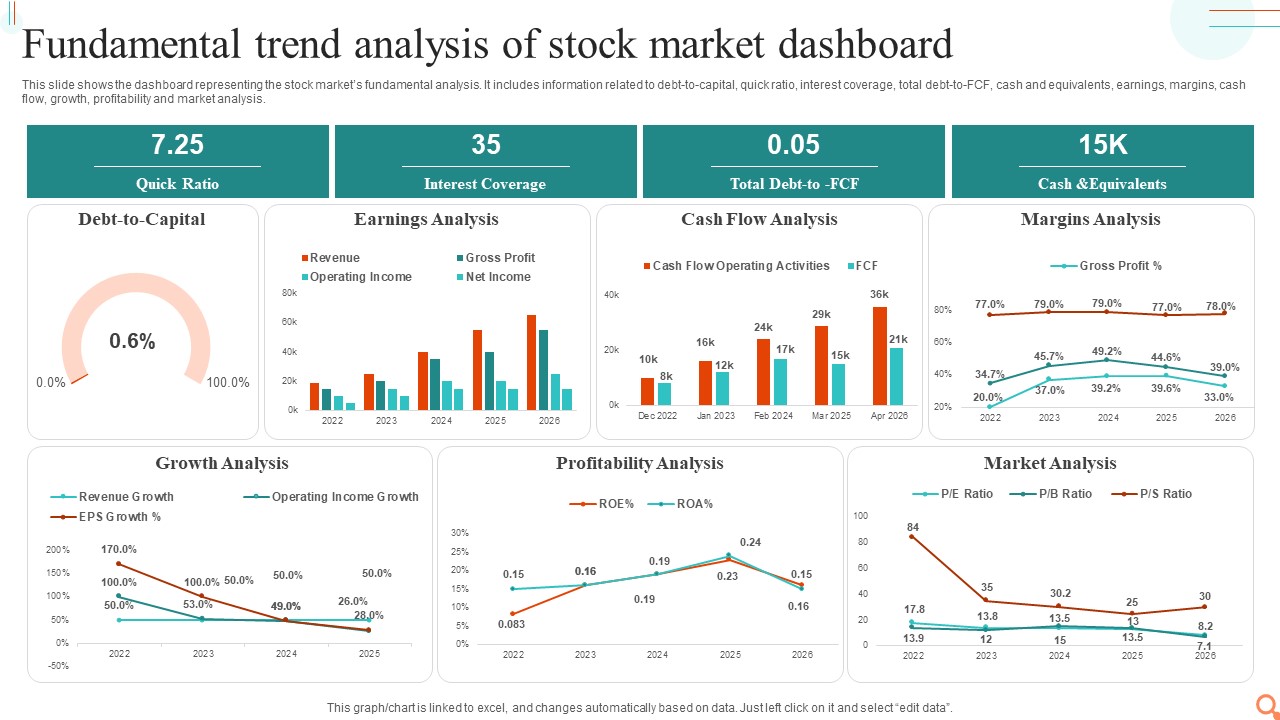
Fundamental Trend Analysis Of Stock Market Dashboard Professional PDF
This slide shows the dashboard representing the stock markets fundamental analysis. It includes information related to debt-to-capital, quick ratio, interest coverage, total debt-to-FCF, cash and equivalents, earnings, margins, cash flow, growth, profitability and market analysis.Showcasing this set of slides titled Fundamental Trend Analysis Of Stock Market Dashboard Professional PDF. The topics addressed in these templates are Earnings Analysis, Cash Flow Analysis, Margins Analysis. All the content presented in this PPT design is completely editable. Download it and make adjustments in color, background, font etc. as per your unique business setting.
-
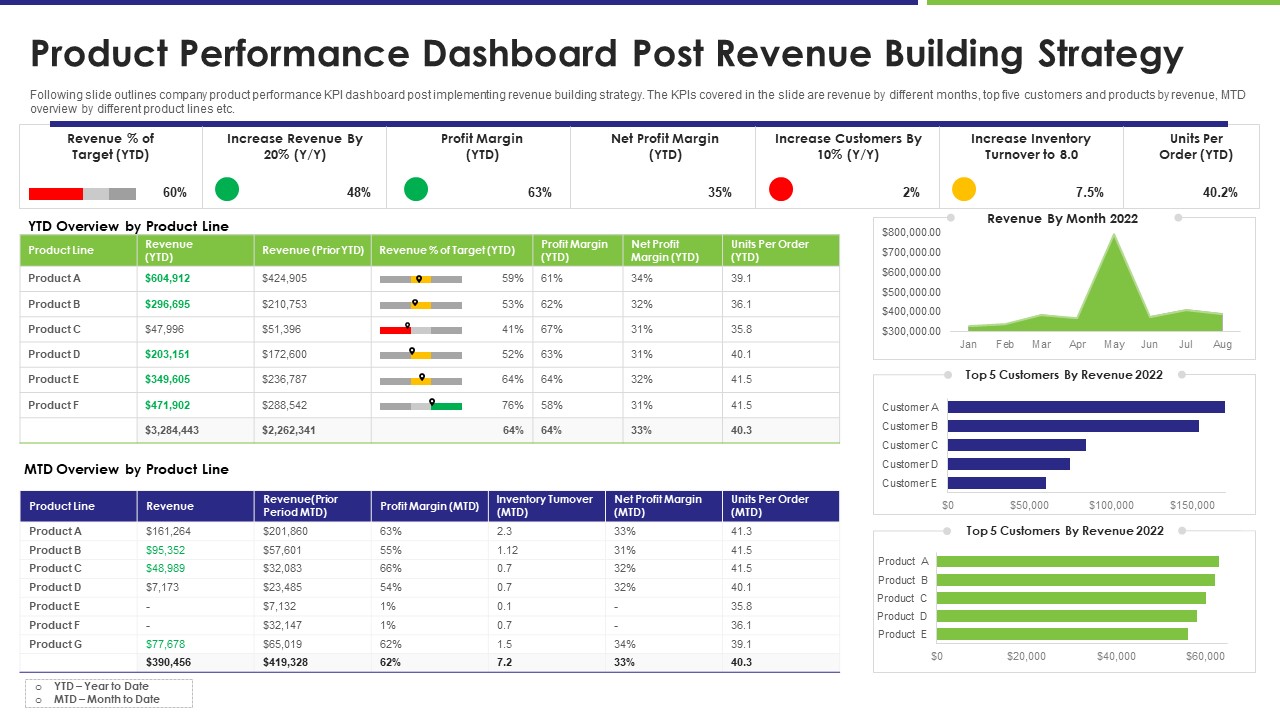
Product Performance Dashboard Post Revenue Building Strategy Brochure PDF
Following slide outlines company product performance KPI dashboard post implementing revenue building strategy. The KPIs covered in the slide are revenue by different months, top five customers and products by revenue, MTD overview by different product lines etc. Showcasing this set of slides titled product performance dashboard post revenue building strategy brochure pdf. The topics addressed in these templates are revenue, target, profit margin. All the content presented in this PPT design is completely editable. Download it and make adjustments in color, background, font etc. as per your unique business setting.
-
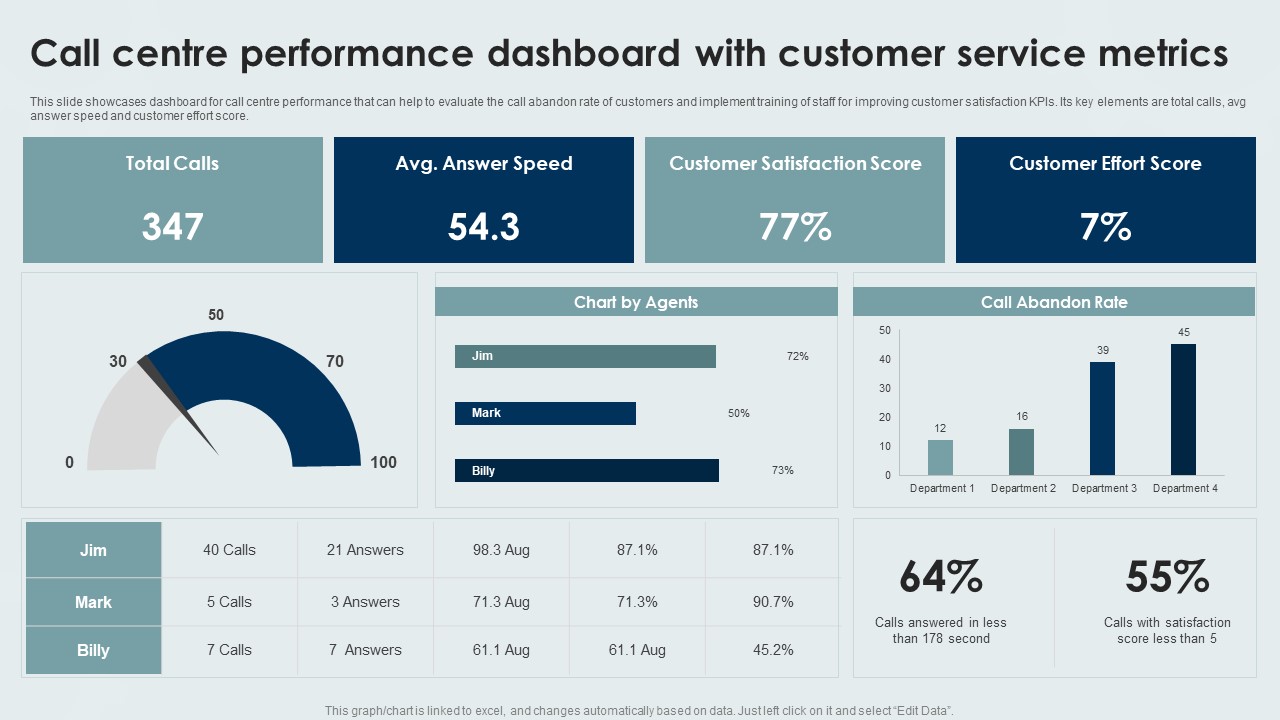
Call Centre Performance Dashboard With Customer Service Metrics Background PDF
This slide showcases dashboard for call centre performance that can help to evaluate the call abandon rate of customers and implement training of staff for improving customer satisfaction KPIs. Its key elements are total calls, avg answer speed and customer effort score. Showcasing this set of slides titled Call Centre Performance Dashboard With Customer Service Metrics Background PDF. The topics addressed in these templates are Call Centre Performance Dashboard, Customer Service Metrics. All the content presented in this PPT design is completely editable. Download it and make adjustments in color, background, font etc. as per your unique business setting.
-
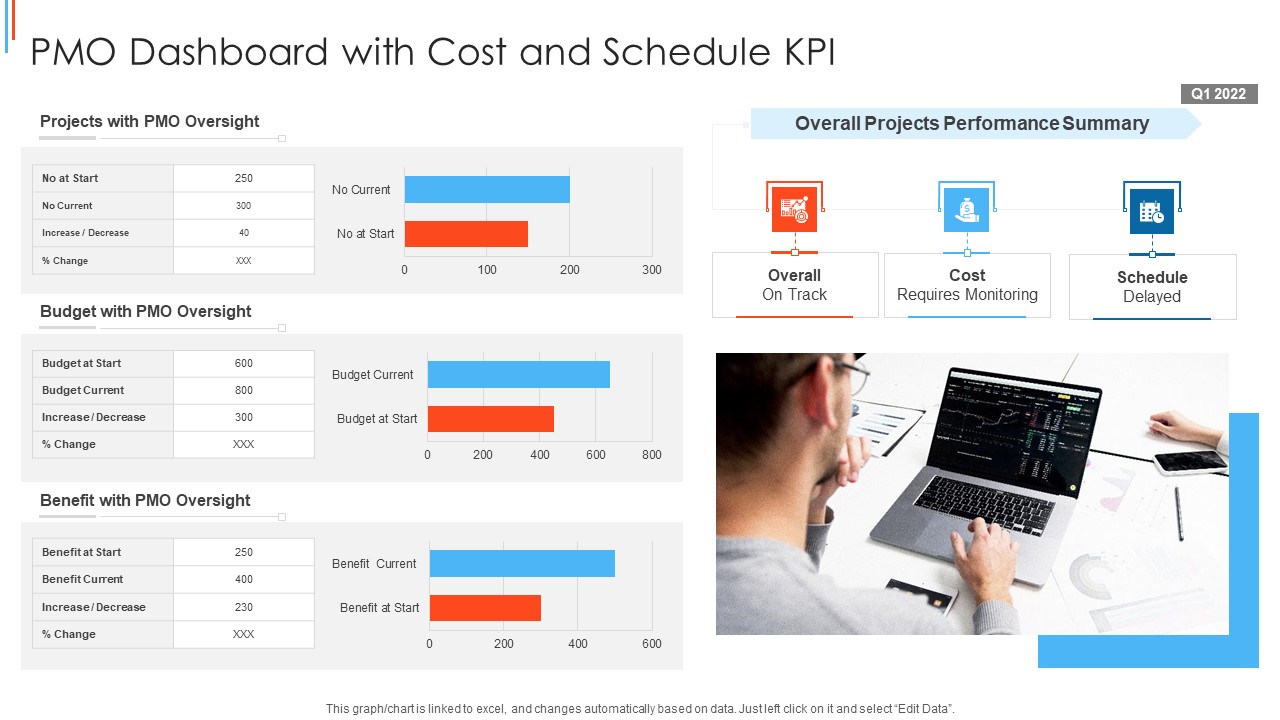
PMO Dashboard With Cost And Schedule KPI Template PDF
Showcasing this set of slides titled PMO Dashboard With Cost And Schedule KPI Themes PDF The topics addressed in these templates are Projects With Pmo Oversight, Budget With Pmo Oversight, Benefit With Pmo Oversight All the content presented in this PPT design is completely editable. Download it and make adjustments in color, background, font etc. as per your unique business setting.
-
Data Analysis Techniques 3d Graphical Presentation Of PowerPoint Templates
Our data analysis techniques 3d graphical presentation of Powerpoint Templates Will Follow The Drill. They Accomplish The Task Assigned To Them.
-
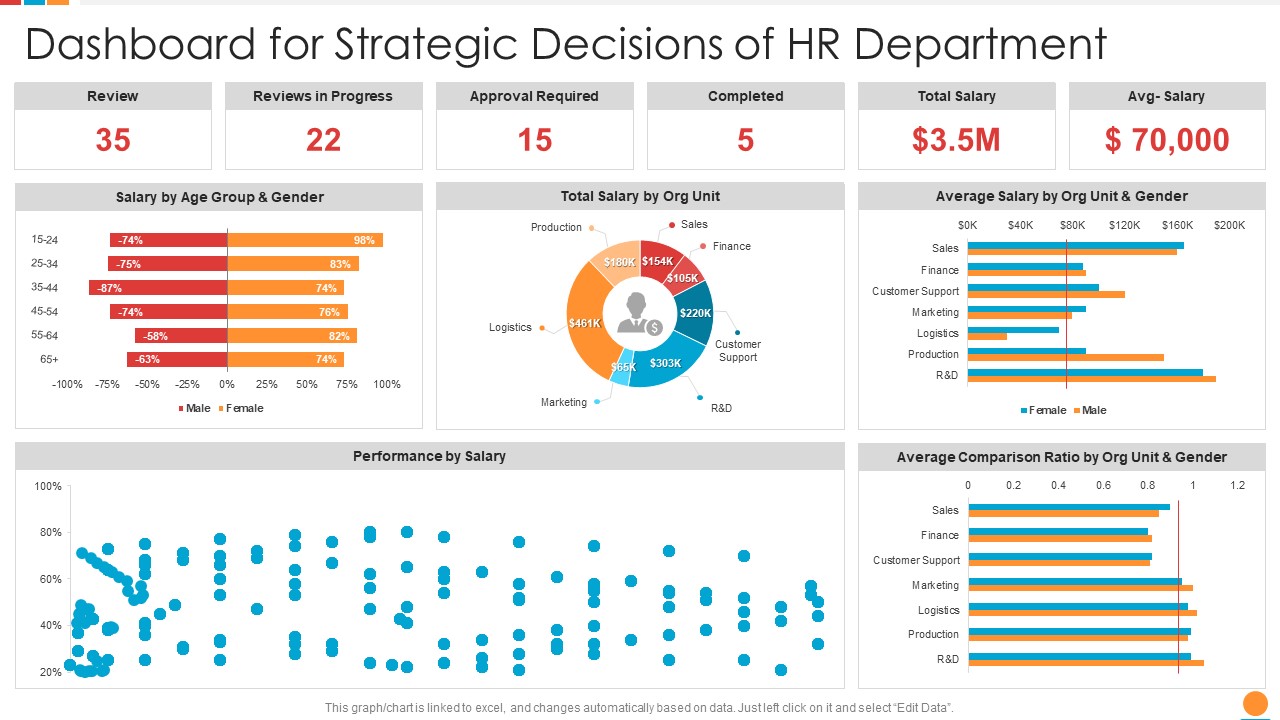
Providing HR Service To Improve Dashboard For Strategic Decisions Of HR Department Brochure PDF
Deliver an awe inspiring pitch with this creative providing hr service to improve dashboard for strategic decisions of hr department brochure pdf bundle. Topics like dashboard for strategic decisions of hr department can be discussed with this completely editable template. It is available for immediate download depending on the needs and requirements of the user.
-
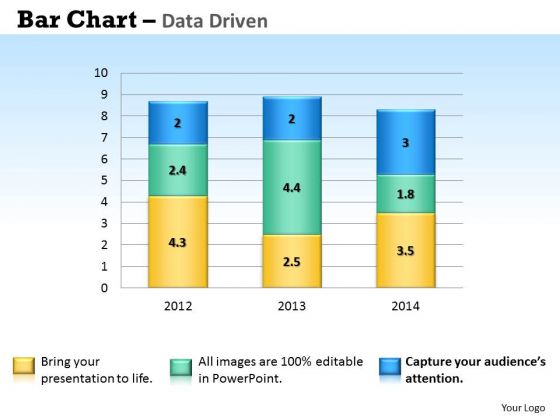
Microsoft Excel Data Analysis Bar Chart To Handle PowerPoint Templates
Our microsoft excel data analysis bar chart to handle Powerpoint Templates And Your Ideas Make A Great Doubles Pair. Play The Net With Assured Hands.
-
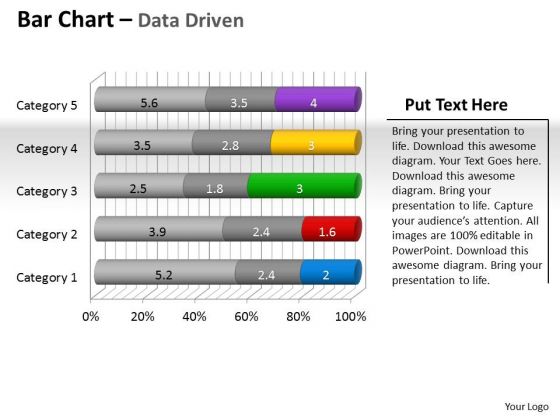
Data Analysis Programs 3d Bar Chart To Put Information PowerPoint Templates
Draw Up Your Agenda On Our data analysis programs 3d bar chart to put information Powerpoint Templates . Coax Your Audience Into Acceptance.
-
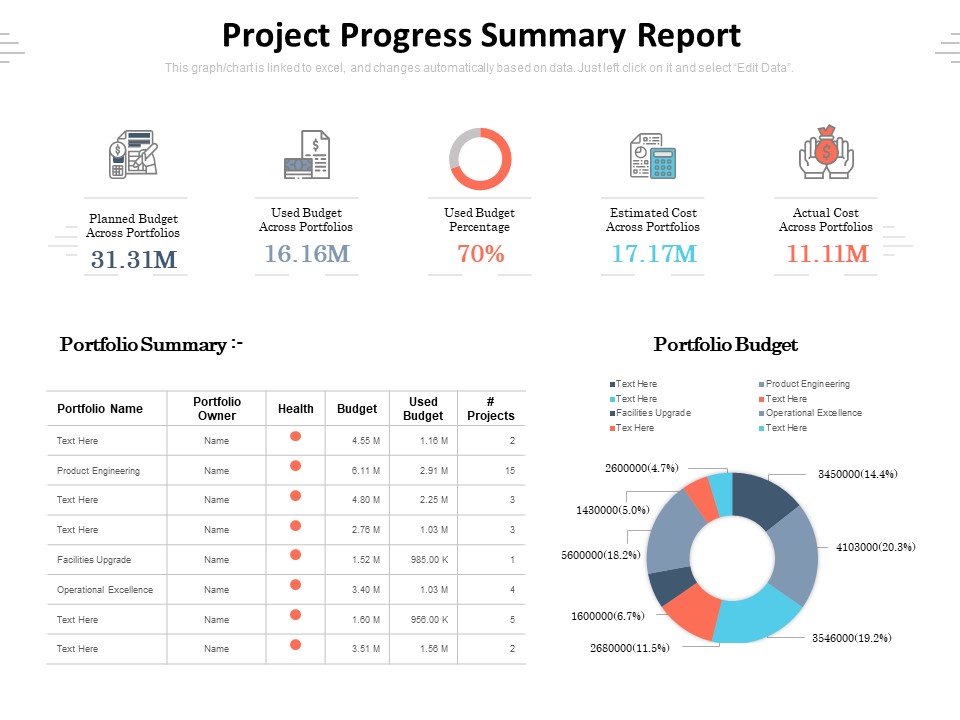
Project Progress Summary Report Ppt PowerPoint Presentation File Images PDF
Presenting this set of slides with name project progress summary report ppt powerpoint presentation file images pdf. The topics discussed in these slides are portfolio, budget, planned. This is a completely editable PowerPoint presentation and is available for immediate download. Download now and impress your audience.
-
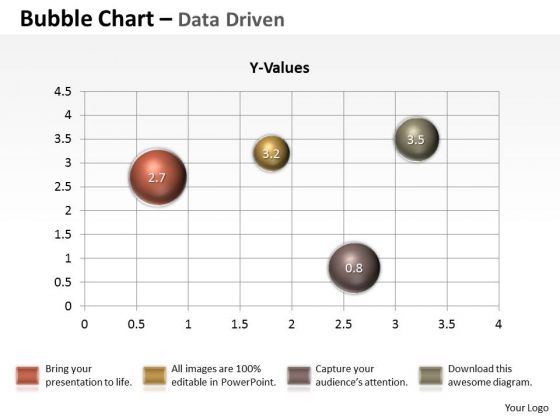
Data Analysis Excel Driven Multiple Series Scatter Chart PowerPoint Slides Templates
Your Listeners Will Never Doodle. Our data analysis excel driven multiple series scatter chart powerpoint slides Templates Will Hold Their Concentration.
-
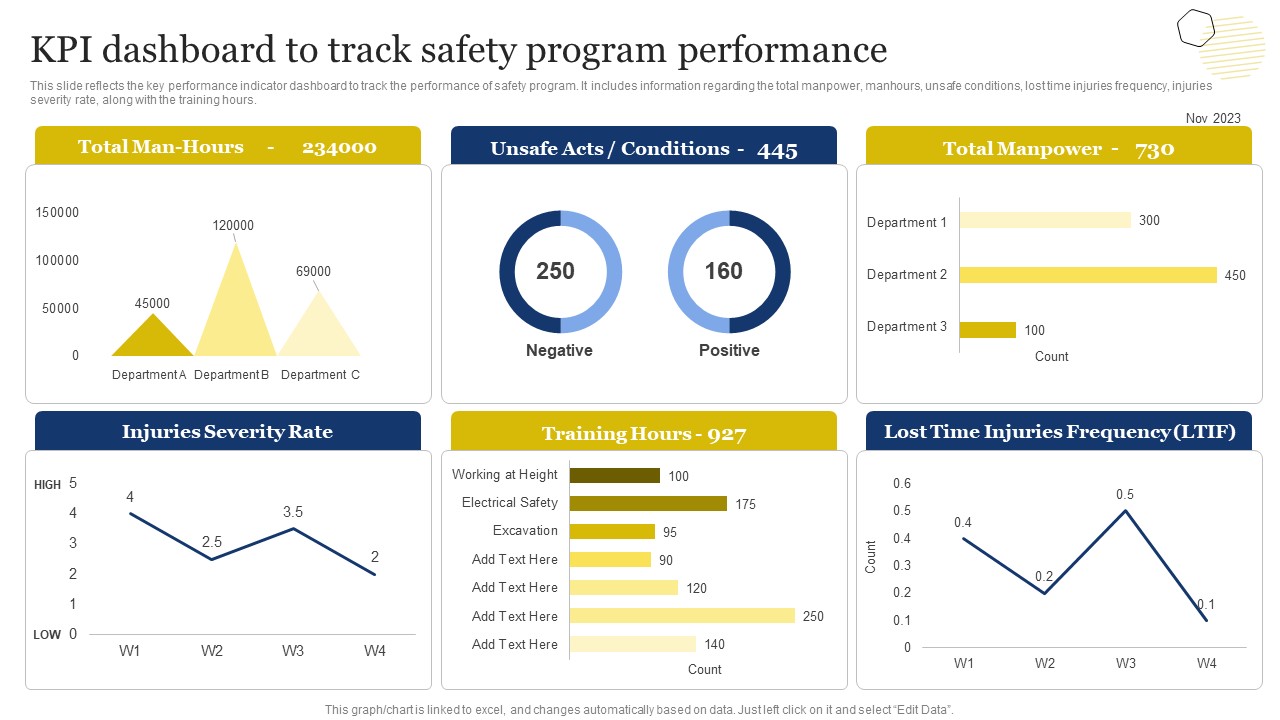
Improvement Of Safety Performance At Construction Site Kpi Dashboard To Track Safety Program Microsoft PDF
This slide reflects the key performance indicator dashboard to track the performance of safety program. It includes information regarding the total manpower, manhours, unsafe conditions, lost time injuries frequency, injuries severity rate, along with the training hours. Make sure to capture your audiences attention in your business displays with our gratis customizable Improvement Of Safety Performance At Construction Site Kpi Dashboard To Track Safety Program Microsoft PDF. These are great for business strategies, office conferences, capital raising or task suggestions. If you desire to acquire more customers for your tech business and ensure they stay satisfied, create your own sales presentation with these plain slides.
-
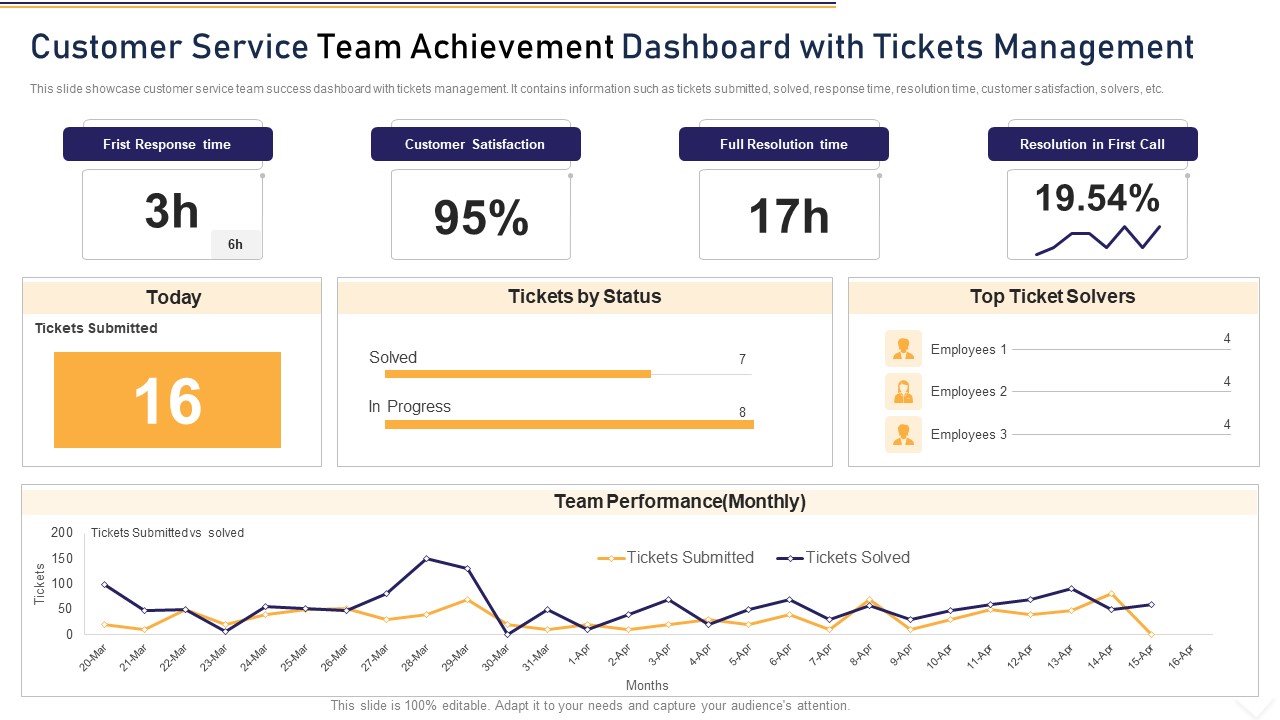
Customer Service Team Achievement Dashboard With Tickets Management Rules PDF
This slide showcase customer service team success dashboard with tickets management. It contains information such as tickets submitted, solved, response time, resolution time, customer satisfaction, solvers, etc. Showcasing this set of slides titled customer service team achievement dashboard with tickets management rules pdf. The topics addressed in these templates are customer satisfaction, full resolution time, resolution in first call. All the content presented in this PPT design is completely editable. Download it and make adjustments in color, background, font etc. as per your unique business setting.

 Home
Home 


