Charts and Graphs
-
Commodity Channel Segmentation Product Management Kpi Sales Metrics Summary PDF
Deliver an awe inspiring pitch with this creative commodity channel segmentation product management kpi sales metrics summary pdf bundle. Topics like revenue, product, account target, progress can be discussed with this completely editable template. It is available for immediate download depending on the needs and requirements of the user.
-
KPI Dashboard To Analyze Results Of Paid Social Media Advertising Rules PDF
This slide covers a comprehensive dashboard that can be used to examine the success rate of the paid social media plan. The metrics mentioned in the dashboard are impressions, cost, clicks, cost per click, conversions, cost per conversion, etc. Presenting this PowerPoint presentation, titled KPI Dashboard To Analyze Results Of Paid Social Media Advertising Rules PDF, with topics curated by our researchers after extensive research. This editable presentation is available for immediate download and provides attractive features when used. Download now and captivate your audience. Presenting this KPI Dashboard To Analyze Results Of Paid Social Media Advertising Rules PDF. Our researchers have carefully researched and created these slides with all aspects taken into consideration. This is a completely customizable KPI Dashboard To Analyze Results Of Paid Social Media Advertising Rules PDF that is available for immediate downloading. Download now and make an impact on your audience. Highlight the attractive features available with our PPTs.
-
Pie Of Pie Marketing Ppt Powerpoint Presentation Inspiration Designs
This is a pie of pie marketing ppt powerpoint presentation inspiration designs. This is a three stage process. The stages in this process are finance, pie chart, product, marketing, percentage.
-
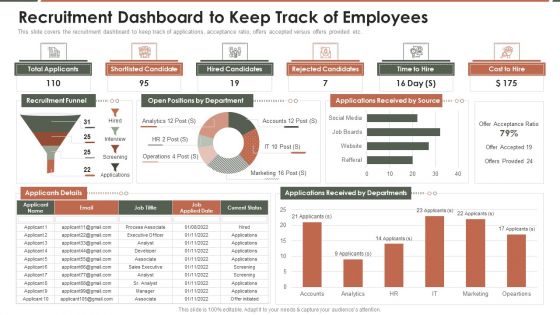
Talent Acquisition Marketing Recruitment Dashboard To Keep Track Of Employees Topics PDF
This slide covers the recruitment dashboard to keep track of applications, acceptance ratio, offers accepted versus offers provided etc. Deliver an awe inspiring pitch with this creative Talent Acquisition Marketing Recruitment Dashboard To Keep Track Of Employees Topics PDF bundle. Topics like Shortlisted Candidate, Hired Candidates, Rejected Candidates can be discussed with this completely editable template. It is available for immediate download depending on the needs and requirements of the user.
-
Project Management Dashboard Ppt PowerPoint Presentation Outline Designs
This is a project management dashboard ppt powerpoint presentation outline designs. This is a four stage process. The stages in this process are finance, analysis, business, investment, marketing.
-
KPI Dashboards Per Industry Retail KPI Dashboard Ppt PowerPoint Presentation Slides Clipart PDF
Deliver an awe-inspiring pitch with this creative kpi dashboards per industry retail kpi dashboard ppt powerpoint presentation slides clipart pdf bundle. Topics like return reasons, top seller orders, perfect order rate, total orders can be discussed with this completely editable template. It is available for immediate download depending on the needs and requirements of the user.
-
IT Security Risk Management And Incident Management Dashboard Icons PDF
This slide displays dashboard to help company in designing initiatives to mitigate cybersecurity risks. It includes kpis such as incident management, patches, compliance, vulnerabilities, etc. Showcasing this set of slides titled IT Security Risk Management And Incident Management Dashboard Icons PDF. The topics addressed in these templates are Compliance, Patches, Incident Management, Vulnerabilities Management, Cybersecurity Initiatives. All the content presented in this PPT design is completely editable. Download it and make adjustments in color, background, font etc. as per your unique business setting.
-
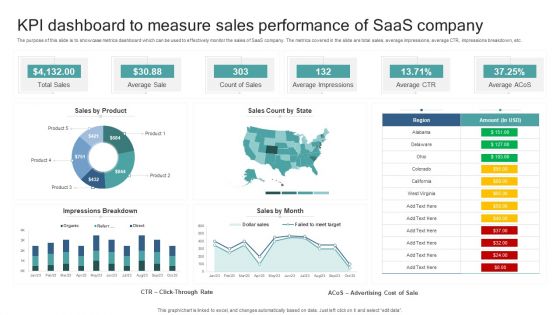
KPI Dashboard To Measure Sales Performance Of Saas Company Summary PDF
The purpose of this slide is to showcase metrics dashboard which can be used to effectively monitor the sales of SaaS company. The metrics covered in the slide are total sales, average impressions, average CTR, impressions breakdown, etc. Showcasing this set of slides titled KPI Dashboard To Measure Sales Performance Of Saas Company Summary PDF. The topics addressed in these templates are Total Sales, Average Sale, Count Of Sales, Average Impressions, Average Ctr. All the content presented in this PPT design is completely editable. Download it and make adjustments in color, background, font etc. as per your unique business setting.
-
Revenue Vs Expenses Dashboard Template Ppt PowerPoint Presentation Slides Tips PDF
Presenting this set of slides with name revenue vs expenses dashboard template ppt powerpoint presentation slides tips pdf. The topics discussed in these slides are revenue, projected revenue, marketing expenses, satisfaction rate, pipeline vs expected sales this year, revenue vs expense by month, customer satisfaction, tickets volume by priority. This is a completely editable PowerPoint presentation and is available for immediate download. Download now and impress your audience.
-
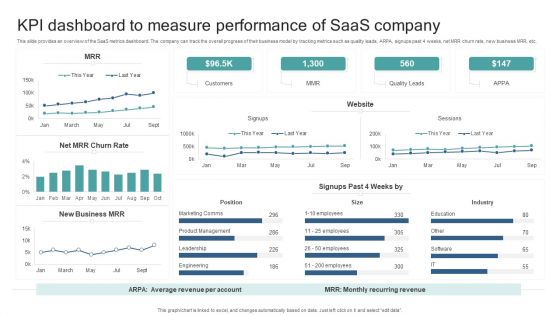
KPI Dashboard To Measure Performance Of Saas Company Introduction PDF
This slide provides an overview of the SaaS metrics dashboard. The company can track the overall progress of their business model by tracking metrics such as quality leads, ARPA, signups past 4 weeks, net MRR churn rate, new business MRR, etc. Pitch your topic with ease and precision using this KPI Dashboard To Measure Performance Of Saas Company Introduction PDF. This layout presents information on Industry, Position, Customers, Quality Leads. It is also available for immediate download and adjustment. So, changes can be made in the color, design, graphics or any other component to create a unique layout.
-
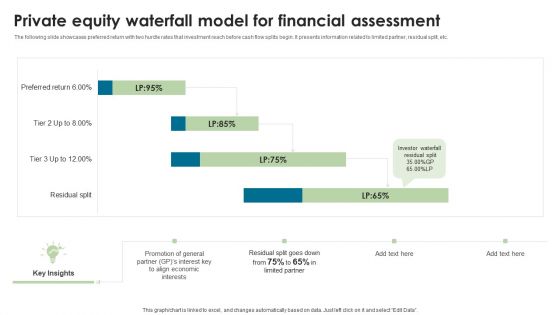
Private Equity Waterfall Model For Financial Assessment Sample PDF
The following slide showcases preferred return with two hurdle rates that investment reach before cash flow splits begin. It presents information related to limited partner, residual split, etc. Showcasing this set of slides titled Private Equity Waterfall Model For Financial Assessment Sample PDF. The topics addressed in these templates are Private Equity, Financial, Assessment. All the content presented in this PPT design is completely editable. Download it and make adjustments in color, background, font etc. as per your unique business setting.
-
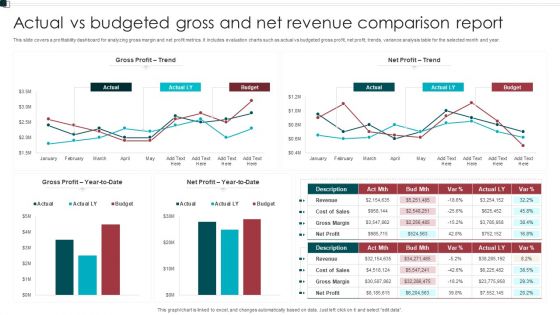
Actual Vs Budgeted Gross And Net Revenue Comparison Report Sample PDF
This slide covers a profitability dashboard for analyzing gross margin and net profit metrics. It includes evaluation charts such as actual vs budgeted gross profit, net profit, trends, variance analysis table for the selected month and year. Pitch your topic with ease and precision using this Actual Vs Budgeted Gross And Net Revenue Comparison Report Sample PDF. This layout presents information on Gross Profit, Net Profit, Budget. It is also available for immediate download and adjustment. So, changes can be made in the color, design, graphics or any other component to create a unique layout.
-
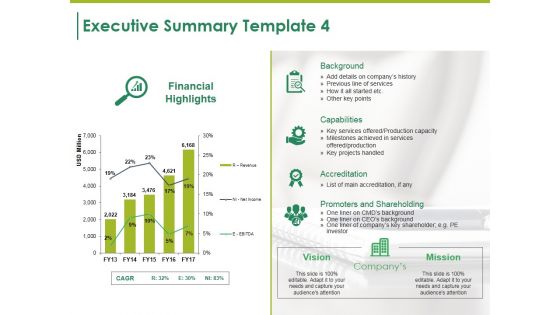
Executive Summary Template 4 Ppt PowerPoint Presentation Pictures File Formats
This is a executive summary template 4 ppt powerpoint presentation pictures file formats. This is a five stage process. The stages in this process are background, capabilities, accreditation, promoters and shareholding, vision.
-
Quality Kpis Dashboard With Project Portfolio Analysis Download PDF
This slide displays project health indicators to review and compare companys performance with quality parameters decided by management. It includes details about project schedule, tasks, budget and resources. Showcasing this set of slides titled Quality Kpis Dashboard With Project Portfolio Analysis Download PDF. The topics addressed in these templates are Schedule, Tasks, Budget, Resources. All the content presented in this PPT design is completely editable. Download it and make adjustments in color, background, font etc. as per your unique business setting.
-
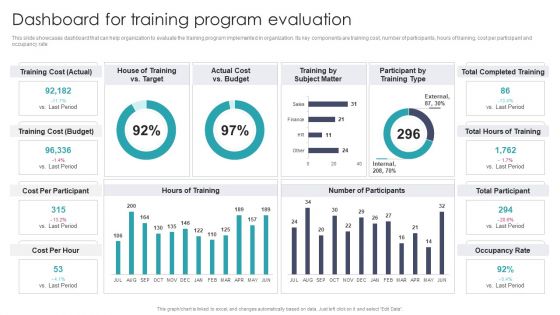
Dashboard For Training Program Evaluation Sample PDF
This slide showcases dashboard that can help organization to evaluate the training program implemented in organization. Its key components are training cost, number of participants, hours of training, cost per participant and occupancy rate. Slidegeeks is one of the best resources for PowerPoint templates. You can download easily and regulate Dashboard For Training Program Evaluation Sample PDF for your personal presentations from our wonderful collection. A few clicks is all it takes to discover and get the most relevant and appropriate templates. Use our Templates to add a unique zing and appeal to your presentation and meetings. All the slides are easy to edit and you can use them even for advertisement purposes.
-
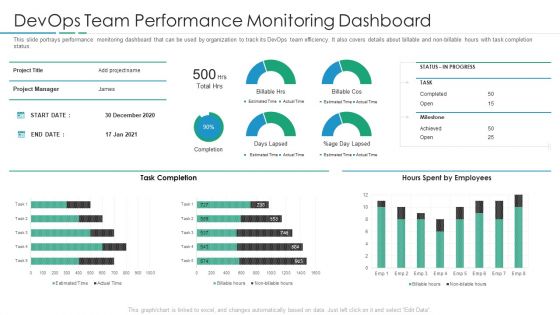
Devops Team Performance Monitoring Dashboard Infographics PDF
Deliver an awe inspiring pitch with this creative devops team performance monitoring dashboard infographics pdf bundle. Topics like devops team performance monitoring dashboard can be discussed with this completely editable template. It is available for immediate download depending on the needs and requirements of the user.
-
Sales Kpi Tracker Ppt PowerPoint Presentation Pictures Designs
This is a sales kpi tracker ppt powerpoint presentation pictures designs. This is a two stage process. The stages in this process are leads created, sales ratio, opportunities won, top products in revenue, win ratio vs last yr.
-
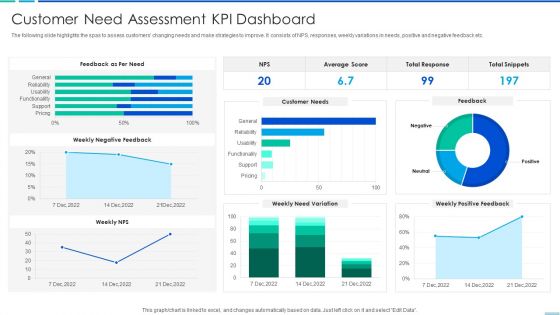
Customer Need Assessment Kpi Dashboard Infographics PDF
The following slide highlights the spas to assess customers changing needs and make strategies to improve. It consists of NPS, responses, weekly variations in needs, positive and negative feedback etc. Showcasing this set of slides titled customer need assessment kpi dashboard infographics pdf. The topics addressed in these templates are customer need assessment kpi dashboard. All the content presented in this PPT design is completely editable. Download it and make adjustments in color, background, font etc. as per your unique business setting.
-
Business Diagram Laptop With Data Driven Area Chart PowerPoint Slide
This diagram has been designed with laptop and data driven area chart. Download this diagram to give your presentations more effective look. It helps in clearly conveying your message to clients and audience.
-
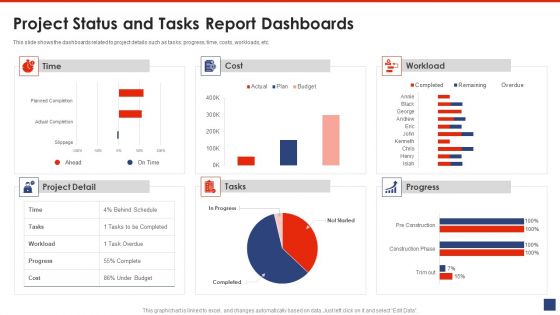
Writing A List Of Specific Project Objective For Project Review Project Status And Tasks Report Dashboards Designs PDF
This slide shows the dashboards related to project details such as tasks, progress, time, costs, workloads, etc.Deliver and pitch your topic in the best possible manner with this writing a list of specific project objective for project review project status and tasks report dashboards designs pdf Use them to share invaluable insights on project status and tasks report dashboards and impress your audience. This template can be altered and modified as per your expectations. So, grab it now.
-
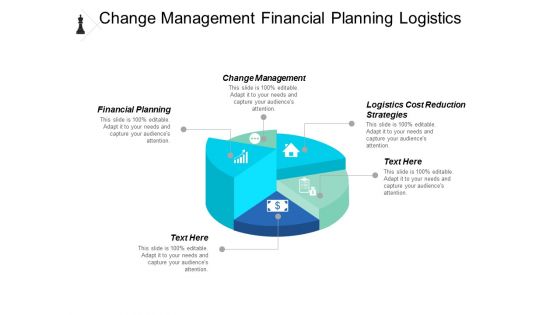
Change Management Financial Planning Logistics Cost Reduction Strategies Ppt PowerPoint Presentation Gallery Visuals
This is a change management financial planning logistics cost reduction strategies ppt powerpoint presentation gallery visuals. This is a five stage process. The stages in this process are change management, financial planning, logistics cost reduction strategies.
-
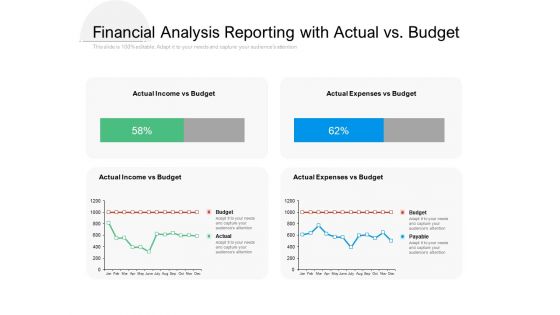
Financial Analysis Reporting With Actual Vs Budget Ppt PowerPoint Presentation Styles Format Ideas
Presenting this set of slides with name financial analysis reporting with actual vs budget ppt powerpoint presentation styles format ideas. The topics discussed in these slides are actual income vs budget, actual expenses vs budget . This is a completely editable PowerPoint presentation and is available for immediate download. Download now and impress your audience.
-
Business Diagram Three Trucks For Data Representation For Business PowerPoint Slide
This business diagram displays three trucks graphic. This diagram contains trucks for percentage value growth. Use this diagram to display business growth over a period of time.
-
Minimize Cloud Risks Medical Care Business Case Competition Challenge And Solutions 3 Employee Error Portrait PDF
This slide shows the problem that the company is facing related to improper and unaware employee behavior leading to data loss and misuse. Also, some solutions are provided to solve the problem. Deliver and pitch your topic in the best possible manner with this minimize cloud risks medical care business case competition challenge and solutions 3 employee error portrait pdf. Use them to share invaluable insights on security training programs, operating system maintenance, financial control procedures, training programs and impress your audience. This template can be altered and modified as per your expectations. So, grab it now.
-
Human Resource Annual Report With Headcount Ppt PowerPoint Presentation Icon Influencers PDF
Presenting this set of slides with name human resource annual report with headcount ppt powerpoint presentation icon influencers pdf. The topics discussed in these slides are starters, headcount, leavers, promotions, male, female, 2019 to 2020. This is a completely editable PowerPoint presentation and is available for immediate download. Download now and impress your audience.
-
Dashboards Showing Consultancy Company Performance With Key Metrics Mockup PDF
Deliver and pitch your topic in the best possible manner with this dashboards showing consultancy company performance with key metrics mockup pdf. Use them to share invaluable insights on customers, top products, lowest customers, and impress your audience. This template can be altered and modified as per your expectations. So, grab it now.
-
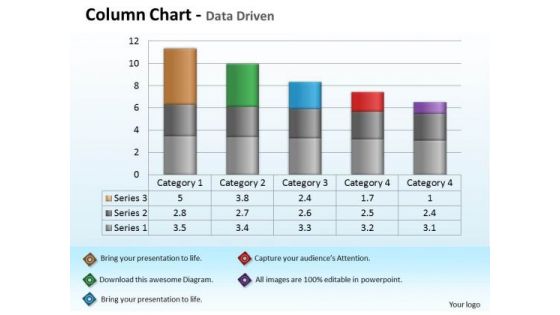
Quantitative Data Analysis Driven Economic With Column Chart PowerPoint Slides Templates
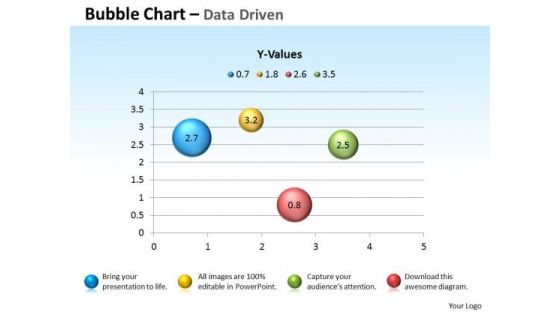
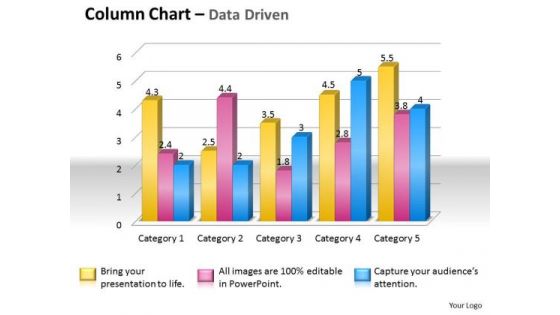
Add Some Dramatization To Your Thoughts. Our quantitative data analysis driven economic with column chart powerpoint slides Templates Make Useful Props.
-
Agile Sprint Management Report Dashboard Pictures PDF
This slide illustrates facts and figures related to sprint summary on agile project management. It includes total worked hours, story points, tasks, sprint velocity, scope charges, tasks by types, etc. Pitch your topic with ease and precision using this Agile Sprint Management Report Dashboard Pictures PDF. This layout presents information on Tasks By Status, Sprint Velocity, Scope Changes. It is also available for immediate download and adjustment. So, changes can be made in the color, design, graphics or any other component to create a unique layout.
-
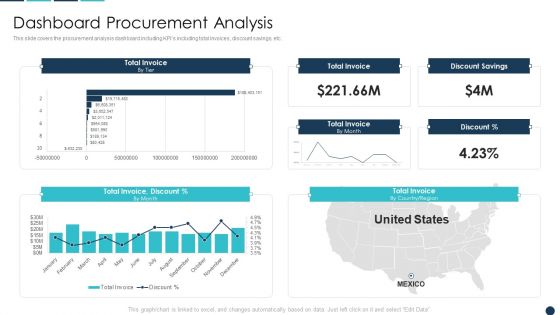
Procurement Analytics Tools And Strategies Dashboard Procurement Analysis Inspiration PDF
This slide covers the procurement analysis dashboard including KPIs including total invoices, discount savings, etc. Deliver and pitch your topic in the best possible manner with this Procurement Analytics Tools And Strategies Dashboard Procurement Analysis Inspiration PDF. Use them to share invaluable insights on Total Invoice, Discount Savings, Invoice Discount and impress your audience. This template can be altered and modified as per your expectations. So, grab it now.
-
Review Analytics Elements PDF
Deliver and pitch your topic in the best possible manner with this review analytics elements pdf. Use them to share invaluable insights on impressions, acquisitions, cost per acquisition, click through rate, cost per click and impress your audience. This template can be altered and modified as per your expectations. So, grab it now.
-
Organizational Diversity And Inclusion Preferences Diversity And Inclusion Dashboard Guidelines PDF
This infographic provides the D and I dashboard which covers region, gender identity, hiring, turnover, ethnicity of the employees. Deliver an awe inspiring pitch with this creative organizational diversity and inclusion preferences diversity and inclusion dashboard guidelines pdf bundle. Topics like gender distribution, hires by gender, turnover by ethnicity, turnover by gender, ethnicity distribution, hire by ethnicity can be discussed with this completely editable template. It is available for immediate download depending on the needs and requirements of the user.
-
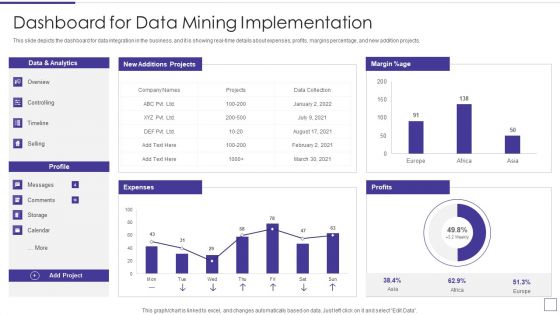
Data Mining Implementation Dashboard For Data Mining Implementation Pictures PDF
This slide depicts the dashboard for data integration in the business, and it is showing real-time details about expenses, profits, margins percentage, and new addition projects.Deliver and pitch your topic in the best possible manner with this data mining implementation dashboard for data mining implementation pictures pdf Use them to share invaluable insights on dashboard for data mining implementation and impress your audience. This template can be altered and modified as per your expectations. So, grab it now.
-
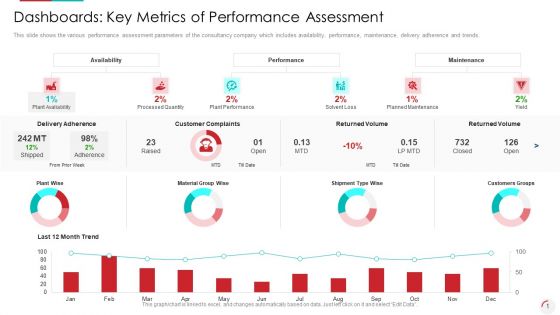
Dashboards Key Metrics Of Performance Assessment Summary PDF
Deliver and pitch your topic in the best possible manner with this dashboards key metrics of performance assessment summary pdf. Use them to share invaluable insights on delivery adherence, customer complaints, returned volume and impress your audience. This template can be altered and modified as per your expectations. So, grab it now.
-
HR Key Performance Indicators With Recruitment Funnel Ppt PowerPoint Presentation File Formats PDF
Presenting this set of slides with name hr key performance indicators with recruitment funnel ppt powerpoint presentation file formats pdf. The topics discussed in these slides are funnel, process, recruitment. This is a completely editable PowerPoint presentation and is available for immediate download. Download now and impress your audience.
-
Excel Data Analysis Data Tools Data Methods Statistical Chart For Process PowerPoint Templates
Blend Your Views With Our excel data analysis data tools data methods statistical chart for process Powerpoint Templates . They Are Made For Each Other.
-
Data Analysis Techniques 3d Grouped Bar Chart PowerPoint Templates
Place The Orders With Your Thoughts. Our data analysis techniques 3d grouped bar chart Powerpoint Templates Know The Drill.
-
Business Project Problems Management Report With Status Ppt PowerPoint Presentation Icon Professional PDF
Pitch your topic with ease and precision using this business project problems management report with status ppt powerpoint presentation icon professional pdf. This layout presents information on business project problems management report with status. It is also available for immediate download and adjustment. So, changes can be made in the color, design, graphics or any other component to create a unique layout.
-
Business Diagram Three Test Tubes With Magnifier For Data Search PowerPoint Slide
This business diagram displays three test tubes with magnifying glass. This diagram is suitable to depict flow of business activities or steps. Download this professional slide to present information in an attractive manner.
-
SIEM Services Security Information And Event Management Dashboard Source Ppt Outline Design Inspiration PDF
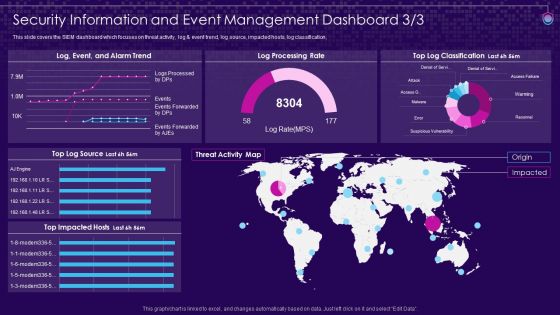
This slide covers the SIEM dashboard which focuses on threat activity, log and event trend, log source, impacted hosts, log classification, Deliver an awe inspiring pitch with this creative siem services security information and event management dashboard source ppt outline design inspiration pdf bundle. Topics like security information and event management dashboard can be discussed with this completely editable template. It is available for immediate download depending on the needs and requirements of the user.
-
Company Group Members Demographics Dashboard Overview Clipart PDF
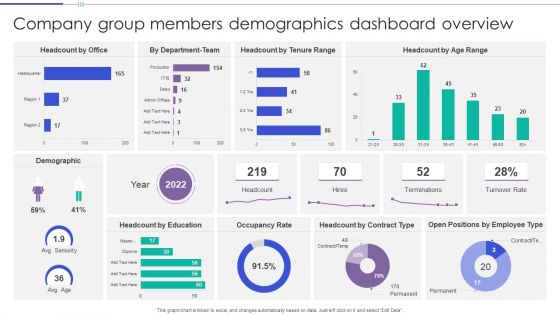
This graph or chart is linked to excel, and changes automatically based on data. Just left click on it and select Edit Data. Pitch your topic with ease and precision using this Company Group Members Demographics Dashboard Overview Clipart PDF. This layout presents information on Headcount Office, Headcount Tenure Range, Headcount Age Range. It is also available for immediate download and adjustment. So, changes can be made in the color, design, graphics or any other component to create a unique layout.
-
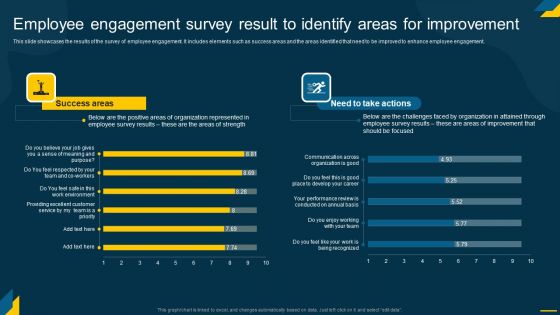
Engaging Employees Strategic Employee Engagement Survey Result To Identify Areas Brochure PDF
This slide showcases the results of the survey of employee engagement. It includes elements such as success areas and the areas identified that need to be improved to enhance employee engagement. Present like a pro with Engaging Employees Strategic Employee Engagement Survey Result To Identify Areas Brochure PDF Create beautiful presentations together with your team, using our easy-to-use presentation slides. Share your ideas in real-time and make changes on the fly by downloading our templates. So whether youre in the office, on the go, or in a remote location, you can stay in sync with your team and present your ideas with confidence. With Slidegeeks presentation got a whole lot easier. Grab these presentations today.
-
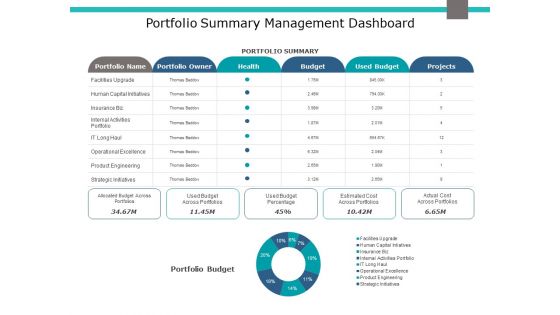
Portfolio Summary Management Dashboard Ppt PowerPoint Presentation Pictures Visuals
This is a portfolio summary management dashboard ppt powerpoint presentation pictures visuals. This is a six stage process. The stages in this process are finance, marketing, management, investment.
-
Comparative Monthly Sales Report By Region Graphics PDF
The following slide highlights the comparative monthly sales by region illustrating key headings which includes monthly sales by region, monthly sales by quantity, product sales distribution and monthly sales revenue by product. Showcasing this set of slides titled Comparative Monthly Sales Report By Region Graphics PDF. The topics addressed in these templates are Sales Revenue, Monthly Sales Quantity, Product Sales Distribution. All the content presented in this PPT design is completely editable. Download it and make adjustments in color, background, font etc. as per your unique business setting.
-
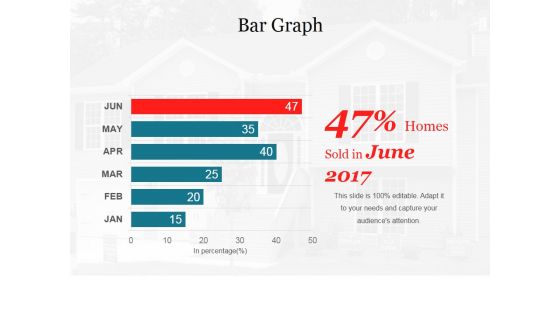
Bar Graph Ppt PowerPoint Presentation File Picture
This is a bar graph ppt powerpoint presentation file picture. This is a six stage process. The stages in this process are management, planning, marketing, business, strategy.
-
Managing Employee Turnover Dashboard For Employee Retention Polices Ideas PDF
Purpose of the following slide is to show the Employee Attrition dashboard as it highlights the Employee turnover rate, average seniority of employees in months, year-over-year turnover rate etc.Deliver an awe inspiring pitch with this creative Managing Employee Turnover Dashboard For Employee Retention Polices Ideas PDF bundle. Topics like Turnover Rate, Employees These, Actual Seniority can be discussed with this completely editable template. It is available for immediate download depending on the needs and requirements of the user.
-
Warehouse Management System Functions Structure PDF
The purpose of this slide is to provide a glimpse of the problems faced by our logistic company at present such as fuel costs, lack of technology, government regulations, inventory management etc. Deliver an awe inspiring pitch with this creative warehouse management system functions structure pdf bundle. Topics like warehouse management system wms dashboard can be discussed with this completely editable template. It is available for immediate download depending on the needs and requirements of the user.
-
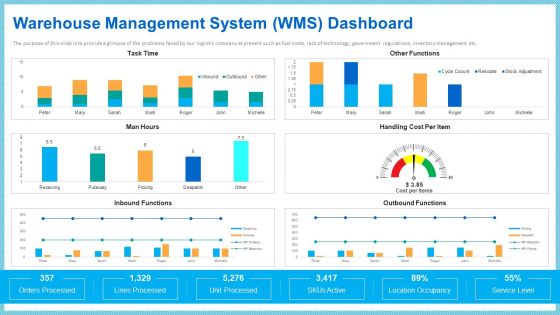
Warehouse Management System Wms Dashboard Mockup PDF
The purpose of this slide is to provide a glimpse of the problems faced by our logistic company at present such as fuel costs, lack of technology, government regulations, inventory management etc. Deliver and pitch your topic in the best possible manner with this warehouse management system wms dashboard mockup pdf. Use them to share invaluable insights on order status graph, warehouse capacity, warehouse status and impress your audience. This template can be altered and modified as per your expectations. So, grab it now.
-
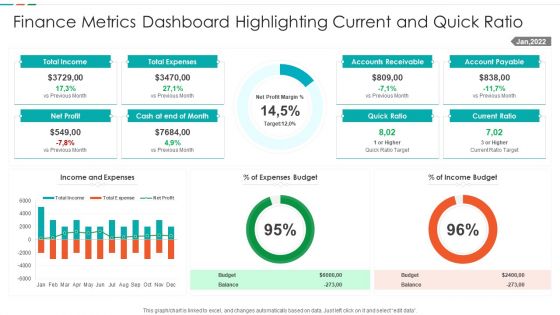
Finance Metrics Dashboard Highlighting Current And Quick Ratio Template PDF
This graph or chart is linked to excel, and changes automatically based on data. Just left click on it and select edit data. Showcasing this set of slides titled Finance Metrics Dashboard Highlighting Current And Quick Ratio Template PDF. The topics addressed in these templates are Total Income Budget, Total Expenses Balance, Net Profit Quick, Ratio Current Ratio. All the content presented in this PPT design is completely editable. Download it and make adjustments in color, background, font etc. as per your unique business setting.
-
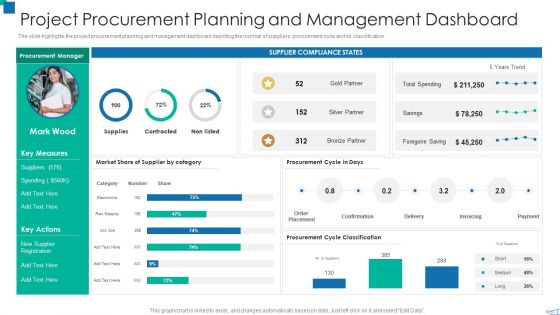
Project Procurement Planning And Management Dashboard Designs PDF
Pitch your topic with ease and precision using this project procurement planning and management dashboard designs pdf. This layout presents information on suppliers, market share, procurement. It is also available for immediate download and adjustment. So, changes can be made in the color, design, graphics or any other component to create a unique layout.
-
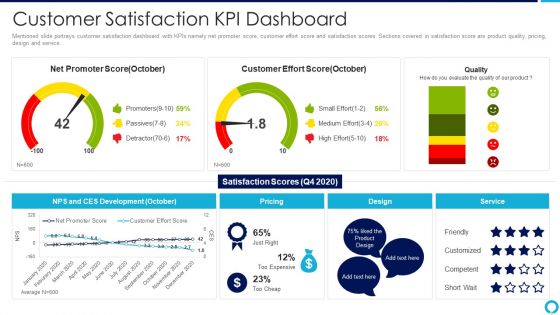
Partnership Management Strategies Customer Satisfaction Kpi Dashboard Clipart PDF
Mentioned slide portrays customer satisfaction dashboard with KPIs namely net promoter score, customer effort score and satisfaction scores. Sections covered in satisfaction score are product quality, pricing, design and service.Deliver an awe inspiring pitch with this creative partnership management strategies customer satisfaction kpi dashboard clipart pdf bundle. Topics like customer satisfaction kpi dashboard can be discussed with this completely editable template. It is available for immediate download depending on the needs and requirements of the user.
-
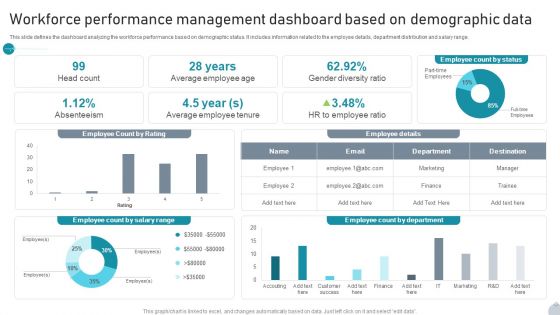
Workforce Performance Management Dashboard Based On Demographic Data Information PDF
This slide defines the dashboard analyzing the workforce performance based on demographic status. It includes information related to the employee details, department distribution and salary range. Showcasing this set of slides titled Workforce Performance Management Dashboard Based On Demographic Data Information PDF. The topics addressed in these templates are Employee Details, Department, Gender Diversity Ratio All the content presented in this PPT design is completely editable. Download it and make adjustments in color, background, font etc. as per your unique business setting.
-
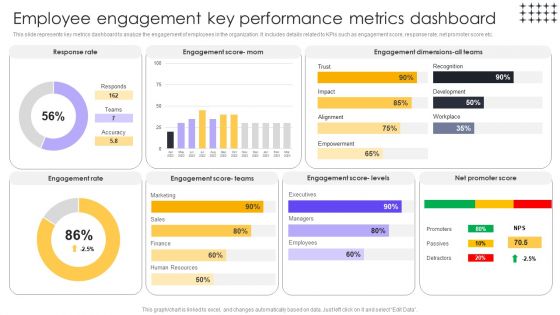
Tools For HR Business Analytics Employee Engagement Key Performance Metrics Brochure PDF
This slide represents key metrics dashboard to analyze the engagement of employees in the organization. It includes details related to KPIs such as engagement score, response rate, net promoter score etc. Make sure to capture your audiences attention in your business displays with our gratis customizable Tools For HR Business Analytics Employee Engagement Key Performance Metrics Brochure PDF. These are great for business strategies, office conferences, capital raising or task suggestions. If you desire to acquire more customers for your tech business and ensure they stay satisfied, create your own sales presentation with these plain slides.
-
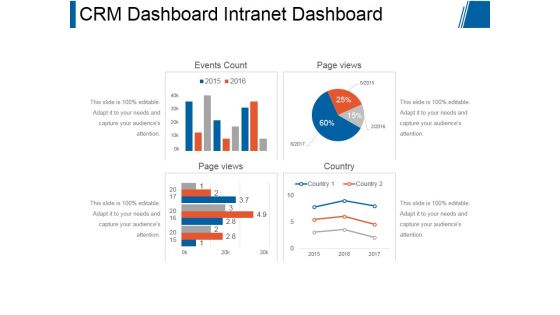
Crm Dashboard Intranet Dashboard Ppt PowerPoint Presentation Model
This is a crm dashboard intranet dashboard ppt powerpoint presentation model. This is a four stage process. The stages in this process are events count, page views, page views, country.
-
Employee Performance Improvement Framework Determine Employee Performance Tracker Infographics PDF
This slide provides information about employee performance tracker dashboard which covers details in context to employee training, etc. Deliver an awe inspiring pitch with this creative employee performance improvement framework determine employee performance tracker infographics pdf bundle. Topics like outstanding, needs improvement sufficient, strong, current quarterly review can be discussed with this completely editable template. It is available for immediate download depending on the needs and requirements of the user.
-
Top Trends In Social Media Analytics Cracking The Code Of Social Media
This slide showcases the top trends in Social Media Analytics. The purpose of this slide is to highlight the top trends in Social Media Analytics such as artificial intelligence, data is an inspiration but not just information, AI will connect the gap between social listening and insight, etc. Present like a pro with Top Trends In Social Media Analytics Cracking The Code Of Social Media. Create beautiful presentations together with your team, using our easy-to-use presentation slides. Share your ideas in real-time and make changes on the fly by downloading our templates. So whether you are in the office, on the go, or in a remote location, you can stay in sync with your team and present your ideas with
-
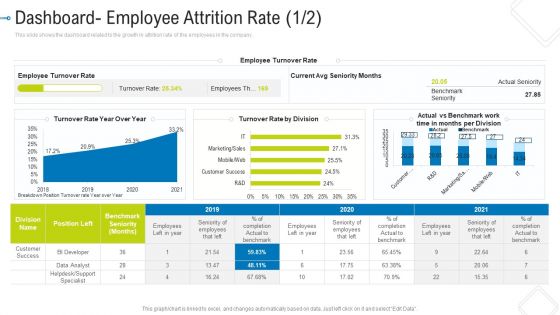
Dashboard Employee Attrition Rate Seniority Template PDF
This slide shows the dashboard related to the growth in attrition rate of the employees in the company .Deliver an awe inspiring pitch with this creative dashboard employee attrition rate seniority template pdf bundle. Topics like employee turnover rate, benchmark seniority, current avg seniority months can be discussed with this completely editable template. It is available for immediate download depending on the needs and requirements of the user.
-
Dashboard Indicating Hr Advisory Services Team Performance
This slide illustrates HR consultancy team performance dashboard. It provides information about hours of consultation, satisfaction rate, per consultant rate, popular counselors, etc. Pitch your topic with ease and precision using this dashboard indicating hr advisory services team performance download pdf. This layout presents information on dashboard indicating hr advisory services team performance. It is also available for immediate download and adjustment. So, changes can be made in the color, design, graphics or any other component to create a unique layout.
-
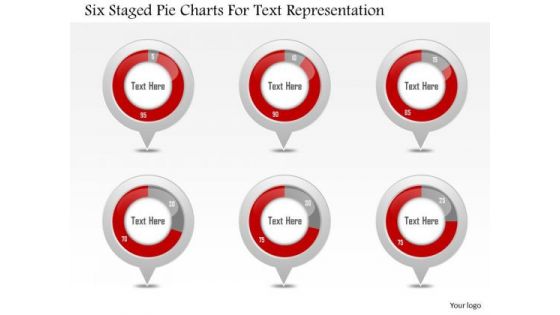
Business Diagram Six Staged Pie Charts For Text Representation PowerPoint Slide
This slide displays graphic six staged pie charts. Download this diagram to present and compare business data. Use this diagram to display business process workflows in any presentation.
-
Web Analytics Charts Visits Bounce Rate Page Views Ppt PowerPoint Presentation Icon Layouts
This is a web analytics charts visits bounce rate page views ppt powerpoint presentation icon layouts. This is a six stage process. The stages in this process are digital analytics, digital dashboard, marketing.
-
Hiring Project Periodically Analytics Dashboard Summary PDF
The following slide highlights the hiring project quarterly analytics dashboard illustrating gender distribution, hiring by gender, turnover by gender, ethnicity distribution, hires by ethnicity and turnover by ethnicity. It assist organization to assess the diversity in company Showcasing this set of slides titled hiring project periodically analytics dashboard summary pdf. The topics addressed in these templates are hiring project periodically analytics dashboard. All the content presented in this PPT design is completely editable. Download it and make adjustments in color, background, font etc. as per your unique business setting.

 Home
Home 


