Annual Chronic Patients Change Linear Chart Demonstration PDF
- Google Slides is a new FREE Presentation software from Google.
- All our content is 100% compatible with Google Slides.
- Just download our designs, and upload them to Google Slides and they will work automatically.
- Amaze your audience with SlideGeeks and Google Slides.
-
Want Changes to This PPT Slide? Check out our Presentation Design Services
- WideScreen Aspect ratio is becoming a very popular format. When you download this product, the downloaded ZIP will contain this product in both standard and widescreen format.
-

- Some older products that we have may only be in standard format, but they can easily be converted to widescreen.
- To do this, please open the SlideGeeks product in Powerpoint, and go to
- Design ( On the top bar) -> Page Setup -> and select "On-screen Show (16:9)” in the drop down for "Slides Sized for".
- The slide or theme will change to widescreen, and all graphics will adjust automatically. You can similarly convert our content to any other desired screen aspect ratio.
Compatible With Google Slides

Get This In WideScreen
You must be logged in to download this presentation.
 Impress Your
 Audience
 100%
100% Editable
Google Slides
Features of these PowerPoint presentation slides:
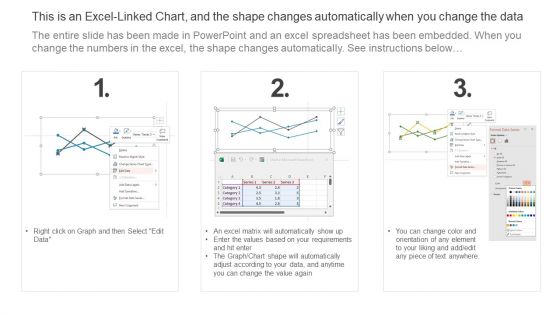
The following slide highlights the percentage change of chronically ill patients. It shows the annual percentage change for the for a decade Showcasing this set of slides titled Annual Chronic Patients Change Linear Chart Demonstration PDF. The topics addressed in these templates are Key Observations, Annual Percentage, Linear Chart. All the content presented in this PPT design is completely editable. Download it and make adjustments in color, background, font etc. as per your unique business setting.
People who downloaded this PowerPoint presentation also viewed the following :
Most Relevant Reviews
-
Colors used are bright and distinctive.
-
Excellent products for quick understanding.

 Home
Home 


